
Pick This again
/
Since I last wrote about it, Pick This! has matured. We have continued to improve the tool, which is a collaboration between Agile and the 100% awesome Steve Purves at Euclidity.
Here's some of the new stuff we've added:
- Multiple lines and polygons for each interpretation. This was a big limitation; now we can pick multiple fault sticks, say.
- 'Preshows', to show the interpreter some text or an image before they interpret. In beta, talk to us if you want to try it.
- Interpreter cohorts, with randomized selection, so we can conduct blind trials. In beta, again, talk to us.
- Complete picking history, so we can replay the entire act of interpretation. Coming soon: new visualizations of results that use this data.
Some of this, such as replaying the entire picking event, is of interest to researchers who want to know how experts interpret images. Remotely sensed images — whether in geophysics, radiology, astronomy, or forensics — are almost always ambiguous. Look at these faults, for example. How many are there? Where are they exactly? Where are their tips?

A seismic line from the Browse Basin, offshore western Australia. Data courtesy of CGG and the Virtual Seismic Atlas
Most of the challenges on the site are just fun challenges, but some — like the Browse Basin challenge, above — are part of an experiment by researchers Juan Alcalde and Clare Bond at the University of Aberdeen. Please help them with their research by taking part and making an interpretation! It would also be super if you could fill out your profile page — that will help Juan and Clare understand the results.
If you're at the AAPG conference in Denver then you can win bonus points by stopping by Booth 404 to visit Juan and Clare. Ask them all about their fascinating research, and say hello from us!
While you're on the site, check out some of the other images — or upload one yourself! This one was a real eye-opener: time-lapse seismic reflections from the water column, revealing dynamic thermohaline stratification. Can you pick this?
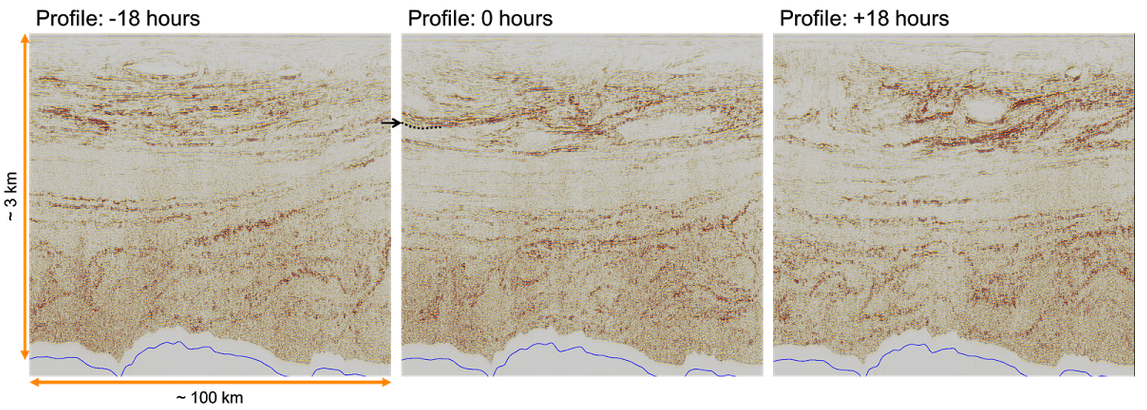
Pick This challenge showing time-lapse frames from a marine 3D. The seabed is shown in blue at the bottom of the images.


 Except where noted, this content is licensed