
Murphy's Law for Excel
/Where would scientists and engineers be without Excel? Far, far behind where they are now, I reckon. Whether it's a quick calculation, or making charts for a thesis, or building elaborate numerical models, Microsoft Excel is there for you. And it has been there for 32 years, since Douglas Klunder — now a lawyer at ACLU — gave it to us (well, some of us: the first version was Mac only!).
We can speculate about reasons for its popularity:
- It's relatively easy to use, and most people started long enough ago that they don't have to think too hard about it.
- You have access to it, and you know that your collaborators (boss, colleagues, future self) have access to it.
- It's flexible enough that it can do almost anything.

Figure 1 from 'Predicting bed thickness with cepstral decomposition'.
For instance, all the computation and graphics for my two 2006 articles on signal processing were done in Excel (plus the FFT add-on). I've seen reservoir simulators, complete with elaborate user interfaces, in Excel. An infinity of business-critical documents are stored in Excel (I just filled out a vendor registration form for a gigantic multinational in an Excel spreadsheet). John Nelson at ESRI made a heatmap in Excel. You can even play Pac Man.
Maybe it's gone too far:
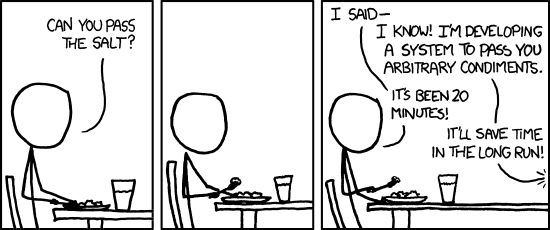
Murphy's law for Excel: what people can make in Excel, people will make in Excel
— Lukas Mosser (@porestar) July 29, 2017
So what's wrong with Excel?
Nothing is wrong with it, but it's not the best tool for every number-crunching task. Why?
- Excel files are just that — files. Sometimes you want to do analysis across datasets, and a pool of data (a database) becomes more useful. And sometimes you wish nine different people didn't have nine different versions of your spreadsheet, each emailing their version to nine other people...
- The charts are rather clunky and static. They don't do well with large datasets, or in data you'd like to filter or slice dynamically.
- In large datasets, scrolling around a spreadsheet gets old pretty quickly.
- The tool is so flexible that people get carried away with pretty tables, annotating their sheets in ways that make the printed page look nice, but analysis impossible.
What are the alternatives?
Excel is a wonder-tool, but it's not the only tool. There are alternatives, and you should at least know about them.
For everyday spreadsheeting needs, I now use Google Sheets. Collaboration is built-in. Being able to view and edit a sheet at the same time as someone else is a must-have (probably Office 365 does this now too, so if you're stuck with Excel I urge you to check). Version control — another thing I'm not sure I can live without — is built in. For real nerds, there's even a complete API. I also really like the native 'webbiness' of Google Docs, for example being able to use web API calls natively, for example getting the current CAD–USD exchange rate with GoogleFinance("CURRENCY:CADUSD").
If it's graphical analysis you want, try Tableau or Spotfire. I'm especially looking at you, reservoir engineers — you are seriously missing out if you're stuck in Excel, especially if you have a lot of columns of different types (time series, categories and continuous variables for example). The good news is that the fastest way to get data into Spotfire is... Excel. So it's easy to get started.
If you're gathering information from people, like registering the financial details of vendors for instance, then a web form is your best bet. You can set one up in Google Forms in minutes, and there are lots of similar services. If you want to use your own servers, no problem: any dev worth their wages can throw one together in a few hours.
If you're doing geoscience in Excel, like my 2006 self — filtering logs, or generating synthetics, or computing spectrums — your mind will be blown by spending a few hours learning a programming language. Your first day in Python (or Julia or Octave or R) will change your quantitative life forever.
Excel is great at some things, but for most things, there's a better way. Take some time to explore them the next time you have some slack in your schedule.
References
Hall, M (2006). Resolution and uncertainty in spectral decomposition. First Break 24, December 2006, p 43–47.
Hall, M (2006). Predicting stratigraphy with cepstral decomposition. The Leading Edge 25 (2, Special Issue on Spectral Decomposition). doi:10.1190/1.2172313
UPDATE
As a follow-up example, I couldn't resist sharing this recent story about an artist that draws anime characters in Excel.


 Except where noted, this content is licensed