A machine learning safety net

A while back, I wrote about machine learning safety measures. I was thinking about how easy it is to accidentally make terrible models (e.g. training a support vector machine on unscaled data), or misuse good models (e.g. forgetting to scale data before making a prediction). I suggested that one solution might be to make tools that help spot these kinds of mistakes:

[We should build] software to support good practice. Many of the problems I’m talking about are quite easy to catch, or at least warn about, during the training and evaluation process. Unscaled features, class imbalance, correlated features, non-IID records, and so on. Education is essential, but software can help us notice and act on them.

Introducing redflag

I’m pleased, and a bit nervous, to introduce redflag, a new Python library to help find the sorts of issues I’m describing. The vision for this tool is as a kind of safety net, or ‘entrance exam for data’ (a phrase Evan coined several years ago). It should be able to look at an array (or Pandas DataFrame), and flag potential issues, perhaps generating a report. And it should be able to sit in your Scikit-Learn pipeline, watching for issues.

The current version, 0.1.9 is still rather rough and experimental. The code is far from optimal, with quite a bit of repetition. But it does a few useful things. For example, suppose we have a DataFrame with a column, Lithology, which contains strings denoting 9 rock types (‘sandstone’, ‘limestone’, etc). We’d like to know if the classes are ‘balanced’ — present in roughly similar numbers — or not. If they are not, we will have to be careful with how we split this dataset up for our model evaluation workflow.

>>> import redflag as rf
>>> rf.imbalance_degree(df['Lithology'])
3.37859304086633
>>> rf.imbalance_ratio([df['Lithology'])
8.347368421052632

The imbalance degree, defined by Ortigosa-Hernandez et al. (2017), tells us that there are 4 minority classes (the next integer above this number), and that the imbalance severity is somewhere in the middle (3.1 would be well balanced, 3.9 would be strongly imbalanced). The simpler imbalance ratio tells us that there’s about 8 times as much of the biggest majority class as of the smallest minority class. Conclusion: depending on the size of this dataset, the class imbalance is probably not a show-stopper, but we need to pay attention.

Our dataset contains well log data. Unless they are very far apart, well log samples are usually not independent — they are correlated in depth — and this means we can’t split the data randomly in our evaluation workflow. Redflag has a function to help detect features that are correlated to themselves in this way:

>>> rf.is_correlated(df['GR'])
True

We need to be careful!

Another function, rf.wasserstein() computes the Wasserstein distance, aka the earth mover’s distance, between distributions. This can help us figure out if our data splits all have similar distributions or not — an important condition of our evaluation workflow. I’ll feed it 3 splits in which I have forgotten to scale the first feature (i.e. the first column) in the X_test dataset:

>>> rf.wasserstein([X_train, X_val, X_test])
array([[32.108,  0.025,  0.043,  0.034],
       [16.011,  0.025,  0.039,  0.057],
       [64.127,  0.049,  0.056,  0.04 ]])

The large distances in the first column are the clue that the distribution of the data in this column varies a great deal between the three datasets. Plotting the distributions make it clear what happened.

Working with sklearn

Since we’re often already working with scikit-learn pipelines, and because I don’t really want to have to remember all these extra steps and functions, I thought it would be useful to make a special redflag pipeline that runs “all the things”. It’s called rf.pipeline and it might be all you need. Here’s how to use it:

from sklearn.pipeline import make_pipeline
from sklearn.preprocessing import StandardScaler
from sklearn.svm import SVC

pipe = make_pipeline(StandardScaler(), rf.pipeline, SVC())

Here’s what this object contains:

Pipeline(steps=[('standardscaler', StandardScaler()),
                ('pipeline',
                 Pipeline(steps=[('rf.imbalance', ImbalanceDetector()),
                                 ('rf.clip', ClipDetector()),
                                 ('rf.correlation', CorrelationDetector()),
                                 ('rf.outlier', OutlierDetector()),
                                 ('rf.distributions',
                                  DistributionComparator())])),
                ('svc', SVC())])

Those redflag items in the inner pipeline are just detectors — think of them like smoke alarms — they do not change any data. Some of them acquire statistics during model fitting, then apply them during prediction. For example, the DistributionComparator learns the feature distributions from the training data, then compares the prediction data to them, to help ensure that you aren’t trying to extrapolate with your model. For example, it will warn you if you train a model on low-GR sandstones then try to predict on high-GR shales.

Here’s what happens when I fit my data with this pipeline:

These are just warnings, and it’s up to me to act on them. I can adjust detection thresholds and other aspects of the algorithms under the hood, but the goal is for redflag to wave its little flag, but not to get in the way. Apart from the warnings, this pipeline works exactly as it did before.


If this project sounds interesting or useful to you, please give it a look. The documentation is here, and contains more examples like those above. If you find bugs or want to request enhancements, there’s the GitHub Issues page. And if you use it for anything you can share, I’d love to hear how you get along!

Agile* is closing

After almost 12 years of consulting, teaching, writing, and hacking, it’s time for Agile* to close its laptops for the last time. We’ll be shutting down at the end of September.

When I quit my job and moved to Nova Scotia in 2010, I had no idea if Agile* was going to work at all. I knew there was a chance I’d be looking for work within a year, possibly even having to move back to Calgary, or on to somewhere else to find it. But with Evan — and later Ben, Justin, Kara, Tracy, Diego, Martin and Rob — we did more than just survive. We built a solid business providing services to governments, startups, and global corporations, as well as training, community events, and open source software to students and seasoned professionals alike. I think we had an impact well beyond our small size. And it was fun.

I’m so grateful to the global community of earth scientists and engineers that cheered us on, read the blog, bought the books, and hired us for work. If you’re reading this, you’ve almost certainly been part of it. Thank you. It’s not an exaggeration to say that all of it would have been impossible without your cheers, loud or soft.

You may be wondering what’s next. I’m excited to share that my family and I are moving back to Norway. Although I’ll always be a geoscientist at heart, I’m switching careers and joining Equinor as a software developer. I’m looking forward to learning tons and finding new ways to apply myself and, I hope, contributing to Equinor’s inspiring open source software program. For sure I’ll still be around the Software Underground on a daily basis. Maybe I’ll even keep blogging.

For now though, I’m going on holiday. Have an awesome summer 🚀

Matt and Evan at the Paris hackathon in 2017.

Love Python and seismic? You need xarray

If you use Python on a regular basis, you might have noticed that Pandas is eating everything, not just things made out of bamboo.

But one thing Pandas is not useful for is 2-D or 3-D (or more-D) seismic data. Its DataFrames are implicitly two-dimensional tables, and shine when the columns represent all sorts of different quantities, e.g. different well logs. But, the really powerful thing about a DataFrame is its index. Instead of having row 0, row 1, etc, we can use an index that makes sense for the data. For example, we can use depth for the index and have row 13.1400 and row 13.2924, etc. Much easier than trying to figure out which index goes with 13.1400 metres!

Seismic data, on the other hand, does not fit comfortably in a table. But it would certainly be convenient to have real-world coordinates for the data as well as NumPy indices — maybe inline and crossline numbers, or (UTMx, UTMy) position, or the actual time position of the timeslices in milliseconds. With xarray we can.

In essence, xarray brings you Pandas-like indexing for n-dimensional arrays. Let’s see why this is useful.

Make an xarray.DataArray

The DataArray object is analogous to a NumPy array, but with the Pandas-like indexing added to each dimension via a property called coords. Furthermore, each dimension has a name.

Imagine we have a seismic volume called seismic with shape (inlines, xlines, time) and the inlines and crosslines are both numbered like 1000, 1001, 1002, etc. The time samples are 4 ms apart. All we need is an array of numbers representing inlines, another for the xlines, and another for the time samples. Then we can construct the DataArray like so:

 
import xarray as xr

il, xl, ts = seismic.shape  # seismic is a NumPy array.

inlines = np.arange(il) + 1000
xlines = np.arange(xl) + 1000
time = np.arange(ts) * 0.004

da = xr.DataArray(seismic,
                  name='amplitude',
                  coords=[inlines, xlines, time],
                  dims=['inline', 'xline', 'twt'],
                  )

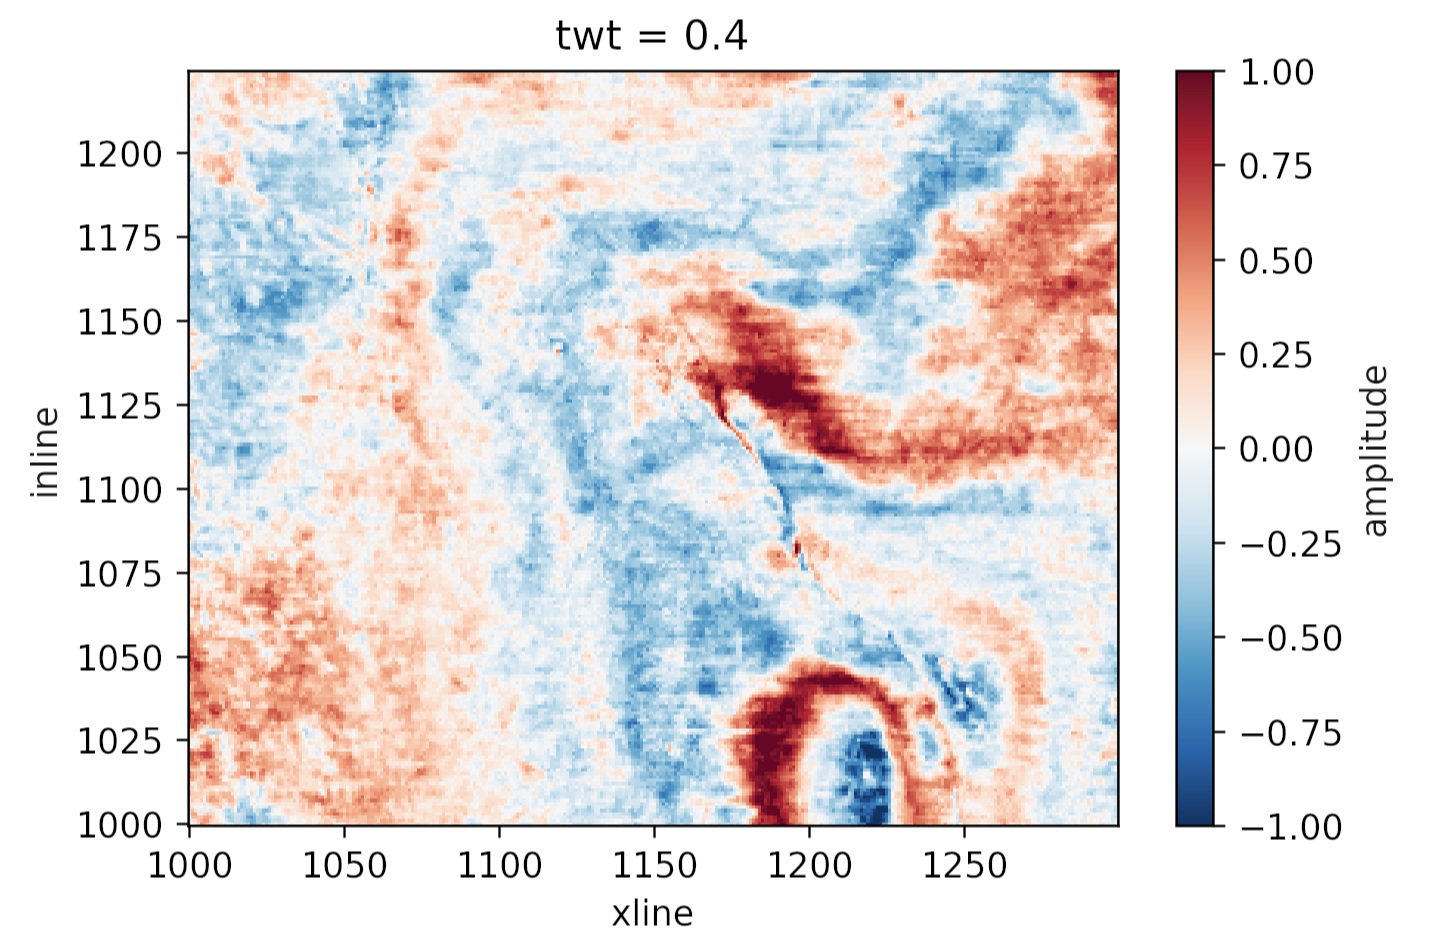
This object da has some nice superpowers. For example, we can visualize the timeslice at 400 ms with a single line:

da.sel(twt=0.400).plot()

to produce this plot:

Plotting the same thing from the NumPy array would require us to figure out which index corresponds to 400 ms, and then write at least 8 lines of matplotlib code. Nice!

What else?

Why else might we prefer this data structure over a simple NumPy array? Here are some reasons:

  • Extracting amplitude (or whatever) on a horizon. In particular, if the horizon is another DataArray with the same dims as the volume, this is a piece of cake.

  • Extracting amplitude along a wellbore (again, use the same dims for the well path).

  • Making an arbitrary line (a view not aligned with the rows/columns) is easier, because interpolation is ‘free’ with xarray.

  • Exchanging data with Pandas DataFrame objects is easy, making reading from certain formats (e.g. OpendTect horizon export, which gives you inline, xline coords, not a grid) much easier. Even better: use our library gio for this! It makes xarray objects for you.

  • If you have multiple attributes, then xarray.Dataset is a nice data structure to keep things straight. You can think of it as a dictionary of DataArray objects, but it’s a lot more than that.

  • You can store arbitrary metadata in xarray objects, so it’s easy to attach things you’d like to retain like data rights and permissions, seismic attribute parameters, data acquisition details, and so on.

  • Adding more dimensions is easy, e.g. offset or frequency, because you can just add more dims and associated coords. It can get hard to keep these straight in NumPy (was time on the 3rd or 4th axis?).

  • Taking advantage of Dask, which gives you access to parallel processing and out-of-core operations.

All in all, definitely worth a look for anyone who uses NumPy arrays to represent data with real-world coordinates.


Do you already use xarray? What kind of data does it help you with? What are your reasons? Did I miss anything from my list? Let us know in the comments!

Build an app with Python

Do you have an idea for an app?

Or maybe a useful bit of code you want to share with others, but you’re not sure where to start?

Lots of people come to our Geocomputing class — which is for outright beginners — saying, "I want to build an app". Most of them are thinking of a mobile or desktop app, but most beginners don't know much about the alternatives. Getting useful software into other people’s hands doesn’t necessarily mean making a desktop application. Alternatives include programming libraries, command line tools, and web applications with or without public machine interfacecs (so-called APIs) — and it’s hard to discover and learn about things you don’t know exist.

Now, coming up with a streamlined set of questions to figure out which kind of tool might best match your goals for ‘an app’ is probably impossible. So I gave it a try:

There’s a lot of undocumented nuance in this flowchart. For example:

  • There are a lot of other ways to achieve all of the things I mention in the orange boxes. I picked on some examples, but you could also make a web app — with an API — with Flask or Django. You can make a library or CLI (command line interface) tool with modules from the standard library. There are lots of ways to build a desktop app with a GUI (none of them exactly easy). Indeed, you can run a web app on the desktop in various ways.

  • You might be wondering, “where is ‘Build a mobile app’?” It’s not there. I don’t think building native mobile apps is usually the best idea, especially for relative beginners to Python. Web apps are easier to make, they work on any platform, and are easier to maintain. It helps if you’re online of course, but it is possible to write web apps that work offline too.

  • The main idea is to make something. You want to build the easiest or fastest thing that solves the problem for a few important users and use cases. Because if you can make something they will at least test a few times, you can get some awesome feedback for the next iteration — which might be a completely different thing.

So, take it with a large grain of salt! I hope it’s a tiny bit useful, and at least gives you some things to Google the next time you’re thinking about building ‘an app’.


I tweeted about this flowchart. If you want to adapt it for your own purposes, the original is here.

Thank you to Software Undergrounders Rafael, Lukas, Leo, Kent, Rob, Martin and Evan for helping me improve it. I’m still responsible for its many flaws.

The machine learning algo zoo

One of the wonderful, but also baffling, things about machine learning is that there are so many ways to do it. At some very high level, most of them do something like this (highlighting some jargon):

  1. The human settles on a task (“Predict lithology”) and finds a bunch of data relevant to that task (say, some well logs A, B, and C). Then the human has to come up with some known instances or examples where these well log data go with those lithology labels.

  2. Stuff the logs into an equation. Not an equation like A + B + C, because there’s nothing to tweak in that equation. The equation needs parameters or coefficients, like \(\alpha A + \beta B + \gamma C\). The machine can tweak those Greek letters to change the output. At first, they’ll be random guesses.

  3. See how the output of that equation, which is the machine’s prediction, compares to the known labels. Come up with another equation whose output is a good measure of how far away the predictions are from the known labels. This distance is called the cost, and the equation to compute it the cost function.

  4. Now that the machine has something to guess (the Greek parameters) and a way to know how well its doing (the cost function), it just needs a way to minimize the cost, or to put it another way, optimize the parameters. This optimization process is called learning.

Together, these steps constitute a learning algorithm. An algorithm with a set of optimized weights is usually referred to simply as a model.

All the algorithms

Every piece of this story is worth a whole blog post on its own, but for today let’s stay high-level.

The problem is that the algorithm zoo can be overwhelming. My post last week was an attempt to compare a lot of regression algorithms, in terms of how they make sense of three synthetic datasets.

Today I’m sharing a Big Giant Spreadsheet™ that attempts to compare some of the most popular ‘shallow’ learning algorithms in terms of their most important characteristics. For example, can they predict probabilities? Are they deterministic? What are the key hyperparameters? And so on.

Here’s a small version of the table (see the links below for other versions):

There’s a PDF version here — and here’s the original spreadsheet.

Eventually, I’m visualizing a poster for the wall. I think it would be nice to have some equations on here. Maybe the plots from the various comparisons too (see last weeks post!). And even more advice, like which ones break when you have too many features. What else would you like to see on there?

Comparing regressors

There are several really nice comparisons between various algorithms in the Scikit-Learn documentation. The most famous, and useful, one is probably the classifier comparison:

A comparison of classification algorithms. Each row is a different dataset; each column (except the first) is a different classifier, each trying to separate the blue and red points. The accuracy score of each classifier is show in the lower right corner of each plot. There’s so much to look at in this one plot!

There’s also a very nice clustering algorithm comparison, and this anomaly detection comparison. As usual with awesome open source software packages like Scikit-Learn, the really wonderful thing is that all the source code is right there so you can hack these things to show your own data.

What about regression?

Regression problems are the other major kind of machine learning task. If the thing you’re trying to predict is not a category (like ‘blue’ or ‘red’, as above) but a continuous property (like porosity, say), then you’re looking at a regression problem.

I wondered what a comparison plot for the various regressors in Scikit-Learn would look like. I couldn’t find one, so I made one. I made up three one-dimensional datasets — one linear, one polynomial, and one periodic. Then I tried predicting each one with various different model types, from linear regression to a deep neural network. Here’s version 1 (well, 0.1 really) of my script; feel free to adapt and improve it!

Here’s the plot it produces:

A comparison of most of the regressors in scikit-learn, made with this script. The red lines are unregularized models; the blue have regularization. The pale points are the validation data. The small numbers in each plot are RMS error (lower is better!).

I think this plot repays careful study. Notice the smoothing effect of regularization. See how tree-based methods result in discretized predictions, and kernel-based ones are pretty horrible at extrapolation.

I’m 100% open to feedback on ways to improve this plot… or please improve it and show me how it goes!

Take one, make one

There’s a teaching method originating in medicine known as “see one, do one, teach one”. I like it because it underscores hands-on practice and knowledge sharing as essential steps in developing a craft — and it works. Today, I want to urge you to take a challenge, then make one for others.

First, what’s the challenge?

A couple of years ago, inspired by the annual Advent of Code challenges, we introduced the kata, a set of coding challenges especially for geoscientists. For a long time we sent them to students in our Geocomputing class, to encourage them to keep coding. Now we just tell everyone about them.

At the time we announced the kata, there were five puzzles. Today, there are 11: four beginner-friendly challenges, four intermediate ones, and three quite hard ones. Topics range from data munging to map indexing, and from digital elevation models to fractures.

💡 If you want to try one, this Colab is the easiest way to get started: https://ageo.co/kata-live

Now make one!

Once you’ve got an idea of how these things work, you might want to try your hand at making one. Once you have an idea for a short task, you need a way to generate a random dataset. For example, for the sample-names challenge, I have a function that generates a random set of sample names, composed of several parts (a number, a basin, a formation, a data, etc).

When you have a dataset, you can ask some questions about it. Start with an one, and build from there. The last question (there can be 3 or 4), should be a somewhat realistic challenge for this kind of data. Each question needs a hint, and each question must have only one possible answer (this is the tricky bit!).

If you fancy trying your hand at it, check out our new kata-dev repository on GitHub. There is a demo challenge there, which is also live on the kata server, so you can see how it all works. Good luck!


Whether or not you try making a challenge for your peers, so let us know how you get on in the #kata-challenges channel on the Software Underground. We’re always ready to answer questions about them.

Get a telescope!

In the recent How deep are the presents? post, I mentioned that I got a telescope this year — and I encouraged you to get one, because I kind of wish I’d got mine years ago. Since the observing conditions aren’t great tonight and I’m indoors anyway, I thought I’d elaborate a bit.

Not Hubble

The fun might not be obvious to all. Superficially, the experience is terrible — you read about some interesting object, noting its spectacular appearance in the obligatory Hubble photo, only to spend 45 minutes hunting for it before realizing it must be that dim grey smudge you tried to wipe off the eyepiece half an hour ago.

Messier 51: the Whirlpool Galaxy, which is actually a pair of colliding galaxies about 23 million light years away. What you’re expecting (left) vs what you might see on a really dark night with a lot of patience (right).

And yet… you did find it. Out in the dark, on your own, among the owls and foxes, you made an observation. You navigated to it, learning the names of ancient constellations and asterisms. You found out that it’s a pair of colliding galaxies 23 million light years away, and we know that because we can measure the light from individual stars they contain. Its photons were absorbed, after 23 million years oscillating through space, by your retinal cells. And maybe, just possibly, you glimpsed its archetypal spiral arms. And you ticked another Messier object off your list. Thirty minutes well spent! On to the next thing…

There are so many things to see

I knew it would be pretty cool to be able to see Saturn’s rings and the surface of the Moon, but a lot of things have been surprising to me:

  • Jupiter and Saturn are genuinely breathtaking. Seeing the moons of Jupter change continuously, or a shadow pass across its face, is remarkable — it’s the view that changed Galileo’s, then humanity’s, understanding of the universe, proving that Earth is not the centre of every celestial body’s orbit.

  • The moon looks different every day. This is obvious, of course, but with a decent telescope, you can see individual mountains and valleys pass from obscurity into high contrast, and then into blinding sunlight. The only trouble is that once it’s well-lit, the moonlight basically obliterates everything else.

  • Indeed, the whole sky changes continuously. Every month it advances two hours — so in January you can see at 8 pm what you had to wait until 10 pm for in December. So every month’s non-moonlit fortnight is different, with new constellations full of new objects appearing over the eastern horizon.

  • There’s a ready-made list of achievements for beginners to unlock, at least in the Northern Hemisphere. The objects on Charles Messier’s list of 110 “things that aren’t comets” are, because his late-18th-Century telescope was rubbish, fairly easy to observe — even from places that aren’t especially dark.

  • Many of the objects on that list are mind-blowingly cool. The colliding galaxies of M51 were the first thing I pointed my telescope at. M57, the famous Ring Nebula, is tiny but perfect and jewel-like. M42 is legitimately gasp-inducing. M13, the Great Globular Cluster, is extraordinarily bright and beautiful.

If you do start observing the night sky, I strongly recommend keeping a journal. You’ll quickly forget what you saw, and besides it’s fun to look back on all the things you’ve found. My own notes are pretty sketchy, as you can see below, but they have helped me learn the craft and I refer back to them quite often.

Buying a telescope

Telescopes are one of those purchases that can throw you into analysis paralysis, so I thought I’d share what I’ve learned as a noob stargazer.

  • Whatever you’re buying, buy from a telescope shop or online store that serves astronomers. If at all possible, don’t go to Amazon, a sporting goods store, or a department store.

  • If you’re spending under about $200, get the best binoculars you can find instead of a telescope. Look for aperture, not magnification (e.g. for 10 x 50 bins, 10 is the magnification, 50 is the aperture in mm). Just be aware that anything with an aperture greater than about 50 mm will start to get heavy and may need a tripod (and a binocular screw mount) to use effectively. Ideally, try some out in a shop.

  • Like lots of other things (groceries, bikes, empathy), telescopes are hard to find at the moment. So focus on what’s available — unless you are prepared to wait. There are good scopes available now, just maybe not that exact one you were looking for.

  • There are three basic kinds of optical telescope the beginner needs to know about: refractors, reflectors, and catadioptrics (a bit of both). I recommend going for a reflector, because big ones are cheap, and you can see more with a big scope. On the downside, they do get quite large and once you hit a 12-inch mirror, awkward to store, manoeuvre, and transport.

  • I know technology is cool, but if at all possible you should forget about fancy electronics, ‘go-to’ mounts, GPS-this, WiFi-that, and so on — for now. Relatedly, forget about anything to do with photographing the heavens. Unless you’ve been at it for a couple of years already (why are you reading this?), wait.

  • For your first scope, you’re looking for an alt-azimuth or Dobsonian mount, not an equatorial one. They aren’t ideal for taking photographs of anything other than very bright objects, but they are perfect for visual observation.

  • Don’t buy any extra doo-dads, except maybe a collimator (your scope will need aligning now and again), some sort of finder (red-dot finders are popular), and a moon filter (once its past first quarter, it’s too bright to look at). Everything else can wait. (Many scopes include these items though, so do check.)

I think that’s all the advice I’m entitled to offer at this point. But don’t just take it from me, here are some awesome “buying your first telescope” videos:

After much deliberation, I bought a Sky-Watcher Flextube 250P, which is a non-motorized, Dobsonian-mounted, 250-mm (10-inch) aperture Newtonian reflector. It’s been a delight, and I highly recommend it. If you decide to take the plunge, good luck! And do let me know how it goes.

How deep are the presents?

As December rolls around again, thoughts turn to the Advent of Code, I mean Christmas, Jul, Hanukkah, Kwanzaa, Ōmisoka, Newtonmas, Solstice, Dongzhi, or whatever you like to celebrate at this time of year. The end of 2021 is arguably sufficient cause for celebration on its own. Just don’t let your guard down in 2022!

Now, wherever you are, light the fire, chill out in the shade, pour yourself a glass of what you fancy, and check out this list of nerdtastic gifts for your favourite geoscientist, retired geoscientist, or geoscientist-to-be.


Actual rock

When giving to a geologist, you can’t go wrong with actual rock. Henk Kombrink and Kirstie Wright have been preparing and shipping beautiful pieces of North Sea core for several years now. These things cost millions of dollars to bring to the surface! Seriously useful for teaching, but also just lovely to look at.

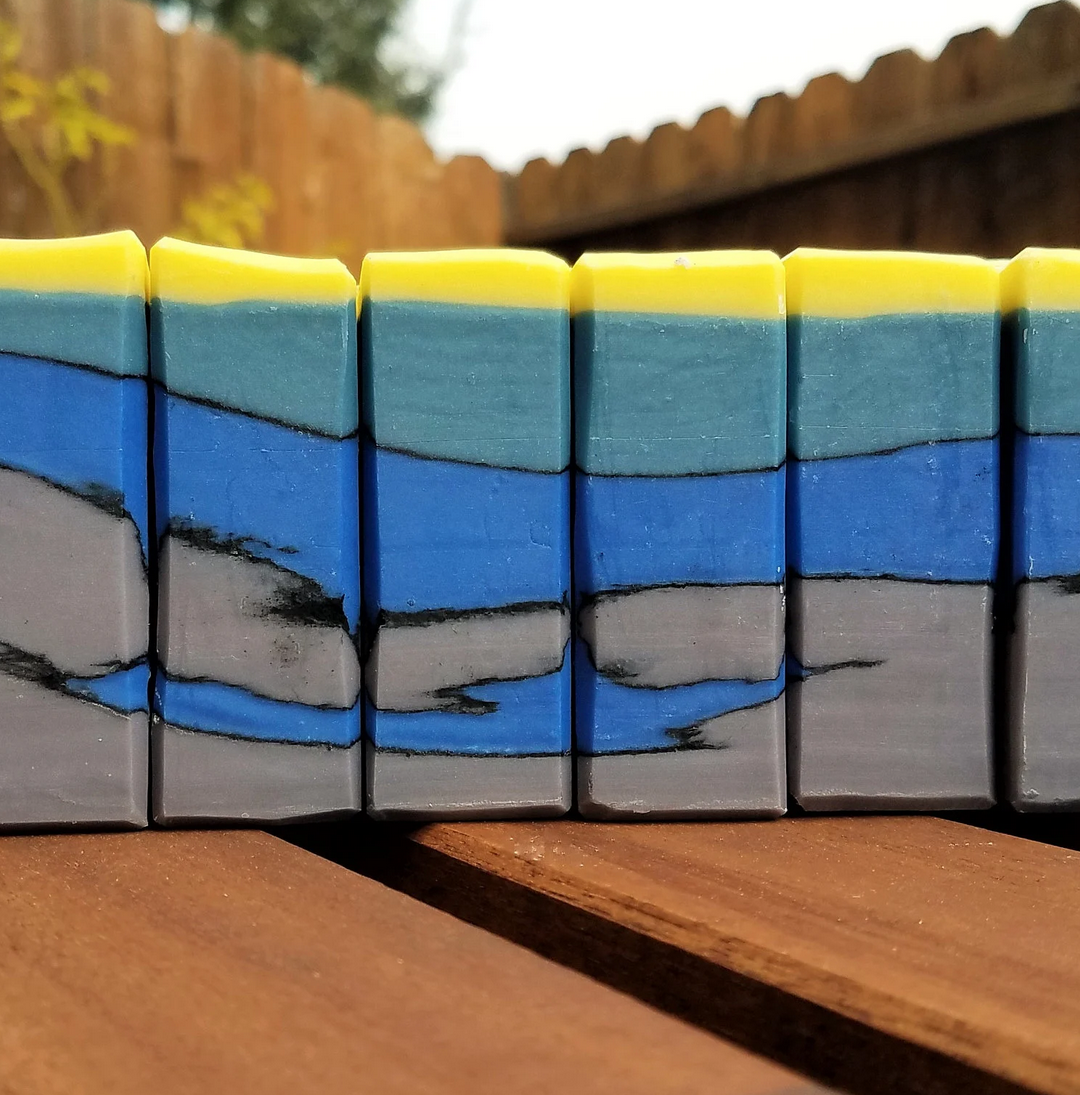
You also can’t go wrong with soap. Geologists are filthy.


Look up not down

Geologists usually look down, but I got myself a telescope this year and I love it. I really appreciate the quiet focus of picking my way around the night sky, and the mind-bending experience of gazing at a galaxy of 100 billion stars whose photons have been traveling through space since the Oligocene. Highly recommended for any scientist! But the question is… out of the 100 billion different telescopes out there, which one do you get?

I think I’ll write a more detailed post about this soon, but for now I’ll keep it brief. If you can afford to spend more than about $250, get a simple reflector (aka ‘Newtonian’) telescope with a 6- to 10-inch (150 mm to 250 mm) mirror on a simple, non-motorized alt-azimuth mount. This combo is often called a ‘Dobsonian’, or Dob for short, and I think it offers the best value, and the best experience, for the beginner. Here’s one (right).

On the other hand, if you’re looking to spend less than about $250, get binoculars instead — something like 8×42 or 10×50 is ideal. Or split the difference with these very nice Nikon Prostaff 5 10×42. The beauty is that when geologists are allowed back in the field again, these bins can double as field glasses.


Why are scientists always pictured with glasses?

I don’t know but I do know that I love these laboratory-inspired drinking vessels from PTWare and these even more authentic-looking (not to mention somewhat cheaper) ones from a restaurant trade site.

You can also go with the novelty look, like this stratigraphic glass — or this one on the right featuring women of science, including the astronomer and (callback!) first female salaried scientist, Caroline Herschel, and none other than (segué!) rock botherer Mary Anning.


The obligatory books section

There is no shortage of books about Mary Anning, but this new picture book for kids stood out. I have not read it, but judging by its reviews, people like it a lot: Mary Anning by Maria Isabel Sánchez Vegara & Popy Matigot. It is one in a new series of factual children’s books from Francis Lincoln books called Little People, Big Dreams — there are lots of scientists in the list along with Anning.

For the grown-ups, there are a lot of interesting-looking new books on my watch list. It seems geology books are hot again!


Last thing

I know it’s very 2021, but don’t you dare buy anyone an NFT. Those things are ridiculous.


Unlike most images on agilescientific.com, the ones in this post are not my property and are not open access. They are the copyright of their respective owners, and I’m using them here in accordance with typical Fair Use terms. If you’re an owner and you don’t like it, please let me know.

Will a merger save SEG, AAPG and SPE?

Earlier this year AAPG and SPE announced that they are considering a merger.

There’s now a dedicated website to help members follow the developments, but it looks like no decisions will be made before next year, following a member vote on the issue.

In a LinkedIn post from SEG President Anna Shaughnessy earlier this week, I learned that SEG is joining the discussion. This move is part of a strategic review, led by President-Elect Ken Tubman. The new Strategic Options task force will have plenty to talk about.

It seems the pandemic, alongside the decline of petroleum, has been hard on the technical societies — just like it has on everyone. Annual meetings, which are usually huge sources of revenue, were cancelled, and I’m sure membership and sponsorship levels overall are down (actual data on this is hard to find). So will this merger help?

In contravention of Betteridge’s law of headlines, and more in line with classical geophysical thinking, I think the answer is, ‘It depends’.

The problem

As I’ve highlighted several times in the past, the societies — and I’m mostly talking about AAPG, SEG, SPE, and EAGE here — have been struggling with relevance for a while. I’m generalizing here, but in my view the societies have been systematically failing to meet the changing needs of their respective communities of practice for at least the last decade. They have not modernized, and in particular not understood that technology and the Internet have changed everything. Evidence: none of them have functioning online communities, none of them stream their conferences to make them more accessible, none of them understand the importance of open scientific publishing, they all have patchy equity & diversity records, and they all have rather equivocal stances on climate change. The main problem, to my mind, is that they tend to have a strongly inward-looking perspective, seeing everything in terms of revenue.

In summary, and to spin it more positively: there’s a massive opportunity here. But it’s not at all clear to me how merging two or more struggling societies creates one that’s ready for tomorrow.

The catch

The pattern is pretty familiar. Corporations in trouble often go for what they think are big, daring ideas (they aren’t big or daring, but let’s leave that for another time). Acquire! Merge! Fire the COO! Shuffle the VPs! What follows is months of uncertainty, HR meetings, legal nonsense, rumour-mongering, marketing focus groups, and a million-dollar rebranding. Oh, and “a stronger organization that can more effectively address the challenges our industry faces today and into the future”. (Right?? Surely we get that too?)

So there’s a pretty clear downside to survival-by-negotiation, and that’s the absolutely Titanic distraction from the real work — specifically from the actual needs and aspirations of your members, employees, partners, supporters, and the community at large.

There’s also the very real possibility that the organization emerging from the process is not actually fit for purpose. Reading the FAQ in the AAPG/SPE press release doesn’t fill me with hope:

Maybe I’m wrong, but I don’t think most members are worrying about how AAPG can grow its customer base.

The alternative

Now, to be clear, I am not a growth-oriented business-person — and I’m not against big organizations per se. But during the pandemic, size did not seem to be an advantage for technical societies. The cancellation of All The Meetings last year just highlighted how fragile these giant meetings are. And how difficult the high stakes made everything — just look at how AAPG struggled to manage the cancellation process long after it was obvious that their annual convention would be impossible to host in person. Meanwhile, Software Underground’s 3000 members immediately pivoted its two planned hackathons into an awesome virtual conference that attracted hundreds of new people to its cause.

Notwithstanding that things might be at a crisis point in these organizations, in which case some emergency measures might be called for, my advice is to press pause on the merger and dig into the fundamentals. The most urgent thing is to resist the temptation to attempt to figure it all out by shutting a select committee of hand-picked leaders in a room in Tulsa because that will definitely result in more of the same. These organizations must, without delay, get into honest, daily conversation with their communities (notice I didn’t say, ‘send out a questionnaire’ — I’m using words like ‘conversation’ on purpose).

If I was a member of these organizations, here’s what I would want to ask them:


What would happen if the organization only worked on things that really matter to the community of practice? All of it, that is — not just your sponsors, or your employees, or your committees, or even your members. What if you connected your community through daily conversation? Emphasized diversity and inclusion? Stood up emphatically for minorities? Brought essential technical content to people that could not reach it or afford it before? Founds new ways for people to participate and contribute — and not just “attend”? What if you finally joined the scientific publishing revolution with an emphasis on reproducible research? Started participating in the global effort to mitigate the effects of climate change? Shone a light on CCS, geothermal, mining, and the multitude of other applications of subsurface science and engineering?

It might sound easier to fiddle with corporate documents, rebrand the website, or negotiate new trade-show deals — and maybe it is, if you’re a corporate lawyer, web developer, or events planner. But your community consists of scientists that want you to support and amplify them as they lead subsurface science and engineering into the future. That’s your purpose.

If you’re not up for that now, when will you be up for it?