2016 retrospective

As we see out the year — or rather shove it out, slamming the door firmly behind it, then changing the locks and filing a restraining order — we like to glance back over the blog. We remember the posts that we enjoyed writing, and the ones you seemed to enjoy reading, and record them here for posterity.

The most popular

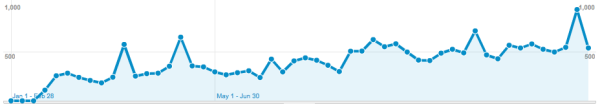
The great thing about writing on the web, compared to print, is that you quickly find out whether it was any good, or useful, or at least slightly interesting. You can't hide from data. Without adjusting for the age of posts (older ones have had longer to garner readers of course), the most popular posts of the last 12 months — from the 47 we have published — were:

None of these posts comes anywhere near the most popular page on the site, k is for wavenumber, which I wrote in 2012 but still gets about 600 pageviews a month, nearly 4% of the traffic on the site. Other perennials include Well tie workflow, What is anisotropy? and What is SEG Y?

If you gauge popularity by real engagement — comments, which are like diamonds to bloggers — then, apart from the pieces I already mentioned, these were the next most commenty posts:

Where is everybody?

We don't collect data about our readers beyond what's reported by your browser to Google Analytics, most of which is pretty esoteric. But it is interesting to see the geographic distribution of our readers. The top dozen cities from the roughly two thirds of sessions — out of about 9000 monthly sessions — that report this information:

  1. Houston (3,457 users)
  2. Calgary (2,244)
  3. London (1,500)
  4. Perth (723)
  5. Kuala Lumpur (700)
  6. Stavanger
  7. Delhi
  8. Rio de Janeiro
  9. Leeds
  10. Aberdeen
  11. Jakarta
  12. New York

Last thing

You rock! I mean it. This blog would be pretty pointless without your eyeballs. We appreciate every visit, however short, and when you share a post with someone... it really makes our day. I love hearing from readers, even about typos. Especially aobut typos. Anyway, the point is: thank you for stopping by, and being part of this global community of geoscientists.

Whatever festival you celebrate this week, have a peaceful time*. And all the best for 2017!

* Well, maybe squeeze in a bit of writing: it's good for you. 


Previous Retrospective posts... 2011 retrospective •  2012 retrospective • 2013 retrospective • 2014 retrospective

There was no Retrospective in 2015, I was too discombobulated this time last year :(

The 5%

We recently published our 500th post on this blog. I made the first post on 11 November 2010, a week after quitting my job in Calgary (yes, there was a time when people used to quit jobs). So, 500 posts in a little over 2000 days — about a post every 4 days. About 300,000 words (still only about half of War and Peace). And I probably shouldn't think about this, but let's call it at least 1000 hours (it's probably double that). 

To celebrate the milestone, however arbitrary, I thought I'd spend an evening rounding up some of our favourite and most popular posts. If nothing else, it might serve as place to start for any new readers.

Geoscience

Uncertainty (broadly speaking)

Tech and coding

Our culture

I did say this post was about the top 5%, so strictly I owe you one more post. If you'll indugle me, I'll hark right back to the start — this post on The integration gap from 5 January 2011 was one of my early favourites. It was one of those ideas I'd been carrying around for a while. Not profound or interesting enough for a talk or an article. Just a little idea. I doubt it's even original. I just thought it was interesting. It's exactly what blogs were made for.

It only remains to say Thank You for the support and attention over the years. We appreciate it hugely, and look forward to crafting the next 500 posts for lining the bottom of your digital cat litter box.

What does Agile actually do?

For the forgetful and/or the nostalgic, here's a reminder of what the old site looked like. If there's a particular feature you miss, please let us know!

For the forgetful and/or the nostalgic, here's a reminder of what the old site looked like. If there's a particular feature you miss, please let us know!

There's one question almost everybody asks us: "What do you guys actually do?". The more brazen get straight to the point: "How do you guys make money?". One way to answer this question, without making people wait till they meet us, is with the website. And our website has always been quite... bloggy. It's easy to see how we don't make money, less obvious how we do.

New website

After 4 years with the same design, we've given the site a new look. Four years is half a lifetime in web years, so we now have lots of upgraded features, like mobile responsiveness, integrated commerce, and lots of dynamic content. We can also make it a bit easier to see what people hire us for, and to hire us yourself. 

Here's a quick overview of some of the new content:

  • Services — things we do for money.
  • Courses — boost your skills as a scientist and communicator.
  • Products — things we make... for money, or for fun, or because they have to be done.
  • Shop — where you can buy boxes of books, and maybe more one day. 
  • Projects — some of the bigger things we're into right now, like Modelr and SubSurfWiki.

I still find it hard to describe what we do, and I kind of like it that way. We're not easy to pigeonhole. We're fortunate not only to have always had enough work, but also to work with some of the smartest and most energetic people in our industry. But I hope our new site goes some way to making it easier to find out how we might be able to help you and your organization be a bit more awesome. That's what we're here for. 


Some geeky footnotes

For anyone who's interested, the site is powered by Squarespace 7. We were previously on Squarespace 5. There's a lot of upside to a package deal like Squarespace, but of course you lose some flexibility. I might have thought about moving to another platform, perhaps WordPress and its open source goodness, but in the end the ease of transferring our 400+ blog posts was the deciding factor. 

For those of you using a news reader like The Old Reader to read our blog, please note that the old 'journal' feed URL no longer works — please update it to http://www.agilegeoscience.com/blog?format=RSS. The Feedburner feed is still active, at least for now.

2014 retrospective

At this time of year, we look back at the best of the blog — what were the most read, the most contentious, the most informative posts of the year? If you only stop by once every 12 months, this is the post for you!

Your favourites

Let's turn to the data first. Which posts got the most hits this year? Older posts have a time advantage of course, but here are the most popular new posts, starting with the SEG-Y double-bill:

It's hard to say exactly how much attention a given post gets, because they sit on the front page of the site for a couple of weeks. Overall we got about 150 000 pageviews this year, and I think Well tie workflow — the most-read old post on the site this year — might have been read (okay, looked at) 5000 or so times.

I do love how some of our posts keep on giving: none of the top posts this year topped this year's readership of some golden oldies: Well tie workflow (written in April 2013), Six books about seismic interpretation (March 2013), k is for wavenumber (May 2012), Interpreting spectral gamma-ray logs (February 2013), or Polarity cartoons (April 2012).

What got people talking

When it all goes quiet on the comments, I worry that we're not provocative enough. But some posts provoke a good deal of chat, and always bring more clarity and depth to the issue. Don't miss the comments in Lusi's 8th birthday...

Our favourites

We have our favourites too. Perhaps because a lot of work went into them (like Evan's posts about programming), or because they felt like important things to say (as in the 'two sides' post), or because they feel like part of a bigger idea.

Where is everybody?

We don't collect detailed demographic data, but it's fun to see how people are reading, and roughly where they are. One surprise: the number of mobile readers did not rise this year — it's still about 15%. The top 10 cities were

Agile_top_60plus_cities_2014.png
  1. Houston, USA
  2. Calgary, Canada
  3. London, UK
  4. Perth, Australia
  5. Ludwigshafen, Germany
  6. Denver, USA
  7. Aberdeen, UK
  8. Moscow, Russia
  9. Stavanger, Norway
  10. Kuala Lumpur, Malaysia

Last thing

Thank You for reading! Seriously: we want to be a useful and interesting part of our community, so every glance at our posts, every comment, and every share, help us figure out how to be more useful and more interesting. We aim to get better still next year, with more tips and tricks, more code, more rants, and more conference reports — we look forward to sharing everything Agile with you in 2015.

If this week is Christmas for you, then enjoy the season. All the best for the new year!

Previous Retrospective posts... 2011 retrospective •  2012 retrospective2013 retrospective

Have some bacn

You might have noticed a lot of emails from Canadian companies recently, asking you to confirm that you wish to receive emails from them. This is because a key part of the 2010 anti-spam law comes into effect tomorrow. We haven't sent you anything, becase we have always complied with the spirit of the law.

What is spam?

We all know what spam is, and the Canadian government's definition is plain:

commercial electronic messages [received] without the recipient's consent

And here's a definition of bacn (pronounced 'bacon') from author Jonathon Keats:

Spam by personal request

This seems to contradict the first definition, but the idea is that bacn is better than spam, but still not as good as a personal email. It's commercial email that you asked for. (Aside: according to that same author, bacn from geologists is quakn.)

Email from Agile*

Because we want you to have as much control over your inbox as possible, I have just switched our email subscription service from Feedburner to MailChimp. One of the reasons is MailChimp's excellent and rigorous anti-spam policy enforcement. Their emails make it very clear who an email is from, and how to unsubscribe from them. 

If you receive our blog updates via email, I hope you see them as a service and not a nuisance. If you're unsure about subscribing because you fear receiving promotions and so on — I promise that all you will ever get is our blog posts. It's just a convenient way to read the blog for some people. 

Just to be clear:

  • We will never add you to a mailing list that you didn't expressly subscribe to.
  • We will always give you an easy way to unsubcribe.
  • We will never share your email address or name with anyone else.
  • We will only send you emails that have an obvious Unsubscribe option.

Other ways to read

Here are some other options for subscribing to our RSS feed, which you will find at /journal/rss.xml 

We want you to be able to easily find, read, interact with, and share our content. If there is some other way we can serve you, please let us know

The can of spam image is by Flickr's Clyde Robinson and licensed CC-BY.

2013 retrospective

It's almost the end of the year, so we ask for your indulgence as we take our traditional look back at some of the better bits of the blog from 2013. If you have favourite subjects, we always like feedback!

Most visits

Amazingly, nothing we can write seems to be able to topple Shale vs tight, which is one of the firsts posts I wrote on this blog. Most of that traffic is coming from Google search, of course. I'd like to tell you how many visits the posts get, but web stats are fairly random — this year we'll have had either 60,000 or 245,000 visits, depending on who you believe — very precise data! Anyway, here are the rest...

Most comments

We got our 1000th blog comment at the end of September (thanks Matteo!). Admittedly some of them were us, but hey, we like arbitrary milestones as much as the next person. Here are the most commented-on posts of the year:

Hackathon skull

Hackathon skull

Proud moments

Some posts don't necessarily win a lot of readers or get many comments, but they mark events that were important to us. A sort of public record. Our big events in 2013 were...

Our favourites

Of course we have our personal favourite posts too — pieces that were especially fun to put together, or that took an unusual amount of craft and perspiration to finish (or more likely a sound beating with a blunt instrument).

Evan

Matt

I won't go into reader demographics as they've not changed much since last year. One thing is interesting, though not very surprising — about 15% of visitors are now reading on mobile devices, compared to 10% in 2012 and 7% in 2011. The technology shift is amazing: in 2011 we had exactly 94 visits from readers on tablets — now we get about 20 tablet visits every day, mostly from iPads.

It only remains for me to say Thank You to our wonderful community of readers. We appreciate every one of you, and love getting email and comments more than is probably healthy. The last 3 years have been huge fun, and we can't wait for 2014. If you celebrate Christmas may it be merry — and we wish you all the best for the new year.

2012 retrospective

The end of the year is nigh — time for our self-indulgent look-back at 2012. The most popular posts, not counting appearances on the main page. Remarkably, Shale vs tight has about twice the number of hits of the second place post. 

  1. Shale vs tight, 1984 visits

  2. G is for Gather, 1090 visits (to permalink)

  3. What do you mean by average?, 1008 visits (to permalink)

The most commented-on posts are not necessarily the most-read. This is partly because posts get read for months after they're written, but comments tend to come right away. 

  1. Are conferences failing you too? (16 comments)

  2. Your best work(space) (13 comments)

  3. The Agile toolbox (13 comments)

Personal favourites

Evan

Matt

Where our readers come from

The distribution of readers is global, but has a power law distribution. About 75% of our readers this year were from one of nine countries: USA, Canada, UK, Australia, Norway, India, Germany, Indonesia, and Russia. Some of those are big countries, so we should correct for population—let's look at the number of Agile blog readers per million citizens:

2012_blog_readers_logscale.png
  1. Norway — 292

  2. Canada — 283

  3. Australia — 108

  4. UK — 78

  5. Qatar — 72

  6. Brunei — 67

  7. Ireland — 57

  8. Iceland — 56

  9. Denmark — 46

  10. Netherlands — 46

So we're kind of a big deal in Norway. Hei hei Norge! Kansje vi skulle skrive på norsk herifra.

Google Analytics tells us when people visit too. The busiest days are Tuesday, Wednesday, and Thursday, then Monday and Friday. Weekends are just crickets. Not surprisingly, the average reading time rises monotonically from Monday to Friday — reaching a massive 2:48 on Fridays. (Don't worry, dear manager, those are minutes!)

What we actually do

We don't write much about our work on this blog. In brief, here's what we've been up to:

  • Volume interpretation and rock physics for a geothermal field in southern California

  • Helping the Government of Canada get some of its subsurface data together

  • Curating subsurface content in a global oil & gas company's corporate wiki

  • Getting knowledge sharing off the ground at a Canadian oil & gas company

Oh yeah, we did launch this awesome little book too. That was a proud moment. 

We're looking forward to a fun-filled, idea-jammed, bee-busy 2013 — and wish the same for you. Thank you for your support and encouragement this year. Have a fantastic Yuletide.

Two hundred posts

The petrophysics cheasheet was one of our most popular posts

My post on Tuesday was the two hundredth post on our blog, which we started 19 months ago in November 2010. Though we began with about 15 posts per month, we have settled down to a rate of 7 or 8 posts per month, which feels sustainable. At this rate, it will be at least a year before we hit 300.

We hit 100 posts on 21 June last year, after only 222 days. In the 358 days since then we've had about 41 700 visits from 24 500 people in 152 countries. The most popular content is a little hard to gauge because of the way we run every post over the home page for a couple of weeks, but from the most recent 100 posts, the favourites are (in descending pageview order):

Someone asked recently how long our posts take to write. It varies quite a bit, especially if there are drawings or other graphics, but I think the average is about 4 hours, perhaps a little more. Posts follow an idea–draft–hack–review–publish process, and this might be months long: we currently have 52 draft posts in the pipeline! Some may never make it out...

We'd love to have some other voices on the site, so if you feel strongly about something in this field, or would like the right to reply to one of our opinion pieces, please get in touch. Or start a blog!

How to keep up with Agile*

I mentioned the other day that there are a few ways to keep up with this blog. I thought I'd list some of them out, in case you have not yet found one you like. 

The easiest thing for many is probably to get the email updates. They go out early in the morning the day after we put up a new post. We do not use your email address for anything else and would certainly never share it. To get these, just enter your email address in the box to the right →

If you already get them, don't worry, nothing has changed.

For many diehard blog readers, the only way is the RSS feed. You can access this from the link in the box on the right too. Just copy the URL of the feed [http://feeds.feedburner.com/agilegeoscience] into an RSS reader, sometimes called an aggregator. There are dozens — here's a list. Lots of people like Google Reader. Some people don't.

Visit our Twitter account to see what it's all about — no account requiredEvery new post is tweeted by the Twitter account @agilegeo. This is more or less all this Twitter account does, at least for now, so it's high signal-to-noise (if you consider our posts and comments signal, that is). These tweets also post to our Facebook page, so you can Like us to see the new posts in your Facebook feed.

We've started playing with Google+, but it's quite different from Facebook and Twitter, so is taking some getting used to. If you use Google+, follow Agile, me or Evan to get a smattering there. And Evan and I usually post about new writing in our LinkedIn profiles too, if you know us personally.

Lastly, there's always the trusty bookmark. Just remember to hit it occasionally. 

Thank you for reading! Seriously. Thank you.

The blog post

People sometimes eye Evan and I with suspicion when they ask about what we do. Even after a whole year of Agile, I admit I am sometimes at a loss for a snappy answer. In a nutshell, I'd say:

We solve geoscience problems for geoscientists. We like fast and useful solutions, not perfect or expensive solutions—we don't believe in perfect or expensive solutions. We love the things you might not have time for: data, technology, and documentation.

Above all, we love to help people. And that's what the blog is for: we want to be useful, mostly relevant, perhaps interesting, occasionally insightful. And we live on the edge of the continent and don't want to fall off, small and forgotten, into the North Atlantic. For us, the blog is a portal to Houston, Calgary, Aberdeen, Perth, and the rest of our world.

Is it worth it? Well, that depends how you measure 'worth it'. I reckon we spend 8 to 16 hours on an average of 3 weekly posts to the blog, so it's a substantial investment for us. A lot of it ends up in the wiki, or in a paper, or elsewhere; it's definitely a good catalyst for thinking, making useful stuff, and starting conversations. I don't think the blog has generated business purely on its own yet, but it has helped keep our profile up, and made us easier to find. 

Who reads it? We don't know for sure, but we have some clues. Our website has been visited almost exactly 30 000 times this year. We currently get about 800 visits a week, from about 550 unique visitors (shown in the chart above). Of those, about 30% are in the US, 20% are in Canada, 9% in the UK, then it's Australia, Germany, India, and Norway. The list contains 136 countries. This last fact alone fills us with joy, even if it's wrong by a factor of two.

How do the readers find us? About 140 people subscribe to our feed by email, which means they get an email alert the morning after we publish a post. Each week, only about 20 people come to us via Google, with search terms like seismic rock physics, agile geophysics, and tight gas vs shale gas. Since we announce new posts on LinkedIn, Twitter, and Facebook (and now Google+ too), we get visitors from those sources too: they send about 24%, 18%, and 6% of our traffic respectively (G+ has too little data). The average visitor looks at 2.2 pages and stays for 3 mins and 2 seconds. But hey, 3 minutes is a long time on the Internet. Right?

If you were looking for some juicy geoscience, not this navel gazing, then check out our recent Greatest Hits, and have an amazing New Year! See you in 2012.

Blog traffic data are summarized from Google Analytics and are for interest only—the data are prone to all sorts of errors and artifacts. What's more, I do not have data for the first 6 weeks or so of traffic. Pinches of salt all round.