2018 retrospective

It’s almost the end of another trip around the sun. I hope it’s been kind to you. I mean, I know it’s sometimes hard to see the kindness for all the nonsense and nefariousness in <ahem> certain parts of the world, but I hope 2018 at least didn’t poke its finger in your eye, or set fire to any of your belongings. If it did — may 2019 bring you some eye drops and a fire extinguisher.

Anyway, at this time of year, I like to take a quick look over my shoulder at the past 12 months. Since I’m the over-sharing type, I like to write down what I see and put it on the Internet. I apologize, and/or you’re welcome.

Top of the posts

We’ve been busier than ever this year, and the blog has taken a bit of a hit. In spite of the reduced activity (only 45 posts, compared to 53 last year), traffic continues to grow and currently averages 9000 unique visitors per month. These were the most visited posts in 2018:

Last December’s post, No more rainbows, got more traffic this year than any of these posts. And, yet again, k is for wavenumber got more than any. What is it with that post??

Where in the world?

Every year I take a look at where our people are reading the blog from (according to Google). We’ve travelled more than usual this year too, so I’ve added our various destinations to the map… it makes me realize we’re still missing most of you.

blog-map-2018.png
  1. Houston (number 1 last year)

  2. London (up from 3)

  3. Calgary (down from 2)

  4. Stavanger (6)

  5. Paris (9)

  6. New York (—)

  7. Perth (4)

  8. Bangalore (—)

  9. Jakarta (—)

  10. Kuala Lumpur (8)

Together these cities capture at least 15% of our readship. New York might be an anomaly related to the location of cloud infrastructure there. (Boardman, Oregon, shows up for the same reason.) But who knows what any of these numbers mean…

Work

People often ask us how we earn a living, and sometime I wonder myself. But not this year: there was a clear role for us to play in 2018 — training the next wave of digital scientists and engineers in subsurface.

Rob.jpeg
  • We continued the machine learning project on GPR interpretation that we started last year.

  • We revived Pick This and have it running on a private corporate cloud at a major oil company, as well as on the Internet.

  • We have spent 63 days in the classroom this year, and taught 325 geoscientists the fundamentals of Python and machine learning.

  • Apart from the 6 events of our own that we organized, we were involved in 3 other public hackathons and 2 in-house hackathons.

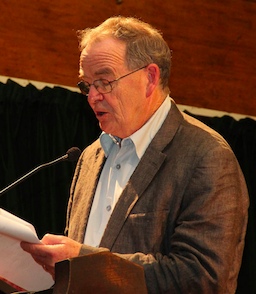
  • We hired awesome digital geologist Robert Leckenby (right) full time. 

The large number of people we’re training at the moment is especially exciting, because of what it means for the community. We spent 18 days in the classroom and trained 139 scientists in the previous four years combined — so it’s clear that digital geoscience is important to people today. I cannot wait to see what these new coders do in 2019 and beyond!

The hackathon trend is similar: we hosted 310 scientists and engineers this year, compared to 183 in the four years from 2013 to 2017. Numbers are only numbers of course, but the reality is that we’re seeing more mature projects, and more capable coders, at every event. I know it’s corny to say so, but I feel so lucky to be a scientist today, there is just so much to do.

Cheers to you

Agile is, as they say, only wee. And we all live in far-flung places. But the Intertubes are a marvellous thing, and every week we meet new people and have new conversations via this blog, and on Twitter, and the Software Underground. We love our community, and are grateful to be part of it. So thank you for seeking us out, cheering us on, hiring us, and just generally being a good sport about things.

From all of us at Agile, have a fantastic festive season — and may the new year bring you peace and happiness.

2017 retrospective

Another year pulls on its winter boots and prepares to hurry through the frigid night to wherever old years go to die. From a purely Agile point of view, putting aside all the odious nonsense going on in the world for a moment, it was a good year here at Agile, and I hope it was for you too. If not — if you were unduly affected by any of the manifold calamities in 2017 — then we wish you the best and hope life bounces back with renewed vigour in 2018.


>>>
A reproducible festive card for you, made from a well-
log and a bunch of random numbers. Make your own. 


agile_star_2016_sq_256px.png

It's that time when I like to self-indulgently glance back over the last twelve months — both on the blog and elsewhere in the Agile universe. Let's start with the blog...

The most popular posts

We should top 52 posts this year (there's just something about the number 52). Some of them do little more than transmit news, events and such, but we try to bring you entertainment and education too. Just no sport or weather. These were our most visited posts in this year:

As usual though, the most popular page on the site is k is for wavenumber, the 2012 post that keeps on giving. The other perennials are Well tie workflowWhat is anisotropy? and What is SEG Y? 

Engagement

We love getting comments! Most people tend to chime in via Twitter or LinkedIn, but we get quite a few on the blog. Indeed, the posts listed above got more than 60 comments between them. The following were the next most commented upon:

Agile_demographic_2017.png

Where is everybody?

  1. Houston (about 6.6% of you)
  2. Calgary (4.8%)
  3. London (3.3%)
  4. Perth (1.8%)
  5. Moscow (1.3%)
  6. Stavanger (1.2%)
  7. Rio de Janiero (1.1%)
  8. Kuala Lumpur (1.0%)
  9. Paris (1.0%)
  10. Aberdeen (0.9%)

Work

We're fortunate to have had a good year at Agile. I won't beat our drum too hard, but here's a bit of what we've been up to:

  • We're doing a machine learning project on GPR interpretation.
  • We finished a machine learning lithology prediction project for Canstrat.
  • Matt did more seep and DHI mapping on Canada's Atlantic margin.
  • It was a good year for hackathons, with over 100 people taking part in 2017.
  • Agile Libre brought out a new book, 52 More Things... Palaeontology.
  • We hired awesome data scientist Diego Castañeda (right) full time. 

Thank you

Last but far from least — thank you. We appreciate your attention, one of the most precious resources you have. We love writing useful-and/or-interesting stuff, and are lucky to have friends and colleagues who read it and push us to do more, and a bit better than before. It would be a chore if it wasn't for your readership.

All the best for this Yuletide season, and for a peaceful New Year. Cheers!

Two new short courses in Calgary

We're running two one-day courses in Calgary for the CSPG Spring Education Week. One of them is a bit... weird, so I thought I'd try to explain what we're up to.

Both classes run from 8:30 till 4:00, and both of them cost just CAD 425 for CSPG members. 

Get introduced to Python

The first course is Practical programming for geoscientists. Essentially a short version of our 2 to 3 day Creative geocomputing course, we'll take a whirlwind tour through the Python programming language, then spend the afternoon looking at some basic practical projects. It might seem trivial, but leaving with a machine fully loaded with all the tools you'll need, plus long list of resources and learning aids, is worth the price of admission alone.

If you've always wanted to get started with the world's easiest-to-learn programming language, this is the course you've been waiting for!

Hashtag geoscience

This is the weird one. Hashtag geoscience: communicating geoscience in the 21st century. Join me, Evan, Graham Ganssle (my co-host on Undersampled Radio) — and some special guests — for a one-day sci comm special. Writing papers and giving talks is all so 20th century, so let's explore social media, blogging, podcasting, open access, open peer review, and all the other exciting things that are happening in scientific communication today. These tools will not only help you in your job, you'll find new friends, new ideas, and you might even find new work.

I hope a lot of people come to this event. For one, it supports the CSPG (we're not getting paid, we're on expenses only). Secondly, it'll be way more fun with a crowd. Our goal is for everyone to leave burning to write a blog, record a podcast, or at least create a Twitter account. 


One of our special guests will be young-and-famous geoscience vlogger Dr Chris. Coincidentally, we just interviewed him on Undersampled Radio. Here's the uncut video version; audio will be on iTunes and Google Play in a couple of days:

2016 retrospective

As we see out the year — or rather shove it out, slamming the door firmly behind it, then changing the locks and filing a restraining order — we like to glance back over the blog. We remember the posts that we enjoyed writing, and the ones you seemed to enjoy reading, and record them here for posterity.

The most popular

The great thing about writing on the web, compared to print, is that you quickly find out whether it was any good, or useful, or at least slightly interesting. You can't hide from data. Without adjusting for the age of posts (older ones have had longer to garner readers of course), the most popular posts of the last 12 months — from the 47 we have published — were:

None of these posts comes anywhere near the most popular page on the site, k is for wavenumber, which I wrote in 2012 but still gets about 600 pageviews a month, nearly 4% of the traffic on the site. Other perennials include Well tie workflow, What is anisotropy? and What is SEG Y?

If you gauge popularity by real engagement — comments, which are like diamonds to bloggers — then, apart from the pieces I already mentioned, these were the next most commenty posts:

Where is everybody?

We don't collect data about our readers beyond what's reported by your browser to Google Analytics, most of which is pretty esoteric. But it is interesting to see the geographic distribution of our readers. The top dozen cities from the roughly two thirds of sessions — out of about 9000 monthly sessions — that report this information:

  1. Houston (3,457 users)
  2. Calgary (2,244)
  3. London (1,500)
  4. Perth (723)
  5. Kuala Lumpur (700)
  6. Stavanger
  7. Delhi
  8. Rio de Janeiro
  9. Leeds
  10. Aberdeen
  11. Jakarta
  12. New York

Last thing

You rock! I mean it. This blog would be pretty pointless without your eyeballs. We appreciate every visit, however short, and when you share a post with someone... it really makes our day. I love hearing from readers, even about typos. Especially aobut typos. Anyway, the point is: thank you for stopping by, and being part of this global community of geoscientists.

Whatever festival you celebrate this week, have a peaceful time*. And all the best for 2017!

* Well, maybe squeeze in a bit of writing: it's good for you. 


Previous Retrospective posts... 2011 retrospective •  2012 retrospective • 2013 retrospective • 2014 retrospective

There was no Retrospective in 2015, I was too discombobulated this time last year :(

The 5%

We recently published our 500th post on this blog. I made the first post on 11 November 2010, a week after quitting my job in Calgary (yes, there was a time when people used to quit jobs). So, 500 posts in a little over 2000 days — about a post every 4 days. About 300,000 words (still only about half of War and Peace). And I probably shouldn't think about this, but let's call it at least 1000 hours (it's probably double that). 

To celebrate the milestone, however arbitrary, I thought I'd spend an evening rounding up some of our favourite and most popular posts. If nothing else, it might serve as place to start for any new readers.

Geoscience

Uncertainty (broadly speaking)

Tech and coding

Our culture

I did say this post was about the top 5%, so strictly I owe you one more post. If you'll indugle me, I'll hark right back to the start — this post on The integration gap from 5 January 2011 was one of my early favourites. It was one of those ideas I'd been carrying around for a while. Not profound or interesting enough for a talk or an article. Just a little idea. I doubt it's even original. I just thought it was interesting. It's exactly what blogs were made for.

It only remains to say Thank You for the support and attention over the years. We appreciate it hugely, and look forward to crafting the next 500 posts for lining the bottom of your digital cat litter box.

2014 retrospective

At this time of year, we look back at the best of the blog — what were the most read, the most contentious, the most informative posts of the year? If you only stop by once every 12 months, this is the post for you!

Your favourites

Let's turn to the data first. Which posts got the most hits this year? Older posts have a time advantage of course, but here are the most popular new posts, starting with the SEG-Y double-bill:

It's hard to say exactly how much attention a given post gets, because they sit on the front page of the site for a couple of weeks. Overall we got about 150 000 pageviews this year, and I think Well tie workflow — the most-read old post on the site this year — might have been read (okay, looked at) 5000 or so times.

I do love how some of our posts keep on giving: none of the top posts this year topped this year's readership of some golden oldies: Well tie workflow (written in April 2013), Six books about seismic interpretation (March 2013), k is for wavenumber (May 2012), Interpreting spectral gamma-ray logs (February 2013), or Polarity cartoons (April 2012).

What got people talking

When it all goes quiet on the comments, I worry that we're not provocative enough. But some posts provoke a good deal of chat, and always bring more clarity and depth to the issue. Don't miss the comments in Lusi's 8th birthday...

Our favourites

We have our favourites too. Perhaps because a lot of work went into them (like Evan's posts about programming), or because they felt like important things to say (as in the 'two sides' post), or because they feel like part of a bigger idea.

Where is everybody?

We don't collect detailed demographic data, but it's fun to see how people are reading, and roughly where they are. One surprise: the number of mobile readers did not rise this year — it's still about 15%. The top 10 cities were

Agile_top_60plus_cities_2014.png
  1. Houston, USA
  2. Calgary, Canada
  3. London, UK
  4. Perth, Australia
  5. Ludwigshafen, Germany
  6. Denver, USA
  7. Aberdeen, UK
  8. Moscow, Russia
  9. Stavanger, Norway
  10. Kuala Lumpur, Malaysia

Last thing

Thank You for reading! Seriously: we want to be a useful and interesting part of our community, so every glance at our posts, every comment, and every share, help us figure out how to be more useful and more interesting. We aim to get better still next year, with more tips and tricks, more code, more rants, and more conference reports — we look forward to sharing everything Agile with you in 2015.

If this week is Christmas for you, then enjoy the season. All the best for the new year!

Previous Retrospective posts... 2011 retrospective •  2012 retrospective2013 retrospective

Have some bacn

You might have noticed a lot of emails from Canadian companies recently, asking you to confirm that you wish to receive emails from them. This is because a key part of the 2010 anti-spam law comes into effect tomorrow. We haven't sent you anything, becase we have always complied with the spirit of the law.

What is spam?

We all know what spam is, and the Canadian government's definition is plain:

commercial electronic messages [received] without the recipient's consent

And here's a definition of bacn (pronounced 'bacon') from author Jonathon Keats:

Spam by personal request

This seems to contradict the first definition, but the idea is that bacn is better than spam, but still not as good as a personal email. It's commercial email that you asked for. (Aside: according to that same author, bacn from geologists is quakn.)

Email from Agile*

Because we want you to have as much control over your inbox as possible, I have just switched our email subscription service from Feedburner to MailChimp. One of the reasons is MailChimp's excellent and rigorous anti-spam policy enforcement. Their emails make it very clear who an email is from, and how to unsubscribe from them. 

If you receive our blog updates via email, I hope you see them as a service and not a nuisance. If you're unsure about subscribing because you fear receiving promotions and so on — I promise that all you will ever get is our blog posts. It's just a convenient way to read the blog for some people. 

Just to be clear:

  • We will never add you to a mailing list that you didn't expressly subscribe to.
  • We will always give you an easy way to unsubcribe.
  • We will never share your email address or name with anyone else.
  • We will only send you emails that have an obvious Unsubscribe option.

Other ways to read

Here are some other options for subscribing to our RSS feed, which you will find at /journal/rss.xml 

We want you to be able to easily find, read, interact with, and share our content. If there is some other way we can serve you, please let us know

The can of spam image is by Flickr's Clyde Robinson and licensed CC-BY.

Must-read geophysics blogs

Tuesday's must-read list was all about traditional publishing channels. Today, it's all about new media.

If you're anything like me before Agile, you don't read a lot of blogs. At least, not ones about geophysics. But they do exist! Get these in your browser favourites, or use a reader like Google Reader (anywhere) or Flipboard (on iPad).

Seismos

Chris Liner, a geophysics professor at the University of Arkansas, recently moved from the University of Houston. He's been writing Seismos, a parallel universe to his occasional Leading Edge column, since 2008.

MyCarta

Matteo Niccoli (@My_Carta on Twitter) is an exploration geoscientist in Stavanger, Norway, and he recently moved from Calgary, Canada. He's had MyCarta: Geophysics, visualization, image processing and planetary science, since 2011. This blog is a must-read for MATLAB hackers and image processing nuts. Matteo was one of our 52 Things authors.

GeoMika

Mika McKinnon (@mikamckinnon), a geophysicist in British Columbia, Canada, has been writing GeoMika: Fluid dynamics, diasters, geophysics, and fieldwork since 2008. She's also into education outreach and the maker-hacker scene.

The Way of the Geophysicist

Jesper Dramsch (@JesperDramsch), a geophysicist in Hamburg, Germany has written the wonderfully personal and philosophical The Way of The Geophysicist since 2011. His tales of internships at Fugro and Schlumberger provide great insights for students.

VatulBlog

Maitri Erwin (@maitri), an exploration geoscientist in Texas, USA. She has been blogging since 2001 (surely some kind of record), and both she and her unique VatulBlog: From Kuwait to Katrina and beyond defy categorization. Maitri was also one of our 52 Things authors. 

There are other blogs on topics around seismology and exploration geophysics — shout outs go to Hypocentre in the UK, the Laboratoire d'imagerie et acquisition des mesures géophysiques in Quebec, occasional seismicky posts from sedimentologists like @zzsylvester, and the panoply of bloggery at the AGU. Stick those in your reader!

2012 retrospective

The end of the year is nigh — time for our self-indulgent look-back at 2012. The most popular posts, not counting appearances on the main page. Remarkably, Shale vs tight has about twice the number of hits of the second place post. 

  1. Shale vs tight, 1984 visits

  2. G is for Gather, 1090 visits (to permalink)

  3. What do you mean by average?, 1008 visits (to permalink)

The most commented-on posts are not necessarily the most-read. This is partly because posts get read for months after they're written, but comments tend to come right away. 

  1. Are conferences failing you too? (16 comments)

  2. Your best work(space) (13 comments)

  3. The Agile toolbox (13 comments)

Personal favourites

Evan

Matt

Where our readers come from

The distribution of readers is global, but has a power law distribution. About 75% of our readers this year were from one of nine countries: USA, Canada, UK, Australia, Norway, India, Germany, Indonesia, and Russia. Some of those are big countries, so we should correct for population—let's look at the number of Agile blog readers per million citizens:

2012_blog_readers_logscale.png
  1. Norway — 292

  2. Canada — 283

  3. Australia — 108

  4. UK — 78

  5. Qatar — 72

  6. Brunei — 67

  7. Ireland — 57

  8. Iceland — 56

  9. Denmark — 46

  10. Netherlands — 46

So we're kind of a big deal in Norway. Hei hei Norge! Kansje vi skulle skrive på norsk herifra.

Google Analytics tells us when people visit too. The busiest days are Tuesday, Wednesday, and Thursday, then Monday and Friday. Weekends are just crickets. Not surprisingly, the average reading time rises monotonically from Monday to Friday — reaching a massive 2:48 on Fridays. (Don't worry, dear manager, those are minutes!)

What we actually do

We don't write much about our work on this blog. In brief, here's what we've been up to:

  • Volume interpretation and rock physics for a geothermal field in southern California

  • Helping the Government of Canada get some of its subsurface data together

  • Curating subsurface content in a global oil & gas company's corporate wiki

  • Getting knowledge sharing off the ground at a Canadian oil & gas company

Oh yeah, we did launch this awesome little book too. That was a proud moment. 

We're looking forward to a fun-filled, idea-jammed, bee-busy 2013 — and wish the same for you. Thank you for your support and encouragement this year. Have a fantastic Yuletide.

Journalists are scientists

Tim Radford. Image: Stevyn Colgan.On Thursday I visited The Guardian’s beautiful offices in King’s Cross for one of their Masterclass sessions. Many of them have sold out, but Tim Radford’s science writing evening did so in hours, and the hundred-or-so budding writers present were palpably excited to be there. The newspaper is one of the most progressive news outlets in the world, and boasts many venerable alumni (John Maddox and John Durant among them). It was a pleasure just to wander around the building with a glass of wine, with some of London’s most eloquent nerds.

Radford is not a trained scientist, but a pure journalist. He left school at 16, idolized Dylan Thomas, joined a paper, wrote like hell, and sat on almost every desk before mostly retiring from The Guardian in 2005. He has won four awards from the Association of British Science Writers. More people read any one of his science articles on a random Tuesday morning over breakfast than will ever read anything I ever write. Tim Radford is, according to Ed Yong, the Yoda of science writers.

Within about 30 minutes it became clear what it means to be a skilled writer: Radford’s real craft is story-telling. He is completely at home addressing a crowd of scientists — he knows how to hold a mirror up to the geeks and reflect the fun, fascinating, world-changing awesomeness back at them. “It’s a terrible mistake to think that because you know about a subject you are equipped to write about it,” he told us, getting at how hard it is to see something from within. It might be easier to write creatively, and with due wonder, about fields outside our own.

Some in the audience weren’t content with being entertained by Radford, watching him in action as it were, preferring instead to dwell on controversy. He mostly swatted them aside, perfectly pleasantly, but one thing he was having none of was the supposed divide between scientists and journalists. Indeed, Radford asserted that journalists and scientists do basically the same thing: imagine a story (hypothesis), ask questions (do experiments), form a coherent story (theory) from the results, and publish. Journalists are scientists. Kind of.

I loved Radford's committed and unapologetic pragmatism, presumably the result of several decades of deadlines. “You don’t have to be ever so clever, you just have to be ever so quick,” and as a sort of corollary: “You can’t be perfectly right, but you must be mostly right.” One questioner accused journalists of sensationalising science (yawn). “Of course we do!” he said — because he wants his story in the paper, and he wants people to read it. Specifically, he wants people who don’t read science stories to read it. After all, writing for other people is all about giving them a sensation of one kind or another.

I got so much out of the 3 hours I could write at least another 2000 words, but I won’t. The evening was so popular that the paper decided to record the event and experiment with a pay-per-view video, so you can get all the goodness yourself. If you want more Radford wisdom, his Manifesto for the simple scribe is a must-read for anyone who writes.

Tim Radford's most recent book, The Address Book: Our Place in the Scheme of Things, came out in spring 2011.

The photograph of Tim Radford, at The World's Most Improbable Event on 30 September, is copyright of Stevyn Colgan, and used with his gracious permission. You should read his blog, Colganology. The photograph of King's Place, the Guardian's office building, is by flickr user Davide Simonetti, licensed CC-BY-NC.