R is for Resolution
/ Resolution is becoming a catch-all term for various aspects of the quality of a digital signal, whether it's a photograph, a sound recording, or a seismic volume.
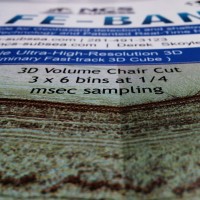
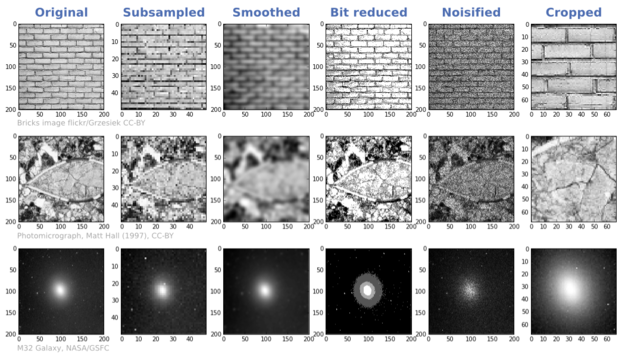
I got thinking about this on seeing an ad in AAPG Explorer magazine, announcing an 'ultra-high-resolution' 3D in the Gulf of Mexico (right), aimed at site-survey and geohazard detection. There's a nice image of the 3D, but the only evidence offered for the 'ultra-high-res' claim is the sample interval in space and time (3 m × 6 m bins and 0.25 ms sampling). This is analogous to the obsession with megapixels in digital photography, but it is only one of several ways to look at resolution. The effect of increasing the sample interval of some digital images is shown in the second column here, compared to 200 × 200 pixels originals (click to zoom):
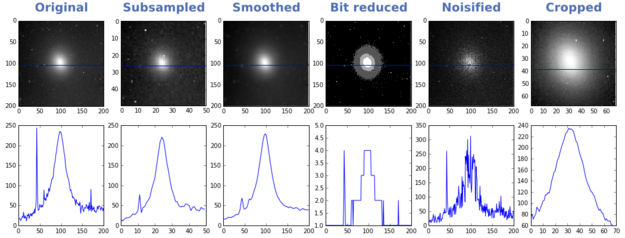
 Another aspect of resolution is spatial bandwidth, which gets at resolving power, perhaps analogous to focus for a photographer. If the range of frequencies is too narrow, then broadband features like edges cannot be represented. We can simulate poor frequency content by bandpassing the data, for example smoothing it with a Gaussian filter (column 3).
Yet another way to think about resolution is precision (column 4). Indeed, when audiophiles talk about resolution, they are talking about bit depth. We usually record seismic with 32 bits per sample, which allows us to discriminate between a large number of values — but we often view seismic with only 6 or 8 bits of precision. In the examples here, we're looking at 2 bits. Fewer bits means we can't tell the difference between some values, especially as it usually results in clipping.
If it comes down to our ability to tell events (or objects, or values) apart, then another factor enters the fray: signal-to-noise ratio. Too much noise (column 5) impairs our ability to resolve detail and discriminate between things, and to measure the true value of, say, amplitude. So while we don't normally talk about the noise level as a resolution issue, it is one. And it may have the most variety: in seismic acquisition we suffer from thermal noise, line noise, wind and helicopters, coherent noise, and so on.
I can only think of one more impairment to the signals we collect, and it may be the most troubling: the total duration or extent of the observation (column 6). How much information can you afford to gather? Uncertainty resulting from a small window is the basis of the game Name That Tune. If the scale of observation is not appropriate to the scale we're interested in, we risk a kind of interpretation 'gap' — related to a concept we've touched on before — and it's why geologists' brains need to be helicoptery. A small 3D is harder to interpret than a large one.
The final consideration is not a signal effect at all. It has to do with the nature of the target itself. Notice how tolerant the brick wall image is to the various impairments (especially if you know what it is), and how intolerant the photomicrograph is. In the astronomical image, the galaxy is tolerant; the stars are not. Notice too that trying to 'resolve' the galaxy (into a point, say) would be a mistake: it is inherently low-resolution. Indeed, its fuzziness is one of its salient features.
Have I missed anything? Are there other ways in which the recorded signal can suffer and targets can be confused or otherwise unresolved? How does illumination fit in here, or spectral bandwidth? What do you mean when you talk about resolution?
This post is an exceprt from my talk at SEG, which you can read about in this blog post. You can even listen to it if you're really bored. The images were generated by one of my IPython Notebooks that I point to in the talk, specifically images.ipynb.
Astute readers with potent memories will have noticed that we have skipped Q in our A to Z. I just cannot seem to finish my post about Q, but I will!
The Safe Band ad is copyright of NCS SubSea. This low-res snippet qualifies as fair use for comment.


 Except where noted, this content is licensed