Why do wavelets have sidelobes?

Brian Romans (a geology professor at Virginia Tech) asked a great question in the Software Underground’s Slack earlier this month:

I was teaching my Seismic Stratigrapher course the other day and a student asked me about the origin of ‘side lobes’ on the Ricker wavelet. I didn’t have a great answer [...] what is a succinct explanation for the side lobes?

Questions like this are fantastic because they really aren’t easy to answer. There’s usually a breadcrumb trail of concepts that lead to an answer, but the trail might be difficult to navigate, and some of those breadcrumbs will lead to more questions… and soon you’ve written a textbook on signal processing.

Here’s how I attempted, rather long-windedly, to help Brian’s student (edited a bit for brevity):

Wavelets measure displacement, or velocity, or acceleration (or some proxy for these things like voltage or capacitance), but eventually we can compute a signal that represents displacement. (In seismic reflection surveys, we don't care about the units.)

The Ricker wavelet represents an impulsive signal (the 'bang' of dynamite or the 'pop' of an airgun; let's leave Vibroseis out of it for now). The impulse is bandlimited ('band' as in radio band) — in other words, it doesn't contain all frequencies. Unfortunately, you need a lot of frequencies to represent very sudden or abrupt (short in time) things like bangs and pops, otherwise they spread out in time. Since our wavelet is restricted to a band of frequencies (eg 10 to 80 Hz), it must be (infinitely) spread out in time.

Additionally, since the frequencies don't contain what we call a 'DC' signal (0 Hz, in other words a bias or shift), it must return to zero when displaced. So it starts and ends on zero amplitude.

So the wavelet is spread out, and it starts and ends on zero amplitude. Why does it wiggle? In other words, why is seismic oscillatory? It's not the geophone: although it contains a spring (or something like one), its specially chosen/tuned to be able to move freely at the frequencies we're trying to record. So it's the stiffness of the earth itself which causes the oscillation, dissipating the vibrational energy (as heat) and damping the signal. At least, this explains why it dies out, but not really why it oscillates... Physics! Simple harmonic motion! Or something.

Yeah, I guess I’m a bit hazy on the micro-mechanics of wave propagation. Evan came to my rescue (see below), but I had a couple more things to say first:

The other thing is that classic wavelets like the Ricker are noncausal, aka non-realizable, because they have energy at negative time (i.e. they are centered around t = 0) and there’s no such thing as negative time. This is a clue that a zero-phase wavelet is a geological convenience contrived during processing, not a physical thing. The field seismic data would contain a so-called 'minimum phase' wavelet, which looks more like what you'd expect a recording of a dynamite blast to look like (see below).

To try to make up for the fact that I trailed off at ‘simple harmonic motion’, Evan offered this:

If you imagine the medium being made up of a bunch of particles, then propagating a wave means causing a stress (say, sudden compression at the surface) and then stretching and squeezing those particles to accommodate that stress. A compression (which we may measure or draw as a peak) does not come without a stretching (a dilation or trough) of particles on either side. So a side lobe (or a dilation) has to exist in a way: the particles are connected together and stretch and squeeze when they feel pressure.

Choice of wavelet matters

There was more from Doug McClymont, who’s always up for some chat about wavelets. He pointed out that although high-bandwidth Ormsby wavelets have more sidelobes, they generally have lower amplitudes than a Ricker wavelet, whose sidelobes always have the same ampitude (exactly \( 2 \mathrm{e}^{-3/2} \)). He added:

I tend not to use Ricker wavelets for very much as you can't control the bandwidth of them (just the peak frequency) so they tend to be very narrow-band and have quite high (and constant) amplitude side lobes. As I work a lot with broadband seismic data I use Ormsby wavelets much more for any well-ties and seismic modelling.

Good reasons to use an Ormsby wavelet as your analaytic wavelet of choice! Check out this other post all about Ormsby wavelets and how to make them.

What do you think? Do you have an intuitive explanation for why wavelets have sidelobes? Ideally shorter than mine!

Machine learning meets seismic interpretation

Agile has been reverberating inside the machine learning echo chamber this past week at EAGE. The hackathon's theme was machine learning, Monday's workshop was all about machine learning. And Matt was also supposed to be co-chairing the session on Applications of machine learning for seismic interpretation with Victor Aare of Schlumberger, but thanks to a power-cut and subsequent rescheduling, he found himself double-booked so, lucky me, he invited me to sit in his stead. Here are my highlights, from the best seat in the house.

Before I begin, I must mention the ambivalence I feel towards the fact that 5 of the 7 talks featured the open-access F3 dataset. A round of applause is certainly due to dGB Earth Sciences for their long time stewardship of open data. On the other hand, in the sardonic words of my co-chair Victor Aarre, it would have been quite valid if the session was renamed The F3 machine learning session. Is it really the only quality attribute research dataset our industry can muster? Let's do better.

Using seismic texture attributes for salt classification

Ghassan AlRegib ruled the stage throughout the session with not one, not two, but three great talks on behalf of himself and his grad students at Georgia Institute of Technology (rather than being a show of bravado, this was a result of problems with visas). He showed some exciting developments in shallow learning methods for predicting facies in seismic data. In addition to GLCM attributes, he also introduced a couple of new (to me anyway) attributes for salt classification. Namely, textural gradient and a thing he called seismic saliency, a metric modeled after the human visual system describing the 'reaction' between relative objects in a 3D scene. 

Twelve Seismic attributes used for multi-attribute salt-boundary classification. (a) is RMS Amplitude, (B) to (M) are TEXTURAL attributes. See abstract for details. This figure is copyright of Ghassan AlRegib and licensed CC-BY-SA by virtue of being generated from the F3 dataset of dGB and TNO.

Ghassan also won the speakers' lottery, in a way. Due to the previous day's power outage and subsequent reshuffle, the next speaker in the schedule was a no-show. As a result, Ghassan had an extra 20 minutes to answer questions. Now for most speakers that would be a public-speaking nightmare, but Ghassan hosted the onslaught of inquiring minds beautifully. If we hadn't had to move on to the next next talk, I'm sure he could have entertained questions all afternoon. I find it fascinating how unpredictable events like power outages can actually create the conditions for really effective engagement. 

Salt classification without using attributes (using deep learning)

Matt reported on Anders Waldeland's work a year ago, and it was interesting to see how his research has progressed, as he nears the completion of his thesis. 

Anders successfully demonstrated how convolutional neural networks (CNNs) can classify salt bodies in seismic datasets. So, is this a big deal? I think it is. Indeed, Anders's work seems like a breakthough in seismic interpretation, at least of salt bodies. To be clear, I don't think this means that it is time for seismic interpreters to pack up and go home. But maybe we can start looking forward to spending our time doing less tedious things than picking complex salt bodies.  

One slice of a 3d seismic volume with two CLASS LABELS: Salt (red) and Not SALT (GREEN). This is the training data. On the right: Extracted 3D salt body in the same dataset, coloured by elevation. Copyright of A Waldeland, used with permission.

One slice of a 3d seismic volume with two CLASS LABELS: Salt (red) and Not SALT (GREEN). This is the training data. On the right: Extracted 3D salt body in the same dataset, coloured by elevation. Copyright of A Waldeland, used with permission.

He trained a CNN on one manually labeled slice of a 3D cube and used the network to automatically classify the full 3D salt body (on the right in the figure). Conventional algorithms for salt picking, such as that used by AlRegib (see above), typically rely on seismic attributes to define a feature space. This requires professional insight and judgment, and is prone to error and bias. Nicolas Audebert mentioned the same shortcoming in his talk in the workshop Matt wrote about last week. In contrast, the CNN algorithm works directly on the seismic data, learning the most discriminative filters on its own, no attributes needed

Intuition training

Machine learning isn't just useful for computing in the inverse direction such as with inversion, seismic interpretation, and so on. Johannes Amtmann showed us how machine learning can be useful for ranking the performance of different clustering methods using forward models. It was exciting to see: we need to get back into the habit of forward modeling, each and every one of us. Interpreters build synthetics to hone their seismic intuition. It's time to get insanely good at building forward models for machines, to help them hone theirs. 

There were so many fascinating problems being worked on in this session. It was one of the best half-day sessions of technical content I've ever witnessed at a subsurface conference. Thanks and well done to everyone who presented.


x lines of Python: AVO plot

Amplitude vs offset (or, more properly, angle) analysis is a core component of quantitative interpretation. The AVO method is based on the fact that the reflectivity of a geological interface does not depend only on the acoustic rock properties (velocity and density) on both sides of the interface, but also on the angle of the incident ray. Happily, this angular reflectivity encodes elastic rock property information. Long story short: AVO is awesome.

As you may know, I'm a big fan of forward modeling — predicting the seismic response of an earth model. So let's model the response the interface between a very simple model of only two rock layers. And we'll do it in only a few lines of Python. The workflow is straightforward:

  1. Define the properties of a model shale; this will be the upper layer.
  2. Define a model sandstone with brine in its pores; this will be the lower layer.
  3. Define a gas-saturated sand for comparison with the wet sand. 
  4. Define a range of angles to calculate the response at.
  5. Calculate the brine sand's response at the interface, given the rock properties and the angle range.
  6. For comparison, calculate the gas sand's response with the same parameters.
  7. Plot the brine case.
  8. Plot the gas case.
  9. Add a legend to the plot.

That's it — nine lines! Here's the result:


Once we have rock properties, the key bit is in the middle:

    θ = range(0, 31)
    shuey = bruges.reflection.shuey2(vp0, vs0, ρ0, vp1, vs1, ρ1, θ)

shuey2 is one of the many functions in bruges — here it provides the two-term Shuey approximation, but it contains lots of other useful equations. Virtually everything else in our AVO plotting routine is just accounting and plotting.


As in all these posts, you can follow along with the code in the Jupyter Notebook. You can view this on GitHub, or run it yourself in the increasingly flaky MyBinder (which is down at the time of writing... I'm working on an alternative).

What would you like to see in x lines of Python? Requests welcome!

Q is for Q

Quality factor, or \(Q\), is one of the more mysterious quantities of seismology. It's right up there with Lamé's \(\lambda\) and Thomsen's \(\gamma\). For one thing, it's wrapped up with the idea of attenuation, and sometimes the terms \(Q\) and 'attenuation' are bandied about seemingly interchangeably. For another thing, people talk about it like it's really important, but it often seems to be completely ignored.

A quick aside. There's another quality factor: the rock quality factor, popular among geomechnicists (geomechanics?). That \(Q\) describes the degree and roughness of jointing in rocks, and is probably related — coincidentally if not theoretically — to seismic \(Q\) in various nonlinear and probably profound ways. I'm not going to say any more about it, but if this interests you, read Nick Barton's book, Rock Quality, Seismic Velocity, Attenuation and Anistropy (2006; CRC Press) if you can afford it. 

So what is Q exactly?

We know intuitively that seismic waves lose energy as they travel through the earth. There are three loss mechanisms: scattering (elastic losses resulting from reflections and diffractions), geometrical spreading, and intrinsic attenuation. This last one, anelastic energy loss due to absorption — essentially the deviation from perfect elasticity — is what I'm trying to describe here.

I'm not going to get very far, by the way. For the full story, start at the seminal review paper entitled \(Q\) by Leon Knopoff (1964), which surely has the shortest title of any paper in geophysics. (Knopoff also liked short abstracts, as you see here.)

The dimensionless seismic quality factor \(Q\) is defined in terms of the energy \(E\) stored in one cycle, and the change in energy — the energy dissipated in various ways, such as fluid movement (AKA 'sloshing', according to Carl Reine's essay in 52 Things... Geophysics) and intergranular frictional heat ('jostling') — over that cycle:

$$ Q \stackrel{\mathrm{def}}{=} 2 \pi \frac{E}{\Delta E} $$

Remarkably, this same definition holds for any resonator, including pendulums and electronics. Physics is awesome!

Because the right-hand side of that relationship is sort of upside down — the loss is in the denominator — it's often easier to talk about \(Q^{-1}\) which is, more or less, the percentage loss of energy in a single wavelength. This inverse of \(Q\) is proportional to the attenuation coefficient. For more details on that relationship, check out Carl Reine's essay.

This connection with wavelengths means that we have to think about frequency. Because high frequencies have shorter cycles (by definition), they attenuate faster than low frequencies. You know this intuitively from hearing the beat, but not the melody, of distant music for example. This effect does not imply that \(Q\) depends on frequency... that's a whole other can of worms. (Confused yet?)

The frequency dependence of \(Q\)

It's thought that \(Q\) is roughly constant with respect to frequency below about 1 Hz, then increases with \(f^\alpha\), where \(\alpha\) is about 0.7, up to at least 25 Hz (I'm reading this in Mirko van der Baan's 2002 paper), and probably beyond. Most people, however, seem to throw their hands up and assume a constant \(Q\) even in the seismic bandwidth... mainly to make life easier when it comes to seismic processing. Attempting to measure, let alone compensate for, \(Q\) in seismic data is, I think it's fair to say, an unsolved problem in exploration geophysics.

Why is it worth solving? I think the main point is that, if we could model and measure it better, it could be a semi-independent measure of some rock properties we care about, especially velocity. Actually, I think it's even a stretch to call velocity a rock property — most people know that velocity depends on frequency, at least across the gulf of frequencies between seismic and acoustic logging tools, but did you know that velocity also depends on amplitude? Paul Johnson tells about this effect in his essay in the forthcoming 52 Things... Rock Physics book — stay tuned for more on that.

For a really wacky story about negative values of \(Q\) — which imply transmission coefficients greater than 1 (think about that) — check out Chris Liner's essay in the same book (or his 2014 paper in The Leading Edge). It's not going to help \(Q\) get any less mysterious, but it's a good story. Here's the punchline from a Jupyter Notebook I made a while back; it follows along with Chris's lovely paper:

Top: Velocity and the Backus average velocity in the E-38 well offshore Nova Scotia. Bottom: Layering-induced attenuation, or 1/Q, in the same well. Note the negative numbers! Reproduction of Liner's 2014 results in a Jupyter Notebook.

Top: Velocity and the Backus average velocity in the E-38 well offshore Nova Scotia. Bottom: Layering-induced attenuation, or 1/Q, in the same well. Note the negative numbers! Reproduction of Liner's 2014 results in a Jupyter Notebook.

Hm, I had hoped to shed some light on \(Q\) in this post, but I seem to have come full circle. Maybe explaining \(Q\) is another unsolved problem.

References

Barton, N (2006). Rock Quality, Seismic Velocity, Attenuation and Anisotropy. Florida, USA: CRC Press. 756 pages. ISBN 9780415394413.

Johnson, P (in press). The astonishing case of non-linear elasticity.  In: Hall, M & E Bianco (eds), 52 Things You Should Know About Rock Physics. Nova Scotia: Agile Libre, 2016, 132 pp.

Knopoff, L (1964). Q. Reviews of Geophysics 2 (4), 625–660. DOI: 10.1029/RG002i004p00625.

Reine, C (2012). Don't ignore seismic attenuation. In: Hall, M & E Bianco (eds), 52 Things You Should Know About Geophysics. Nova Scotia: Agile Libre, 2012, 132 pp.

Liner, C (2014). Long-wave elastic attenuation produced by horizontal layering. The Leading Edge 33 (6), 634–638. DOI: 10.1190/tle33060634.1. Chris also blogged about this article.

Liner, C (in press). Negative Q. In: Hall, M & E Bianco (eds), 52 Things You Should Know About Rock Physics. Nova Scotia: Agile Libre, 2016, 132 pp.

van der Bann, M (2002). Constant Q and a fractal, stratified Earth. Pure and Applied Geophysics 159 (7–8), 1707–1718. DOI: 10.1007/s00024-002-8704-0.

What is anisotropy?

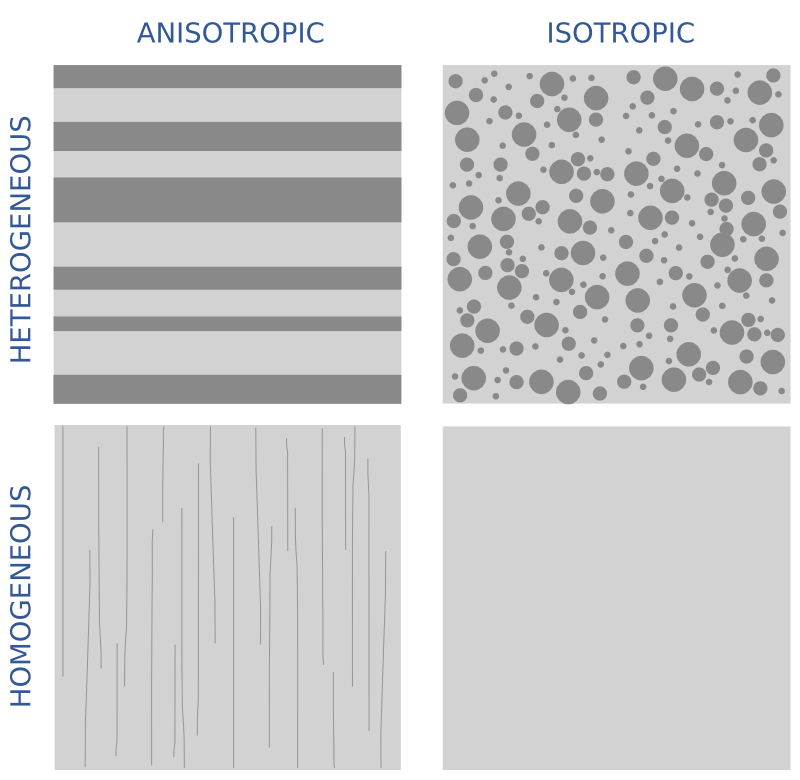
anisotropy_vs_heterogeneity.png

Geophysicists often assume that the earth is isotropic. This word comes from 'iso', meaning same, and 'tropikos', meaning something to do with turning. The idea is that isotropic materials look the same in all directions — they have no orientation, and we can make measurements in any direction and get the same result. Note that this is different from homogeneous, which is the quality of uniformity of composition. You can think of anisotropy as a directional (not just spatial) variation in homogeneity. 

In the illustration, I may have cheated a bit. The lower-left image shows a material that is homogeneous but anisotropic. The thin lines are supposed to indicate microfractures, say, or the alignment of clay flakes, or even just stress. So although the material has uniform composition, at least at this scale, it has an orientation.

The recognition of the earth's anisotropy is a dominant theme among papers in our forthcoming 52 Things book on rock physics. It's not exactly a new thing — it was an emerging trend 10 years ago when Larry Lines at U of C reviewed Milo Backus's famous 'challenges' (Lines 2005). And even then, the spread of anisotropic processing and analysis had been underway for almost 20 years since Leon Thomsen's classic 1986 paper, Weak elastic anisotropy. This paper introduced three parameters that we need—alongside the usual \(V_\text{P}\), \(V_\text{S}\), and \(\rho\)—to describe anisotropy. They are \(\delta\) (delta), \(\epsilon\) (epsilon), and \(\gamma\) (gamma), collectively referred to as Thomsen's parameters

  • \(\delta\) or delta — the short offset effect — captures the relationship between the velocity required to flatten gathers (the NMO velocity) and the zero-offset average velocity as recorded by checkshots. It's easy to measure, but perhaps hard to understand in physical terms.
  • \(\epsilon\) or epsilon — the long offset effect — is, according to Thomsen himself:  "the fractional difference between vertical and horizontal P velocities; i.e., it is the parameter usually referred to as 'the' anisotropy of a rock". Unfortunately, the horizontal velocity is rather hard to measure. 
  • \(\gamma\) or gamma — the shear wave effect — relates, as rock physics meister Colin Sayers put it on Twitter, a horizontal shear wave with horizontal polarization to a vertical shear wave. He added, "\(\gamma\) can be determined in a single well using sonic. So the correlation with \(\epsilon\) and \(\delta\) is of great interest."

Sidenote to aspiring authors: Thomsen's seminal paper, which has been cited over 2800 times, is barely 13 pages long. Three and a half of those pages are taken up by... data! A huge table containing the elastic parameters of almost 60 samples. And this is from a corporate scientist at Amoco. So no more excuses: publish you data! </rant>

Vertical transverse what now?

The other bit of jargon you will come across is the concept of transverse isotropy, which is a slightly perverse (to me) way of expressing the orientation of the anisotropy effect. In vertical transverse isotropy, the horizontal velocity is different from the vertical velocity. Think of flat-lying shales with gravity dominating the stress field. Usually, the velocity is faster along the beds than it is across the beds. This manifests as nonhyperbolic moveout in the far offsets, in particular a pull-up or 'hockey stick' effect in the gathers — the arrivals are unexpectedly early at long offsets. Clearly, this will also affect AVO analysis

There's more jargon. If the rocks are dipping, we call it tilted transverse isotropy, or TTI. But if the anisotropies, so to speak, are oriented vertically — as with fractures, for example, or simply horizontal stress — then it's horizontal transverse isotropy, or HTI. This causes azimuthal (compass directional) travel-time variations. We can even venture into situations where we encounter orthorhombic anisotropy, as in the combined VTI/HTI model shown above. It's easy to imagine how these effects, if not accounted for in processing, can (and do!) result in suboptimal seismic images. Accounting for them is not easy though, and trying can do more harm than good.

If you have handy rules of thumb of ways of conceptualizing anisotropy, I'd love to hear about them. Some time soon I want to write about thin-layer anisotropy, which is where this post was going until I got sidetracked...

References

Lines, L (2005). Addressing Milo's challenges with 25 years of seismic advances. The Leading Edge 24 (1), 32–35. DOI 10.1190/1.2112389.

Thomsen, L (1986). Weak elastic anisotropy. Geophysics 51 (10), 1954–1966. DOI 10.1190/1.1442051.

Not picking parameters

I like socks. Bright ones. I've liked bright socks since Grade 6. They were the only visible garment not governed by school uniform, or at least not enforced, and I think that was probably the start of it. The tough boys wore white socks, and I wore odd red and green socks. These days, my favourites are Cole & Parker, and the only problem is: how to choose?

Last Tuesday I wrote about choosing parameters for geophysical algorithms — window lengths, velocities, noise levels, and so on. Like choosing socks, it's subjective, and it's hard to find a pair for every occasion. The comments from Matteo, Toastar, and GuyM raised an interesting question: maybe the best way to pick parameters is to not pick them? I'm not talking about automatically optimizing parameters, because that's still choosing. I'm talking about not choosing at all.

How many ways can we think of to implement this non-choice? I can think of four approaches, but I'm not 100% sure they're all different, or if I can even describe them...

Is the result really optimal, or just a hard-to-interpret patchwork?

Adaptivity

Well, okay, we still choose, but we choose a different value everywhere depending on local conditions. A black pair for a formal function, white for tennis, green for work, and polka dots for special occasions. We can adapt to any property (rather like automatic optimization), along any dimension of our data: spatially, azimuthally,  temporally, or frequentially (there's a word you don't see every day).

Imagine computing seismic continuity. At each sample, we might evaluate some local function — such as contrast — for a range of window sizes. Or, when smoothing, we might specifiy some minimum signal loss compared to the original. We end up using a different value everywhere, and expect an optimal result.

One problem is that we still have to choose a cost function. And to be at all useful, we would need to produce two new data products, besides the actual result: a map of the parameter's value, and a map of the residual cost, so to speak. In other words, we need a way to know what was chosen, and how satisfactory the choice was.

Stochastic shotgun

We could fall back on that geostatistical favourite and pick the parameter values stochastically, grabbing socks at random out of the drawer. This works, but I need a lot of socks to have a chance of getting even a local maximum. And we run into the old problem of really not knowing what to do with all the realizations. Common approaches are to take the P50, P10, and P90, or to average them. Both of these approaches make me want to ask: Why did I generate all those realizations?

Experimental design methods

The design of experiments is a big deal in the life sciences,  but for some reason rarely (never?) talked about in geoscience. Applying a cost function, or even just visual judgment, to a single parameter is perhaps trivial, but what if you have two variables? Three? What if they are non-linear and covariant? Then the optimization process amounts to a sticky inverse problem.

Fortunately, lots of clever people have thought about these problems. I've even seen them implemented in subsurface software. Cool-sounding combinatorial reduction techniques like Greco-Latin squares, or Latin hypercubes offer ways to intelligently sample the parameter space and organize the results. We could do the same with socks, evaluating pattern and toe colour separately...

The mixing board

There is another option: the mixing board. Like a music producer, a film editor, or the Lytro camera, I can leave the raw data in place, and always work from the masters. Given the right tools, I can make myself just the right pair of socks whenever I like.

This way we can navigate the parameter space, applying views, processes, or other tools on the fly. Clearly this would mean changing everything about the way we work. We'd need a totally different approach not just to interpretation, but to the entire subsurface characterization workflow.

Are there other ways to avoid choosing? What are people using in other industries, or other sciences? I think we need to invite some experimental design and machine learning people to SEG...

Cole & Parker socks are awesomeThe quilt image is by missvancamp on Flickr and licensed CC-BY. The spools are by surfzone on Flickr, licensed CC-BY. Many thanks to Cole & Parker for permission to use the sock images, despite not knowing what on earth I was going to do with them. Buy their socks! They're Canadian and everything.

The most important thing nobody does

A couple of weeks ago, we told you we were up to something. Today, we're excited to announce modelr.io — a new seismic forward modeling tool for interpreters and the seismically inclined.

Modelr is a web app, so it runs in the browser, on any device. You don't need permission to try it, and there's never anything to install. No licenses, no dongles, no not being able to run it at home, or on the train.

Later this week, we'll look at some of the things Modelr can do. In the meantime, please have a play with it.
Just go to modelr.io and hit Demo, or click on the screenshot below. If you like what you see, then think about signing up — the more support we get, the faster we can make it into the awesome tool we believe it can be. And tell your friends!

If you're intrigued but unconvinced, sign up for occasional news about Modelr:

This will add you to the email list for the modeling tool. We never share user details with anyone. You can unsubscribe any time.

What is the Gabor uncertainty principle?

This post is adapted from the introduction to my article Hall, M (2006), Resolution and uncertainty in spectral decomposition. First Break 24, December 2006. DOI: 10.3997/1365-2397.2006027. I'm planning to delve into this a bit, partly as a way to get up to speed on signal processing in Python. Stay tuned.


Spectral decomposition is a powerful way to get more from seismic reflection data, unweaving the seismic rainbow.There are lots of ways of doing it — short-time Fourier transform, S transform, wavelet transforms, and so on. If you hang around spectral decomposition bods, you'll hear frequent mention of the ‘resolution’ of the various techniques. Perhaps surprisingly, Heisenberg’s uncertainty principle is sometimes cited as a basis for one technique having better resolution than another. Cool! But... what on earth has quantum theory got to do with it?

A property of nature

Heisenberg’s uncertainty principle is a consequence of the classical Cauchy–Schwartz inequality and is one of the cornerstones of quantum theory. Here’s how he put it:

At the instant of time when the position is determined, that is, at the instant when the photon is scattered by the electron, the electron undergoes a discontinuous change in momen- tum. This change is the greater the smaller the wavelength of the light employed, i.e. the more exact the determination of the position. At the instant at which the position of the electron is known, its momentum therefore can be known only up to magnitudes which correspond to that discontinuous change; thus, the more precisely the position is determined, the less precisely the momentum is known, and conversely. — Heisenberg (1927), p 174-5.

The most important thing about the uncertainty principle is that, while it was originally expressed in terms of observation and measurement, it is not a consequence of any limitations of our measuring equipment or the mathematics we use to describe our results. The uncertainty principle does not limit what we can know, it describes the way things actually are: an electron does not possess arbitrarily precise position and momentum simultaneously. This troubling insight is the heart of the so-called Copenhagen Interpretation of quantum theory, which Einstein was so famously upset by (and wrong about).

Dennis Gabor (1946), inventor of the hologram, was the first to realize that the uncertainty principle applies to signals. Thanks to wave-particle duality, signals turn out to be exactly analogous to quantum systems. As a result, the exact time and frequency of a signal can never be known simultaneously: a signal cannot plot as a point on the time-frequency plane. Crucially, this uncertainty is a property of signals, not a limitation of mathematics.

Getting quantitative

You know we like the numbers. Heisenberg’s uncertainty principle is usually written in terms of the standard deviation of position σx, the standard deviation of momentum σp, and the Planck constant h:

In other words, the product of the uncertainties of position and momentum is small, but not zero. For signals, we don't need Planck’s constant to scale the relationship to quantum dimensions, but the form is the same. If the standard deviations of the time and frequency estimates are σt and σf respectively, then we can write Gabor’s uncertainty principle thus:

So the product of the standard deviations of time, in milliseconds, and frequency, in Hertz, must be at least 80 ms.Hz, or millicycles. (A millicycle is a sort of bicycle, but with 1000 wheels.)

The bottom line

Signals do not have arbitrarily precise time and frequency localization. It doesn’t matter how you compute a spectrum, if you want time information, you must pay for it with frequency information. Specifically, the product of time uncertainty and frequency uncertainty must be at least 1/4π. So how certain is your decomposition?

References

Heisenberg, W (1927). Über den anschaulichen Inhalt der quantentheoretischen Kinematik und Mechanik, Zeitschrift für Physik 43, 172–198. English translation: Quantum Theory and Measurement, J. Wheeler and H. Zurek (1983). Princeton University Press, Princeton.

Gabor, D (1946). Theory of communication. Journal of the Institute of Electrical Engineering 93, 429–457.

The image of Werner Heisenberg in 1927, at the age of 25, is public domain as far as I can tell. The low res image of First Break is fair use. The bird hologram is form a photograph licensed CC-BY by Flickr user Dominic Alves