
Burning the surface onto the subsurface
/
Previously, I described a few of the reasons why we don't get a clean ground surface event on land seismic data like we do the water-bottom in marine seismic. In land data, the worst part of the image is right at the surface. But ground level is not just tricky to see, it's impossible to see. Since the vibe truck is on the ground, there's no reflection from that surface. Even if there was some kind of event there, processors apply a magic eraser to the top of the section — the mute — to erase the early arrivals. So it's not possible to see the ground in land data, and you can't pick what isn't there.
But I still want to know where the ground is. Why can't we slap a ground-level seismic 'reflection' event on the section?
What you need
We need the ground level, which is in depth of course, in the time domain of the seismic section. To compute this, let's call it \(t_\mathrm{G}\), we need three pieces of information at every trace location: the ground elevation \(G\), the seismic reference datum (SRD) which I'll call \(D\), and the replacement velocity \(V_\mathrm{r}\).
$$ t_\mathrm{G} = \frac{2 (G - D)}{V_\mathrm{r}} $$
Ground elevation. If you're lucky, you'll be able to find the ground elevation corresponding to each trace stored in the trace headers. Ground elevation might be located in bytes 41-44 or 45-48 of the trace header, which correspond to the receiver group elevation and the surface elevation of the source, respectively. These should be the same for a stacked trace, but as with any meta-data to do with SEGY, this info could be hiding somewhere else, or missing altogether. And if you're that unlucky, you might have to comb through processing reports for the missing information. If you are even more unlucky (as I was in this example), you won't have any kind of processing report to fall back on and you'll have to concoct something else. In the accompanying Jupyter notebook, I resorted to interpolating a digitized elevation profile from a JPEG plot of the seismic line. So if you're all out of options, you might find refuge in those legacy plots!

This profile is particularly wonky, because the seismic reference datum (red) is not the same across the profile
Seismic reference datum. And to make life yet more complicated, the seismic reference datum is not flat across the profile. It goes downhill and then flattens out (red line below). Don't ask me what the advantages are of processing data to a variable datum, but whatever they are, I hope they offset the disadvantages of all-to-easily mistaking the datum to be flat.
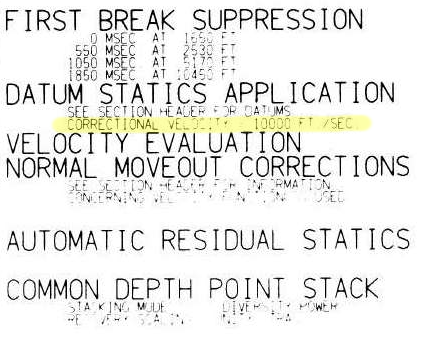
The replacement velocity is given in the sidelabel of the raster image online (shown right). It's 10 000 ft/sec, or 3048 m/s.
Byte locations 53-56 and 57-60 are the standard trace header placeholders reserved for holding the datum elevation at the receiver group and the datum elevation at source. Again, for a stacked trace, these should be the same value. If these fields are zeros, then check the fields of the Trace Header Extension. If they turn up empty, and if the datum is horizontal, it might be listed in the file's text header.
Convert elevation to time
By definition, the seismic reference datum is horizontal in the time-domain (red line below). Notice how the ground elevation – in the time domain – plots mostly as negative values (before) time zero. In other words, most of the ground is being cut-off by the top of the section. So, if we want to see it, we need to shift everything down into the field of view. Conceptually, this means adjusting the seismic reference datum so it floats entirely above the ground-level. Computationally, we can achieve this easily enough by padding the top of the data with zeros.

A time-domain representation of the ground-level along the seismic profile. The surface of the earth extends above the start of the seismic data for most of the locations along the profile.
Make the ground a pickable event
As a final bit of post-processing, we could actually burn the ground-level into the data as a sort of synthetic seismic event. The reason I like this concept is that it alleviates the need to dig up old-processing reports, puzzle over missing header data, or worse, maintain and munge external text files containing elevation information. I say, let's make it self-contained. Let's put it directly into the data so that it can be treated like any other seismic reflection. Why would I do this?
- You can see where there might be fold, velocity or other issues related to topography.
- You can immediately see the polarity of the data.
- You could use the bandwidth of the data to make the pseudo-reflector, giving a visual hint to the interpreter.
- Keeping track of amplitude adjustments and phase rotations would be self-documenting and reversible.
- you could autotrack it to get a topographic map (or just get this from the processor).
- It looks cool!

Seismic profile with ground level SYNTHETICALLY SLAPPED ON TOP. Bandlimited, of course, so you can Autotrack till your hearts content!
I've deliberately constructed a band-limited reflection, opposed to placing a sharp spike at ground-level. The problem with a spike is that it has infinite bandwidth. It contains higher frequencies than the image, so as Carl Reine commented on that last post, that might not play nice with seismic attributes. Also, there's the problem of selecting an amplitude value to assign to the spike: we don't want to introduce amplitudes that are ridiculously out of range of the existing data.
The whole image
I hereby propose that this synthetic ground level trick adopted as the new standard for any land seismic processing and interpretation. The great thing is, it can be done just as easily by interpreters and seismic data technologists, as by the processing companies that create the rest of the image. I realize we're adding stuff to the data that isn't actually signal. We do non-real things to signals all the time. The question is, do the benefits outweigh the artificiality?
Here's the view of the entire section:

The whole section, ground level included.
The details of this exercise can be found in the this Jupyter Notebook.
References
The seismic is line 36_77_PR from the USGS data repository.
SEG Y rev 2 Data Exchange Format. SEG Technical Standards Committee. Draft 2.0, January, 2015.


 Except where noted, this content is licensed