Quantifying the earth
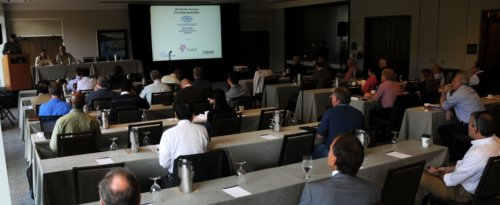
/ I am in Avon, Colorado, this week attending the SEG IQ Earth Forum. IQ (integrative and quantitative) Earth is a new SEG committee formed in reponse to a $1M monetary donation by Statoil to build a publicly available, industrial strength dataset for the petroleum community. In addition to hosting a standard conference format of podiums and Q and A's, the SEG is using the forum to ask delegates for opinions on how to run the committee. There are 12 people in attendance from consulting & software firms, 11 from service companies, 13 who work for operators, and 7 from SEG and academia. There's lively discussionafter each presentation, which has twice been cut short by adherence to the all important 2 hour lunch break. That's a shame. I wish the energy was left to linger. Here is a recap of the talks that have stood out for me so far:
Yesterday, Peter Wang from WesternGeco presented 3 mini-talks in 20 minutes showcasing novel treatments of uncertainty. In the first talk he did a stochastic map migration of 500 equally probable anisotropic velocity models that translated a fault plane within a 800 foot lateral uncertainty corridor. The result was even more startling on structure maps. Picking a single horizon or fault is wrong, and he showed by how much. Secondly, he showed a stocastic inversion using core, logs and seismic. He again showed the results of hundreds of non-unique but equally probable inversion realizations, each exactly fit the well logs. His point: one solution isn't enough. Only when we compute the range of possible answers can we quantify risk and capture our unknowns. Third, he showed an example from a North American resource shale, a setting where seismic methods are routinely under-utilized, and ironically, a setting where 70% of the production comes from less than 30% of the completed intervals. The geomechanical facies classification showed compelling frac barriers and non reservoir classes, coupled to an all-important error cube, showing the probability of each classification, the confidence of the method.
Ron Masters, from a software company called Headwave, presented a pre-recorded video demonstration of his software in action. Applause goes to him for a pseudo-interactive presentation. He used horizons as a boundary for scuplting away peripheral data for 3D AVO visualizations. He demostrated the technique of rotating a color wheel in the intercept-gradient domain, such that any and all linear combinations of AVO parameters can be mapped to a particular hue. No more need for hard polygons. Instead, with gradational crossplot color classes, the AVO signal doesn't get suddenly clipped out, unless there is a real change in fluid and lithology effects. Exposing AVO gathers in this interactive environment guards against imposing false distinctions that aren’t really there.
 The session today consisted of five talks from WesternGeco / Schlumberger, a powerhouse of technology who stepped up to show their heft. Their full occupancy of the podium today, gives a new meaning to the rhyming quip; all-day Schlumberger. Despite having the bias of an internal company conference, it was still very entertaining, and informative.
Andy Hawthorn showed how seismic images can be re-migrated around the borehole (almost) in real time by taking velocity measurements while drilling. The new measurements help drillers adjust trajectories and mud weights entering hazardous high pressure which has remarkable safety and cost benefits. He showed a case where a fault was repositioned by 1000 vertical feet; huge implications for wellbore stability, placing casing shoes, and other such mechanical considerations. His premise is that the only problem worth our attention is the following: it is expensive to drill and produce wells. Science should not be done for the sake of it; but to build usable models for drillers.
In a characteristically enthusiastic talk, Ran Bachrach showed how he incorporated a compacting shale anisotropic rock physics model with borehole temperature and porosity measurements to expedite empirical hypothesis testing of imaging conditions. His talk, like many before him throughout the Forum, touched on the notion of generating many solutions, as fast as possible. Asking questions of the data, and being able to iterate.
At the end of the first day, Peter Wang stepped boldy back to the to the microphone while others has started packing their bags, getting ready to leave the room. He commented that what an "integrated and quantitative" earth model desperately needs are financial models and simulations. They are what drive this industry; making money. As scientists and technologists we must work harder to demonstrate the cost savings and value of these techniques. We aren't getting the word out fast enough, and we aren't as relevant as we could be. It's time to make the economic case clear.


 Except where noted, this content is licensed