
To plot a wavelet
/As I mentioned last time, a good starting point for geophysical computing is to write a mathematical function describing a seismic pulse. The IPython Notebook is designed to be used seamlessly with Matplotlib, which is nice because we can throw our function on graph and see if we were right. When you start your own notebook, type
ipython notebook --pylab inline
We'll make use of a few functions within NumPy, a workhorse to do the computational heavy-lifting, and Matplotlib, a plotting library.
import numpy as np
import matplotlib.pyplot as plt
Next, we can write some code that defines a function called ricker. It computes a Ricker wavelet for a range of discrete time-values t and dominant frequencies, f:
def ricker(f, length=0.512, dt=0.001):
    t = np.linspace(-length/2, (length-dt)/2, length/dt)
    y = (1.-2.*(np.pi**2)*(f**2)*(t**2))*np.exp(-(np.pi**2)*(f**2)*(t**2))
    return t, y
Here the function needs 3 input parameters; frequency, f, the length of time over which we want it to be defined, and the sample rate of the signal, dt. Calling the function returns two arrays, the time axis t, and the value of the function, y.
To create a 5 Hz Ricker wavelet, assign the value of 5 to the variable f, and pass it into the function like so,
f = 5
t, y = ricker (f)
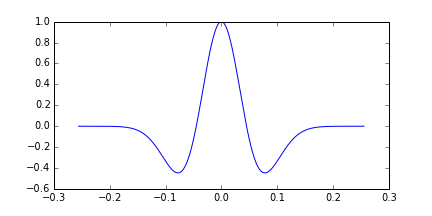
To plot the result,
plt.plot(t, y)
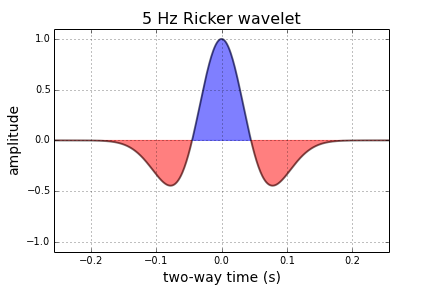
But with a few more commands, we can improve the cosmetics,
plt.figure(figsize=(7,4))
plt.plot( t, y, lw=2, color='black', alpha=0.5)
plt.fill_between(t, y, 0,  y > 0.0, interpolate=False, hold=True, color='blue', alpha = 0.5)
plt.fill_between(t, y, 0, y < 0.0, interpolate=False, hold=True, color='red', alpha = 0.5)

# Axes configuration and settings (optional)
plt.title('%d Hz Ricker wavelet' %f, fontsize = 16 )
plt.xlabel( 'two-way time (s)', fontsize = 14)
plt.ylabel('amplitude', fontsize = 14)
plt.ylim((-1.1,1.1))
plt.xlim((min(t),max(t)))
plt.grid()
plt.show()
Next up, we'll make this wavelet interact with a model of the earth using some math. Let me know if you get this up and running on your own.
Let's do it
It's short notice, but I'll be in Calgary again early in the new year, and I will be running a one-day version of this new course. To start building your own tools, pick a date and sign up:


 Except where noted, this content is licensed