New virtual training for digital geoscience

Looking to skill up before 2022 hits us with… whatever 2022 is planning? We have quite a few training classes coming up — don’t miss out! Our classes use 100% geoscience data and examples, and are taught exclusively by earth scientists.

We’re also always happy to teach special classes in-house for you and your colleagues. Just get in touch.

Special classes for CSEG in Calgary

Public classes with timing for Americas

  • Geocomputing: week of 22 November

  • Machine Learning: week of 6 December

Public classes with timing for Europe, Africa and Middle East

  • Geocomputing: week of 27 September

  • Machine Learning: week of 8 November

So far we’ve taught 748 people on the Geocomputing class, and 445 on the Machine Learning class — this wave of new digital scientists is already doing fascinating new work and publishing new research. I’m very excited to see what unfolds over the next year or two!

Find out more about Agile’s public classes by clicking this big button:

The hot rock hack is back

shirt_skull.png

Last year we ran the first ever Geothermal Hackathon. As with all things, we started small, but energetic: fourteen of us worked on six projects. Topics ranged from project management to geological mapping to natural language processing. It was a fun two days not thinking about coronavirus.

This year we’ll be meeting up on Thursday 13 and Friday 14 May, starting right after the Geoscience Virtual Event of the World Geothermal Congress. Everyone is invited — geoscientists, engineers, data nerds, programmers. No experience of geothermal is necessary, just creativity and curiosity.

Projects are already being discussed on the Software Underground; here are some of the ideas:

  • Data-munging project for Utah Forge, especially well 58-32.

  • Update the Awesome list Thomas Martin started last year.

  • Implementing classic, or newly published, equations and algorthims from the literature.

I expect the preceeding WGC event will spark some last-minute projects too. But for the time being, you’re welcome to add or vote on ideas on the event page. What tools or visualizations would you find useful?


Build some digital geo skills

📣 If you’re looking to build up your coding skills before the hackathon — or for a research project or an idea at work — join us for a Python class. We teach the fundamentals of Python, NumPy and matplotlib using geological and geophysical examples and geo-familiar datasets. There are two classes coming up in May (Digital Geology) and June (Digital Geophysics).

Future proof

Last week I wrote about the turmoil many subsurface professionals are experiencing today. There’s no advice that will work for everyone, but one thing that changed my life (ok, my career at least) was learning a programming language. Not only because programming computers is useful and fun, but also because of the technology insights it brings. Whether you’re into data management or machine learning, workflow automation or just being a more rounded professional, there really is no faster way to build digital muscles!

learn_python_thumb_2.png

Six classes

We have six public classes coming up in the next few weeks. But there are thousands of online and virtual classes you can take — what’s different about ours? Here’s what I think:

  • All of the instructors are geoscientists, and we have experience in sedimentology, geophysics, and structural geology. We’ve been programming in Python for years, but we remember how it felt to learn it for the first time.

  • We refer to subsurface data and typical workflows throughout the class. We don’t use abstract or unfamiliar examples. We focus 100% on scientific computing and data visualization. You can get a flavour of our material from the X Lines of Python blog series.

  • We want you to be self-sufficient, so we give you everything you need to start being productive right away. You’ll walk away with the full scientific Python stack on your computer, and dozens of notebooks showing you how to do all sorts of things from loading data to making a synthetic seismogram.

Let’s look at what we have on offer.

python_examples.png

Upcoming classes

We have a total of 6 public classes coming up, in two sets of three classes: one set with timing for North, Central and South America, and one set with timing for Europe, Africa, and the Middle East. Here they are:

  • Intro to Geocomputing, 5 half-days, 15–19 Feb — 🌎 Timing for Americas — 🌍 Timing for Europe & Africa — If you’re just getting started in scientific computing, or are coming to Python from another language, this is the class for you. No prerequisites.

  • Digital Geology with Python, 4 half-days, 22–25 Feb — 🌍 Timing for Europe & Africa — A closer look at geological workflows using Python. This class is for scientists and engineers with some Python experience.

  • Digital Geophysics with Python, 4 half-days, 22–25 Feb — 🌎 Timing for Americas — We get into some geophysical workflows using Python. This class is for quantitative scientists with some Python experience.

  • Machine Learning for Subsurface, 4 half-days in March — 🌎 Timing for Americas (1–4 Mar) — 🌍 Timing for Europe & Africa (8–11 Mar) — The best way into machine learning for earth scientists and subsurface engineers. We give you everything you need to manage your data and start exploring the world of data science and machine learning.

Follow the links above to find out more about each class. We have space for 14 people in each class. You find pricing options for students and those currently out of work. If you are in special circumstances, please get in touch — we don’t want price to be a barrier to these classes.

In-house options

If you have more than about 5 people to train, it might be worth thinking about an in-house class. That way, the class is full of colleagues learning things together — they can speak more openly and share more freely. We can also tailor the content and the examples to your needs more easily.

Get in touch if you want more info about this approach.

Training and hackathons are moving online

A while back, I announced that we’re running some public courses in June. These courses will now be online.

They have also decreased in price by 33% because we don’t need a physical space or physical sandwiches. So the 3-day Intro to Geocomputing class now costs only USD 1200 (or $300 for students). The 2-day Intro to Machine Learning class, which is only available on the Americas timing for now, is USD 800, or USD 600 if you take both classes.

The really nice thing is that because they have no physical location, you can take part from anywhere! Well, anywhere with good Internet. Both courses are still running the week of 1 June, and there are a few places left on both courses.

More info:

The hackathons are going online too

We’re also involved in some public hackathons that are moving online. Both events will now also be FREE.

On 30 April and 1 May, we’re running a (very experimental) online Geothermal Hackathon. If you’re into hot rocks, or just want to hack on open data and new problems for a couple of days, you should join us! I can’t tell you much about what we’ll be doing though. It depends a lot on who shows up at the start, and what they want to do. You can join the conversation ahead of time on Software Underground — look for the #geothermal channel.

Later, from 6 to 14 June (yep, not a typo) the Software Underground will be hosting a multi-day, muti-modal, multi-mayhem digital subsurface festival. No, I don’t really know what that means… but I know it’s going to be awesome. Again, the conversation is happening on Software Underground — hunt down the #global-hack-2020 channel.

Check back here soon for more about this brand new kind of event.

Learn to code in 2020

Happy New Year! I hope 2020 is going well so far and that you have audacious plans for the new decade.

Perhaps among your plans is learning to code — or improving your skills, if you’re already on the way. As I wrote in 2011, programming is more than just writing code: it’s about learning a new way to think, not just about data but about problems. It’s also a great way to quickly raise your digital literacy — something most employers value more each year. And it’s fun.

We have three public courses planned for 2020. We’re also planning some public hackathons, which I’ll write about in the next week or three. Meanwhile, here’s the lowdown on the courses:

Lausanne in March

Rob Leckenby will be teaming up with Valentin Metraux of Geo2X to teach this 3-day class in Lausanne, Switzerland. We call it Intro to Geocomputing and it’s 100% suitable for beginners and people with less than a year or so of experience in Python. By the end, you’ll be able to read and write Python, write functions, read files, and run Jupyter Notebooks. More info here.

Amsterdam in June

If you can’t make it to Lausanne, we’ll be repeating the Intro to Geocomputing class in Amsterdam, right before the Software Underground’s Amstel Hack hackathon event (and then the EAGE meeting the following week). Check out the Software Underground Slack — look for the #amstel-hack-2020 channel — to find out more about the hackathon. More info here.

Houston in June

There’s also a chance to take the class in the US. The week before AAPG (which clashes with EAGE this year, which is very weird), we’ll be teaching not one but two classes: Intro to Geocomputing, and Intro to Machine Learning. You can take either one, or both — but be aware that the machine learning class assumes you know the basics of Python and NumPy. More info here.

In-house options

We still teach in-house courses (last year we taught 37 of them!). If you have more than about 5 people to train, then in-house is probably the way to go; we’d be delighted to work with you to figure out the best curriculum for your team.

Most of our classes fall into one of the following categories:

  • Beginner classes like the ones described above, usually 3 days.

  • Machine learning classes, like the Houston class above, usually 2 or 3 days.

  • Other more advanced classes built around engineering skills (object-oriented programming, testing, packaging, and so on), usually 3 days.

  • High-level digital literacy classes for middle to upper management, usually 1 day.

We also run hackathons and design sprints for teams that are trying to solve tricky problems in the digital subsurface, but those are another story…

Get in touch if you want more info about any of these.


Whatever you want to learn in 2020, give it everything you have. Schedule time for it. The discipline will pay off. If we can help or support you somehow, please let us know — above all, we want you to succeed.

Lots of news!

I can't believe it's been a month since my last post! But I've now recovered from the craziness of the spring — with its two hackathons, two conferences, two new experiments, as well as the usual courses and client projects — and am ready to start getting back to normal. My goal with this post is to tell you all the exciting stuff that's happened in the last few weeks.

Meet our newest team member

There's a new Agilist! Robert Leckenby is a British–Swiss geologist with technology tendencies. Rob has a PhD in Dynamic characterisation and fluid flow modelling of fractured reservoirs, and has worked in various geoscience roles in large and small oil & gas companies. We're stoked to have him in the team!

Rob lives near Geneva, Switzerland, and speaks French and several other human languages, as well as Python and JavaScript. He'll be helping us develop and teach our famous Geocomputing course, among other things. Reach him at robert@agilescientific.com.

Rob.png

Geocomputing Summer School

We have trained over 120 geoscientists in Python so far this year, but most of our training is in private classes. We wanted to fix that, and offer the Geocomputing class back for anyone to take. Well, anyone in the Houston area :) It's called Summer School, it's happening the week of 13 August, and it's a 5-day crash course in scientific Python and the rudiments of machine learning. It's designed to get you a long way up the learning curve. Read more and enroll. 


A new kind of event

We have several more events happening this year, including hackathons in Norway and in the UK. But the event in Anaheim, right before the SEG Annual Meeting, is going to be a bit different. Instead of the usual Geophysics Hackathon, we're going to try a sprint around open source projects in geophysics. The event is called the Open Geophysics Sprint, and you can find out more here on events.agilescientific.com.

That site — events.agilescientific.com — is our new events portal, and our attempt to stay on top of the community events we are running. Soon, you'll be able to sign up for events on there too (right now, most of them are still handled through Eventbrite), but for now it's at least a place to see everything that's going on. Thanks to Diego for putting it together!

A new blog, and a new course

There's a great new geoscience blog on the Internet — I urge you to add it to your blog-reading app or news reader or list of links or whatever it is you use to keep track of these things. It's called Geology and Python, and it contains exactly what you'd expect it to contain!

The author, Bruno Ruas de Pinho, has nine posts up so far, all excellent. The range of topics is quite broad:

In each post, Bruno takes some geoscience challenge — nothing too huge, but the problems aren't trivial either — and then methodically steps through solving the problem in Python. He's clearly got a good quantitative brain, having recently graduated in geological engineering from the Federal University of Pelotas, aka UFPel, Brazil, and he is now available for hire. (He seems to be pretty sharp, so if you're doing anything with computers and geoscience, you should snag him.)


A new course for Calgary

We've run lots of Introduction to Python courses before, usually with the name Creative Geocomputing. Now we're adding a new dimension, combining a crash introduction to Python with a crash introduction to machine learning. It's ambitious, for sure, but the idea is not to turn you into a programmer. We aim to:

  • Help you set up your computer to run Python, virtual environments, and Jupyter Notebooks.
  • Get you started with downloading and running other people's packages and notebooks.
  • Verse you in the basics of Python and machine learning so you can start to explore.
  • Set you off with ideas and things to figure out for that pet project you've always wanted to code up.
  • Introduce you to other Calgarians who love playing with code and rocks.

We do all this wielding geoscientific data — it's all well logs and maps and seismic data. There are no silly examples, and we don't shy away from so-called advanced things — what's the point in computers if you can't do some things that are really, really hard to do in your head?

Tickets are on sale now at Eventbrite, it's $750 for 2 days — including all the lunch and code you can eat.

A coding kitchen in Stavanger

Last week, I travelled to Norway and held a two day session of our Agile Geocomputing Training. We convened at the newly constructed Innovation Dock in Stavanger, and set up shop in an oversized, swanky kitchen. Despite the industry-wide squeeze on spending, the event still drew a modest turnout of seven geoscientists. That's way more traction then we've had in North America lately, so thumbs up to Norway! And, since our training is designed to be very active, a group of seven is plenty comfortable. 

A few of the participants had some prior experience writing code in languages such as Perl, Visual Basic, and C, but the majority showed up without any significant programming experience at all. 

Skills start with syntax and structures 

The first day we covered basic principles or programming, but because Python is awesome, we dive into live coding right from the start. As an instructor, I find that doing live coding has two hidden benefits: it stops me from racing ahead, and making mistakes in the open gives students permission to do the same. 

Using geoscience data right from the start, students learn about key data structures: lists, dicts, tuples, and sets, and for a given job, why they might chose between them. They wrote their own mini-module containing functions and classes for getting stratigraphic tops from a text file. 

Since syntax is rather dry and unsexy, I see the instructor's main role to inspire and motivate through examples that connect to things that learners already know well. The ideal containers for stratigraphic picks is a dictionary. Logs, surfaces, and seismic, are best cast into 1-, 2, and 3-dimensional NumPy arrays, respectively. And so on.

Notebooks inspire learning

We've seen it time and time again. People really like the format of Jupyter Notebooks (formerly IPython Notebooks). It's like there is something fittingly scientific about them: narrative, code, output, repeat. As a learning document, they aren't static — in fact they're meant to be edited. But they aren't so open-ended that learners fail to launch. Professional software developers may not 'get it', but scientists really subscribe do. Start at the start, end at the end, and you've got a complete record of your work. 

You don't get that with the black-box, GUI-heavy software applications we're used to. Maybe, all legitimate work should be reserved for notebooks: self-contained, fully-reproducible, and extensible. Maybe notebooks, in their modularity and granularity, will be the new go-to software for technical work.

Outcomes and feedback

By the end of day two, folks were parsing stratigraphic and petrophysical data from text files, then rendering and stylizing illustrations. A few were even building interactive animations on 3D seismic volumes.  One recommendation was to create a sort of FAQ or cookbook: "How do I read a log?", "How do I read SEGY?", "How do I calculate elastic properties from a well log?". A couple of people of remarked that they would have liked even more coached exercises, maybe even an extra day; a recognition of the virtue of sustained and structured practice.


Want training too?

Head to our courses page for a list of upcoming courses, or more details on how you can train your team


Photographs in this post are courtesy of Alessandro Amato del Monte via aadm on Flickr

Corendering attributes and 2D colourmaps

The reason we use colourmaps is to facilitate the human eye in interpreting the morphology of the data. There are no hard and fast rules when it comes to choosing a good colourmap, but a poorly chosen colourmap can make you see features in your data that don't actually exist. 

Colourmaps are typically implemented in visualization software as 1D lookup tables. Given a value, what colour should I plot it? But most spatial data is multi-dimensional, and it's useful to look at more than one aspect of the data at one time. Previously, Matt asked, "how many attributes can a seismic interpreter show with colour on a single display?" He did this by stacking up a series of semi-opaque layers, each one assigned its own 1D colourbar. 

Another way to add more dimensions to the display is corendering. This effectively adds another dimension to the colourmap itself: instead of a 1D colour line for a single attribute, for two attributes we're defining a colour square; for 3 attributes, a colour cube, and so on.

Let's illustrate this by looking at a time-slice through a portion of the F3 seismic volume. A simple way of displaying two attributes is to decrease the opacity of one, and lay it on top of the other. In the figure below, I'm setting the opacity of the continuity to 75% in the third panel. At first glance, this looks pretty good; you can see both attributes, and because they have different hues, they complement each other without competing for visual bandwidth. But the approach is flawed. The vividness of each dataset is diminished; we don't see the same range of colours as we do in the colour palette shown above.

Overlaying one map on top of the other is one way to look at multiple attributes within a scene. It's not ideal however.

Overlaying one map on top of the other is one way to look at multiple attributes within a scene. It's not ideal however.

Instead of overlaying maps, we can improve the result by modulating the lightness of the amplitude image according to the magnitude of the continuity attribute. This time the corendered result is one image, instead of two. I prefer it, because it preserves the original colours we see in the amplitude image. If anything, it seems to deepen the contrast:

The lightness value of the seismic amplitude time slice has been modulated by the continuity attribute. 

The lightness value of the seismic amplitude time slice has been modulated by the continuity attribute. 

Such a composite display needs a two-dimensional colormap for a legend. Just as a 1D colourbar, it's also a lookup table; each position in the scene corresponds to a unique pair of values in the colourmap plane.

We can go one step further. Say we want to emphasize only the largest discontinuities in the data. We can modulate the opacity with a non-linear function. In this example, I'm using a sigmoid function:

In order to achieve this effect in most conventional software, you usually have to copy the attribute, colour it black, apply an opacity curve, then position it just above the base amplitude layer. Software companies call this workaround a 'workflow'. 

Are there data visualizations you want to create, but you're stuck with software limitations? In a future post, I'll recreate some cool co-rendering effects; like bump-mapping, and hill-shading.

To view and run the code that I used in creating the images for this post, grab the iPython/Jupyter Notebook.


You can do it too!

If you're in Calgary, Houston, New Orleans, or Stavanger, listen up!

If you'd like to gear up on coding skills and explore the benefits of scientific computing, we're going to be running the 2-day version of the Geocomputing Course several times this fall in select cities. To buy tickets or for more information about our courses, check out the courses page.

None of these times or locations good for you? Consider rounding up your colleagues for an in-house training option. We'll come to your turf, we can spend more than 2 days, and customize the content to suit your team's needs. Get in touch.

How much rock was erupted from Mt St Helens?

One of the reasons we struggle when learning a new skill is not necessarily because this thing is inherently hard, or that we are dim. We just don't yet have enough context for all the connecting ideas to, well, connect. With this in mind I wrote this introductory demo for my Creative Geocomputing class, and tried it out in the garage attached to START Houston, when we ran the course there a few weeks ago.

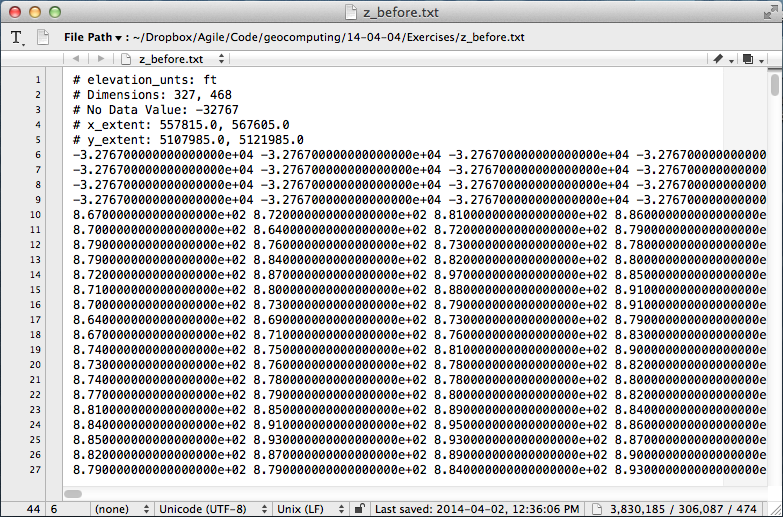
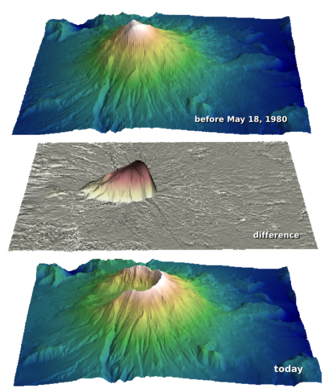
I walked through the process of transforming USGS text files to data graphics. The motivation was to try to answer the question: How much rock was erupted from Mount St Helens?

This gorgeous data set can be reworked to serve a lot of programming and data manipulation practice, and just have fun solving problems. My goal was to maintain a coherent stream of instructions, especially for folks who have never written a line of code before. The challenge, I found, is anticipating when words, phrases, and syntax are being heard like a foriegn language (as indeed they are), and to cope by augmenting with spoken narrative.

Text file to 3D plot

To start, we'll import a code library called NumPy that's great for crunching numbers, and we'll abbreviate it with the nickname np:

>>> import numpy as np

Then we can use one of its functions to load the text file into an array we'll call data:

>>> data = np.loadtxt('z_after.txt')

The variable data is a 2-dimensional array (matrix) of numbers. It has an attribute that we can call upon, called shape, that holds the number of elements it has in each dimension,

>>> data.shape
(1370, 949)

If we want to make a plot of this data, we might want to take a look at the range of the elements in the array, we can call the peak-to-peak method on data,

>>> data.ptp()
41134.0

Whoa, something's not right, there's not a surface on earth that has a min to max elevation that large. Let's dig a little deeper. The highest point on the surface is,

>>> np.amax(data)
8367.0

Which looks to the adequately trained eye like a reasonable elevation value with units of feet. Let's look at the minimum value of the array,

>>> np.amin(data)
-32767.0 

OK, here's the problem. GIS people might recognize this as a null value for elevation data, but since we aren't assuming any knowledge of GIS formats and data standards, we can simply replace the values in the array with not-a-number (NaN), so they won't contaminate our plot.

>>> data[data==-32767.0] = np.nan

To view this surface in 3D we can import the mlab module from Mayavi

>>> from mayavi import mlab

Finally we call the surface function from mlab, and pass the input data, and a colormap keyword to activate a geographically inspired colormap, and a vertical scale coefficient.

>>> mlab.surf(data,
              colormap='gist_earth',
              warp_scale=0.05)

After applying the same procedure to the pre-eruption digits, we're ready to do some calculations and visualize the result to reveal the output and its fascinating characteristics. Read more in the IPython Notebook.

If this 10 minute introduction is compelling and you'd like to learn how to wrangle data like this, sign up for the two-day version of this course next week in Calgary. 

Eventbrite - Agile Geocomputing