H is for Horizon
/Seismic interpretation is done by crafting, extracting, or digitally drawing horizons across data, but what is a horizon anyway? Coming up with a definition of horizon is hard. So I have narrowed it down to three.
Data-centric: a matrix of discrete samples in x,y,z that can be stored in a 3-column ASCII file. As such, a horizon is something that can be unambiguously drawn on a map, and treated like a raster image. Some software tools even call attribute maps horizons, blurring the definition further. The data-centric horizon is devoid of geology, and of geophysics; it is an artifact of software.
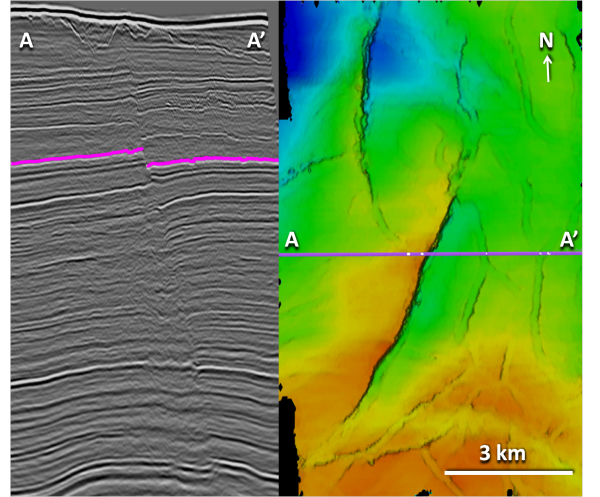
Geophysics-centric: an event, a reflection, in the seismic data; something you could pick with an automatic tracking tool. The quality is subject to the data itself. Change the data, or the processing, change the horizon. By this definition, a flat spot (a flattish reflection from a fluid contact) is a horizon, even though it's not stratigraphic. This type of horizon would be one of the inputs to instantaneous attribute analysis. The geophysics-centric horizon is still, in many ways, devoid of geology. It does not match your geological tops at the wells; it's not supposed to.
 Crossline 1241 (left), and geophysics-centric horizon (right) from the Penobscot 3D (Open Seismic Repository). Reds are highs and blues are lows.Geology-centric: a layer, a surface, an interface, in the earth, and its manifestation in the seismic data. It is the goal of seismic interpretation. In its purest form, it is unattainable: you can never know exactly where the horizon is in the subsurface. We do our best to construct it from wells, seismic, and imagination. Interestingly, because it is, to some degree, not consistent with the seismic reflections, it would not be possible to use the geology-centric horizon for instantaneous seismic attributes. It would match your well tops, if you could build it. But you can't.
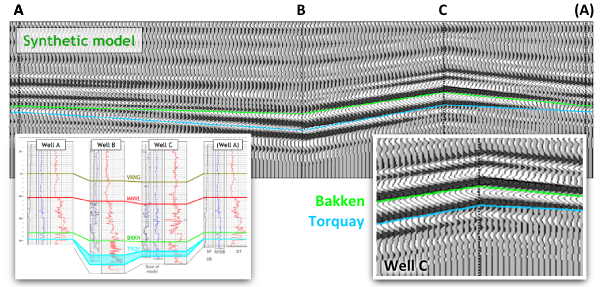
A four well model can help us illustrate this nuance. Geological tops have been correlated across these wells, and used as input to a seismic model to study the changes in thickness of the Bakken Formation (green to blue) interval.
 Four-well synthetic seismic model illustrating how a geological surface (green, blue) is not necessarily the same as a seismic reflection. From Hall & Trouillot (2004).
The synthetic model shows how the seismic character changes from well to well. Notice that a stratigraphic surface is not the same thing as a seismic event. The top Bakken (BKKN) pick is a peak-to-trough zero-crossing in the middle, and pinches out and tunes at either end. The top Torquay (TRQY), transitions from a trough, to a zero-crossing, and then to another trough.
This uncertainty is part of the integration gap. It is why building a predictive geologic model is so difficult to do. The word horizon can be a catch-all term; reckless to throw around. Instead, clearly communicate the definition of your horizon pick, it will prevent confusion for yourself and for other people who come in contact with it.
REFERENCE
Hall, M & E Trouillot (2004). Predicting stratigraphy with spectral decomposition. Canadian Society of Exploration Geophysicists annual conference, Calgary, May 2004.


 Except where noted, this content is licensed