Superpowers for striplogs

In between recent courses and hackathons, I’ve been chipping away at some new features in striplog. An open-source Python package, striplog handles irregularly sampled data, like lithologic intervals, chronostratigraphic zones, or anything that isn’t regularly sampled like, say, a well log. Instead of defining what is present at every depth location, you define intervals with a top and a base. The interval can contain whatever you like: names of rocks, images, or special core analyses, or anything at all.

You can read about all of the newer features in the changelog, but let’s look at a couple of the more interesting ones…

Binary morphology filters

Sometimes we’d like to simplify a striplog a bit, for example by ‘weeding out’ the thin beds. The tool has long had a method prune to systematically remove all intervals (e.g. beds) thinner than some cutoff; one can then optionally anneal the gaps, and merge the resulting striplog to combine similar neighbours. The result of this sequence of operations (prune, anneal, merge, or ‘PAM’) is shown below on the left.

striplog_binary_ops.png

If the intervals of a striplog have at least one property of a binary nature — with only two states, like sand and shale, or pay and non-pay — one can also use binary morphological operations. This well-known image processing technique aims to simplify data by eliminating small things. The result of opening vs closing operations is shown above.

Markov chains

I wrote about Markov chains earlier this year; they offer a way to identify bias in the order of units in a stratigraphic column. I’ve now put all the code into striplog — albeit not in a very fancy way. You can import the Markov_chain class from striplog.markov, then use it in exactly the same way as in the notebook I shared in that Markov chain post:

I started with some pseudorandom data (top) representing a known succession of Mudstone (M), Siltstone (S), Fine Sandstone (F) and coarse sandstone (C). Then I generate a Markov chain model of the succession. The chi-squared test indicates that the succession is highly unlikely to be unordered. We can look at the normalized difference matrix, generate a synthetic sequence of lithologies, or plot the difference matrix as a heatmap or a directed graph. The graph illustrates the order we originally imposed: M-S-F-C.

There is one additional feature compared to the original implementation: multi-step Markov chains. Previously, I was only looking at immediately adjacent intervals (beds or whatever). Now you can look at actual vs expected transition frequencies for next-but-one interval, or next-but-two. Don’t ask me how to interpret that information though…

Other new things

  • New ways to anneal. Now the user can choose whether the gaps in the log are filled in by flooding upwards (that is, by extending the interval below the gap upwards), flooding downwards (extending the upper interval), or flooding symmetrically into the middle from both above and below, meeting in the middle. (Note, you can also fill gaps with another component, using the fill() method.)

  • New merging strategies. Now you can merge overlapping intervals by precedence, rather than by blending the contents of the intervals. Precedence is defined however you like; for example, you can choose to keep the thickest interval in all overlaps, or if intervals have a date, you could keep the latest interval.

  • Improved bar charts. The histogram is easier to use, and there is a new bar chart summary of intervals. The bars can be sorted by any property you like.

Try it out and help add new stuff

You can install the latest version of striplog using pip. It’s as easy as:

pip install striplog

Start by checking out the tutorial notebooks in the repo, especially Striplog_basics.ipynb. Let me know how you get on, or jump on the Software Underground Slack to ask for help.

Here are some things I’d like striplog to support in the future:

  • Stratigraphic prediction.

  • Well-to-well correlation.

  • More interactions with well logs.

What ideas do you have? Or maybe you can help define how these things should work? Either way, do get in touch or check out the Striplog repository on GitHub.

Woo yeah perfect: hacking in Salt Lake City

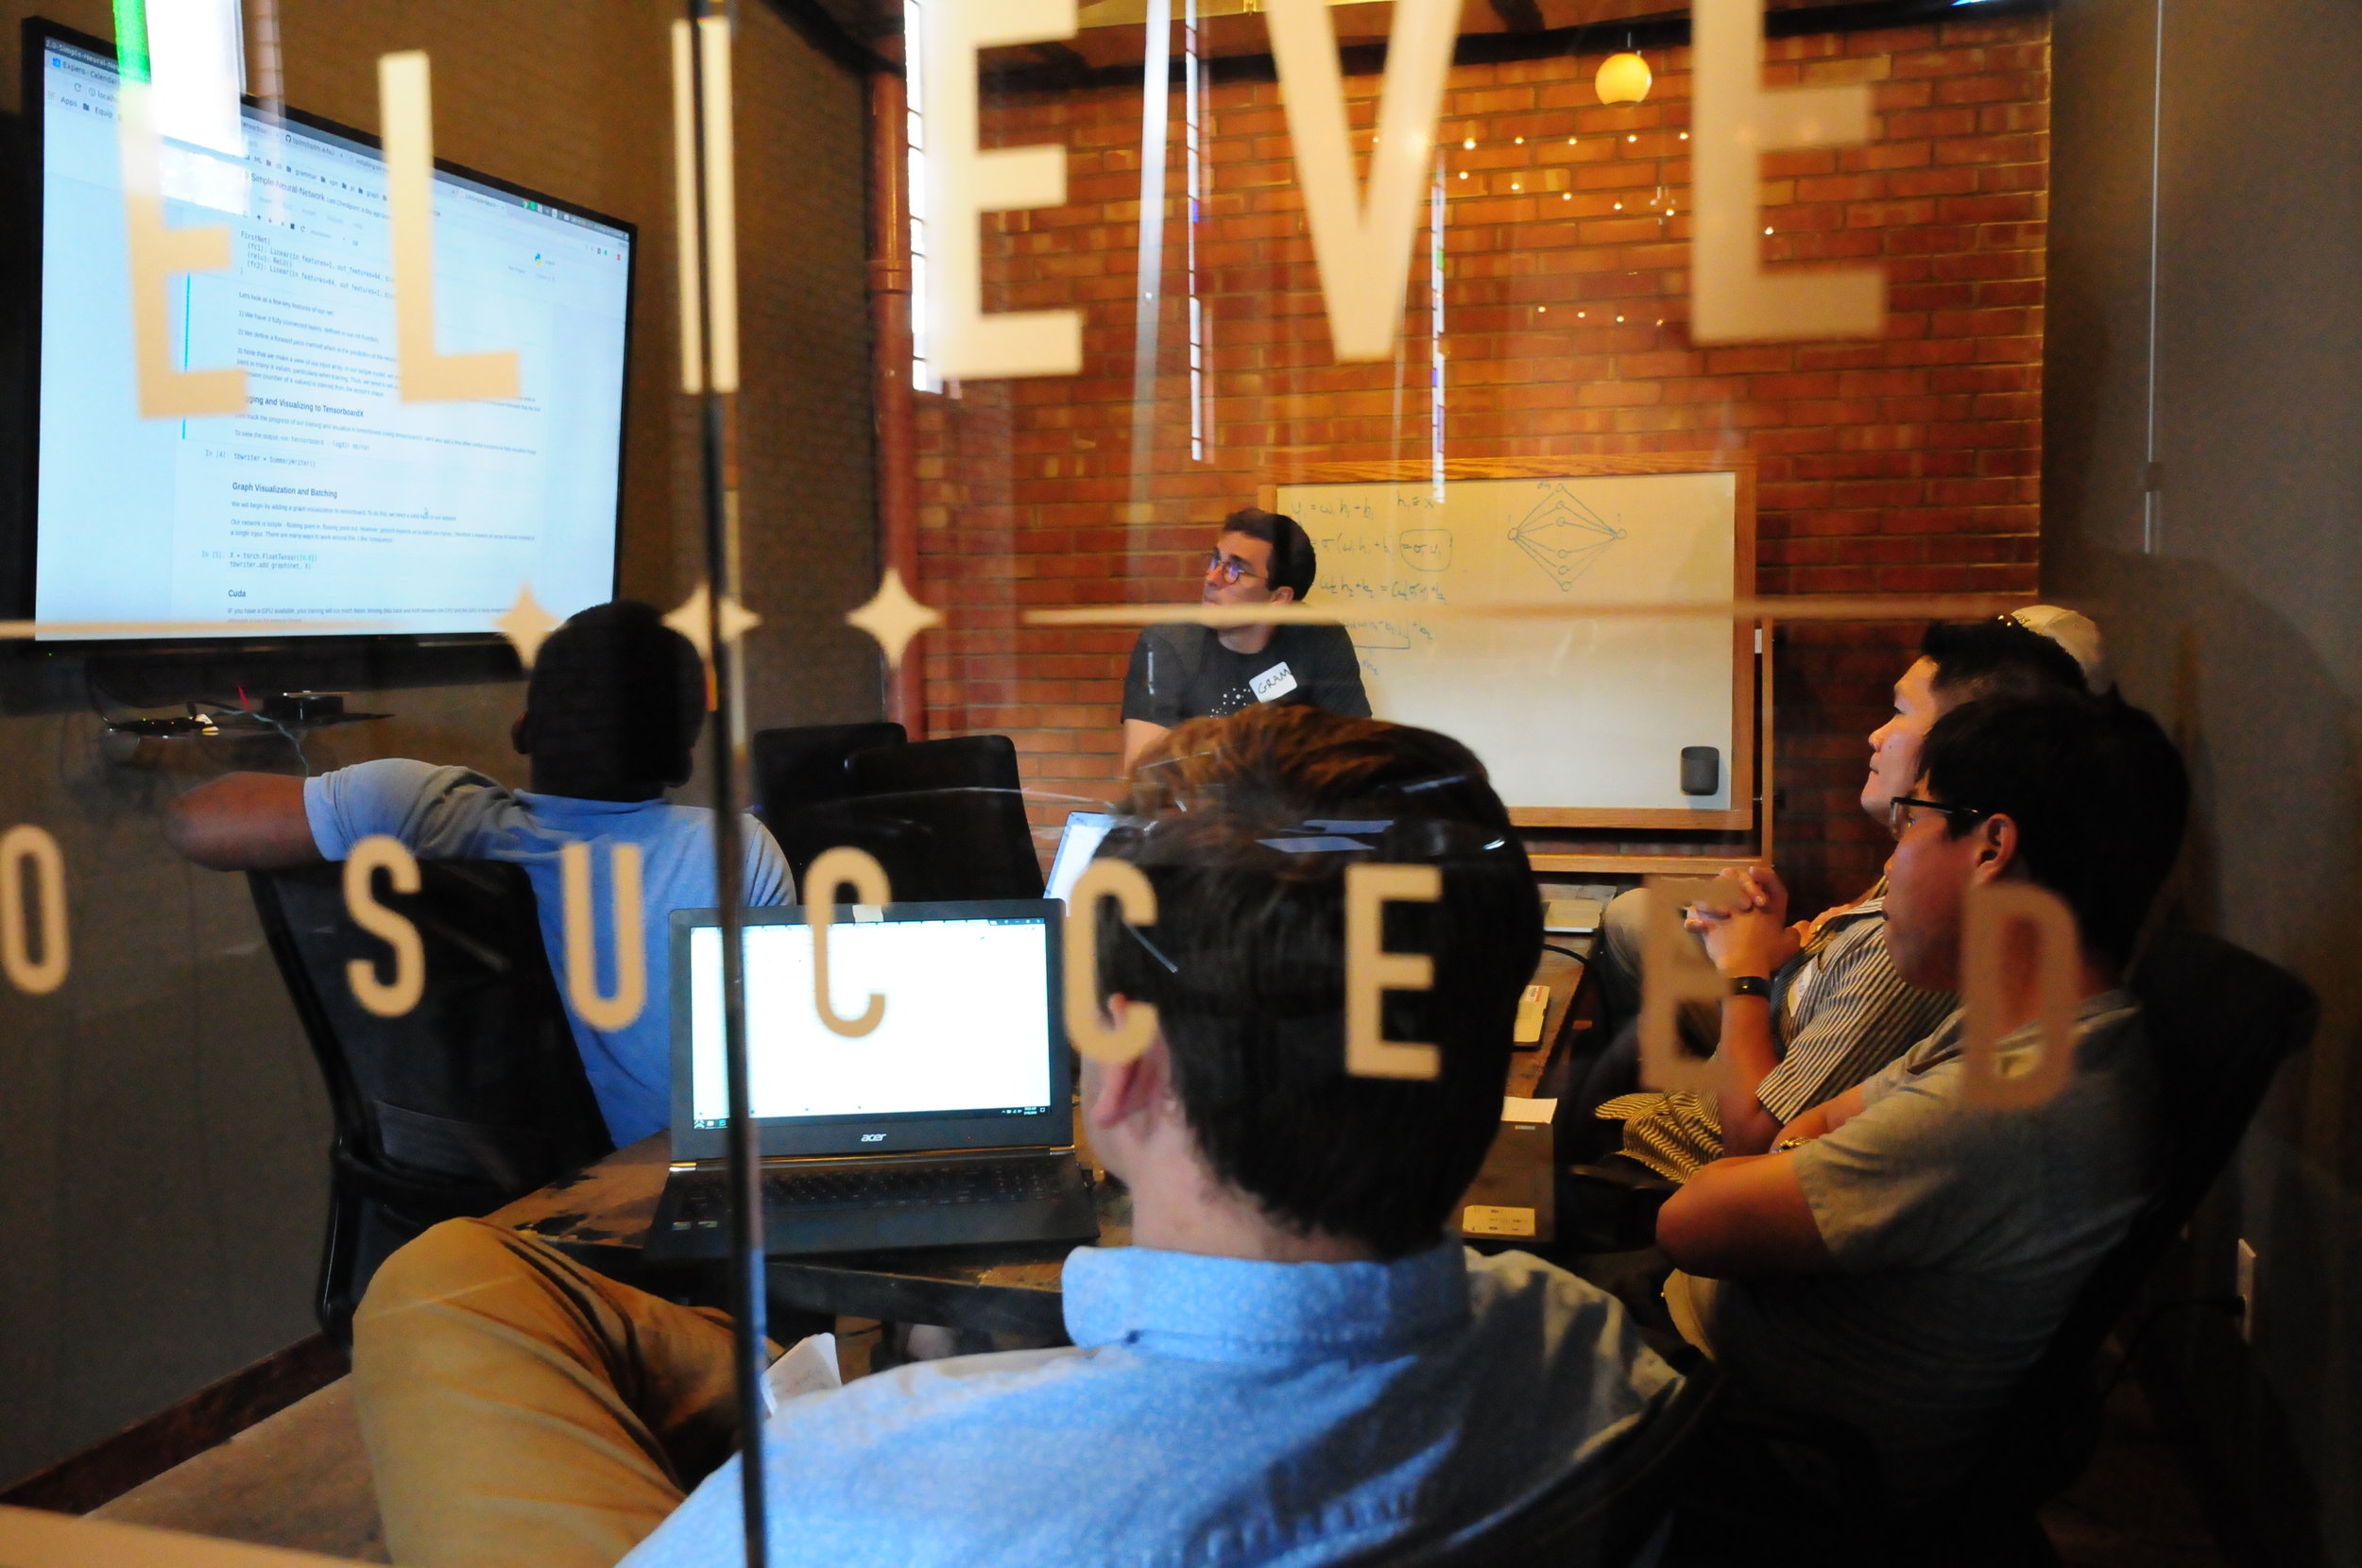
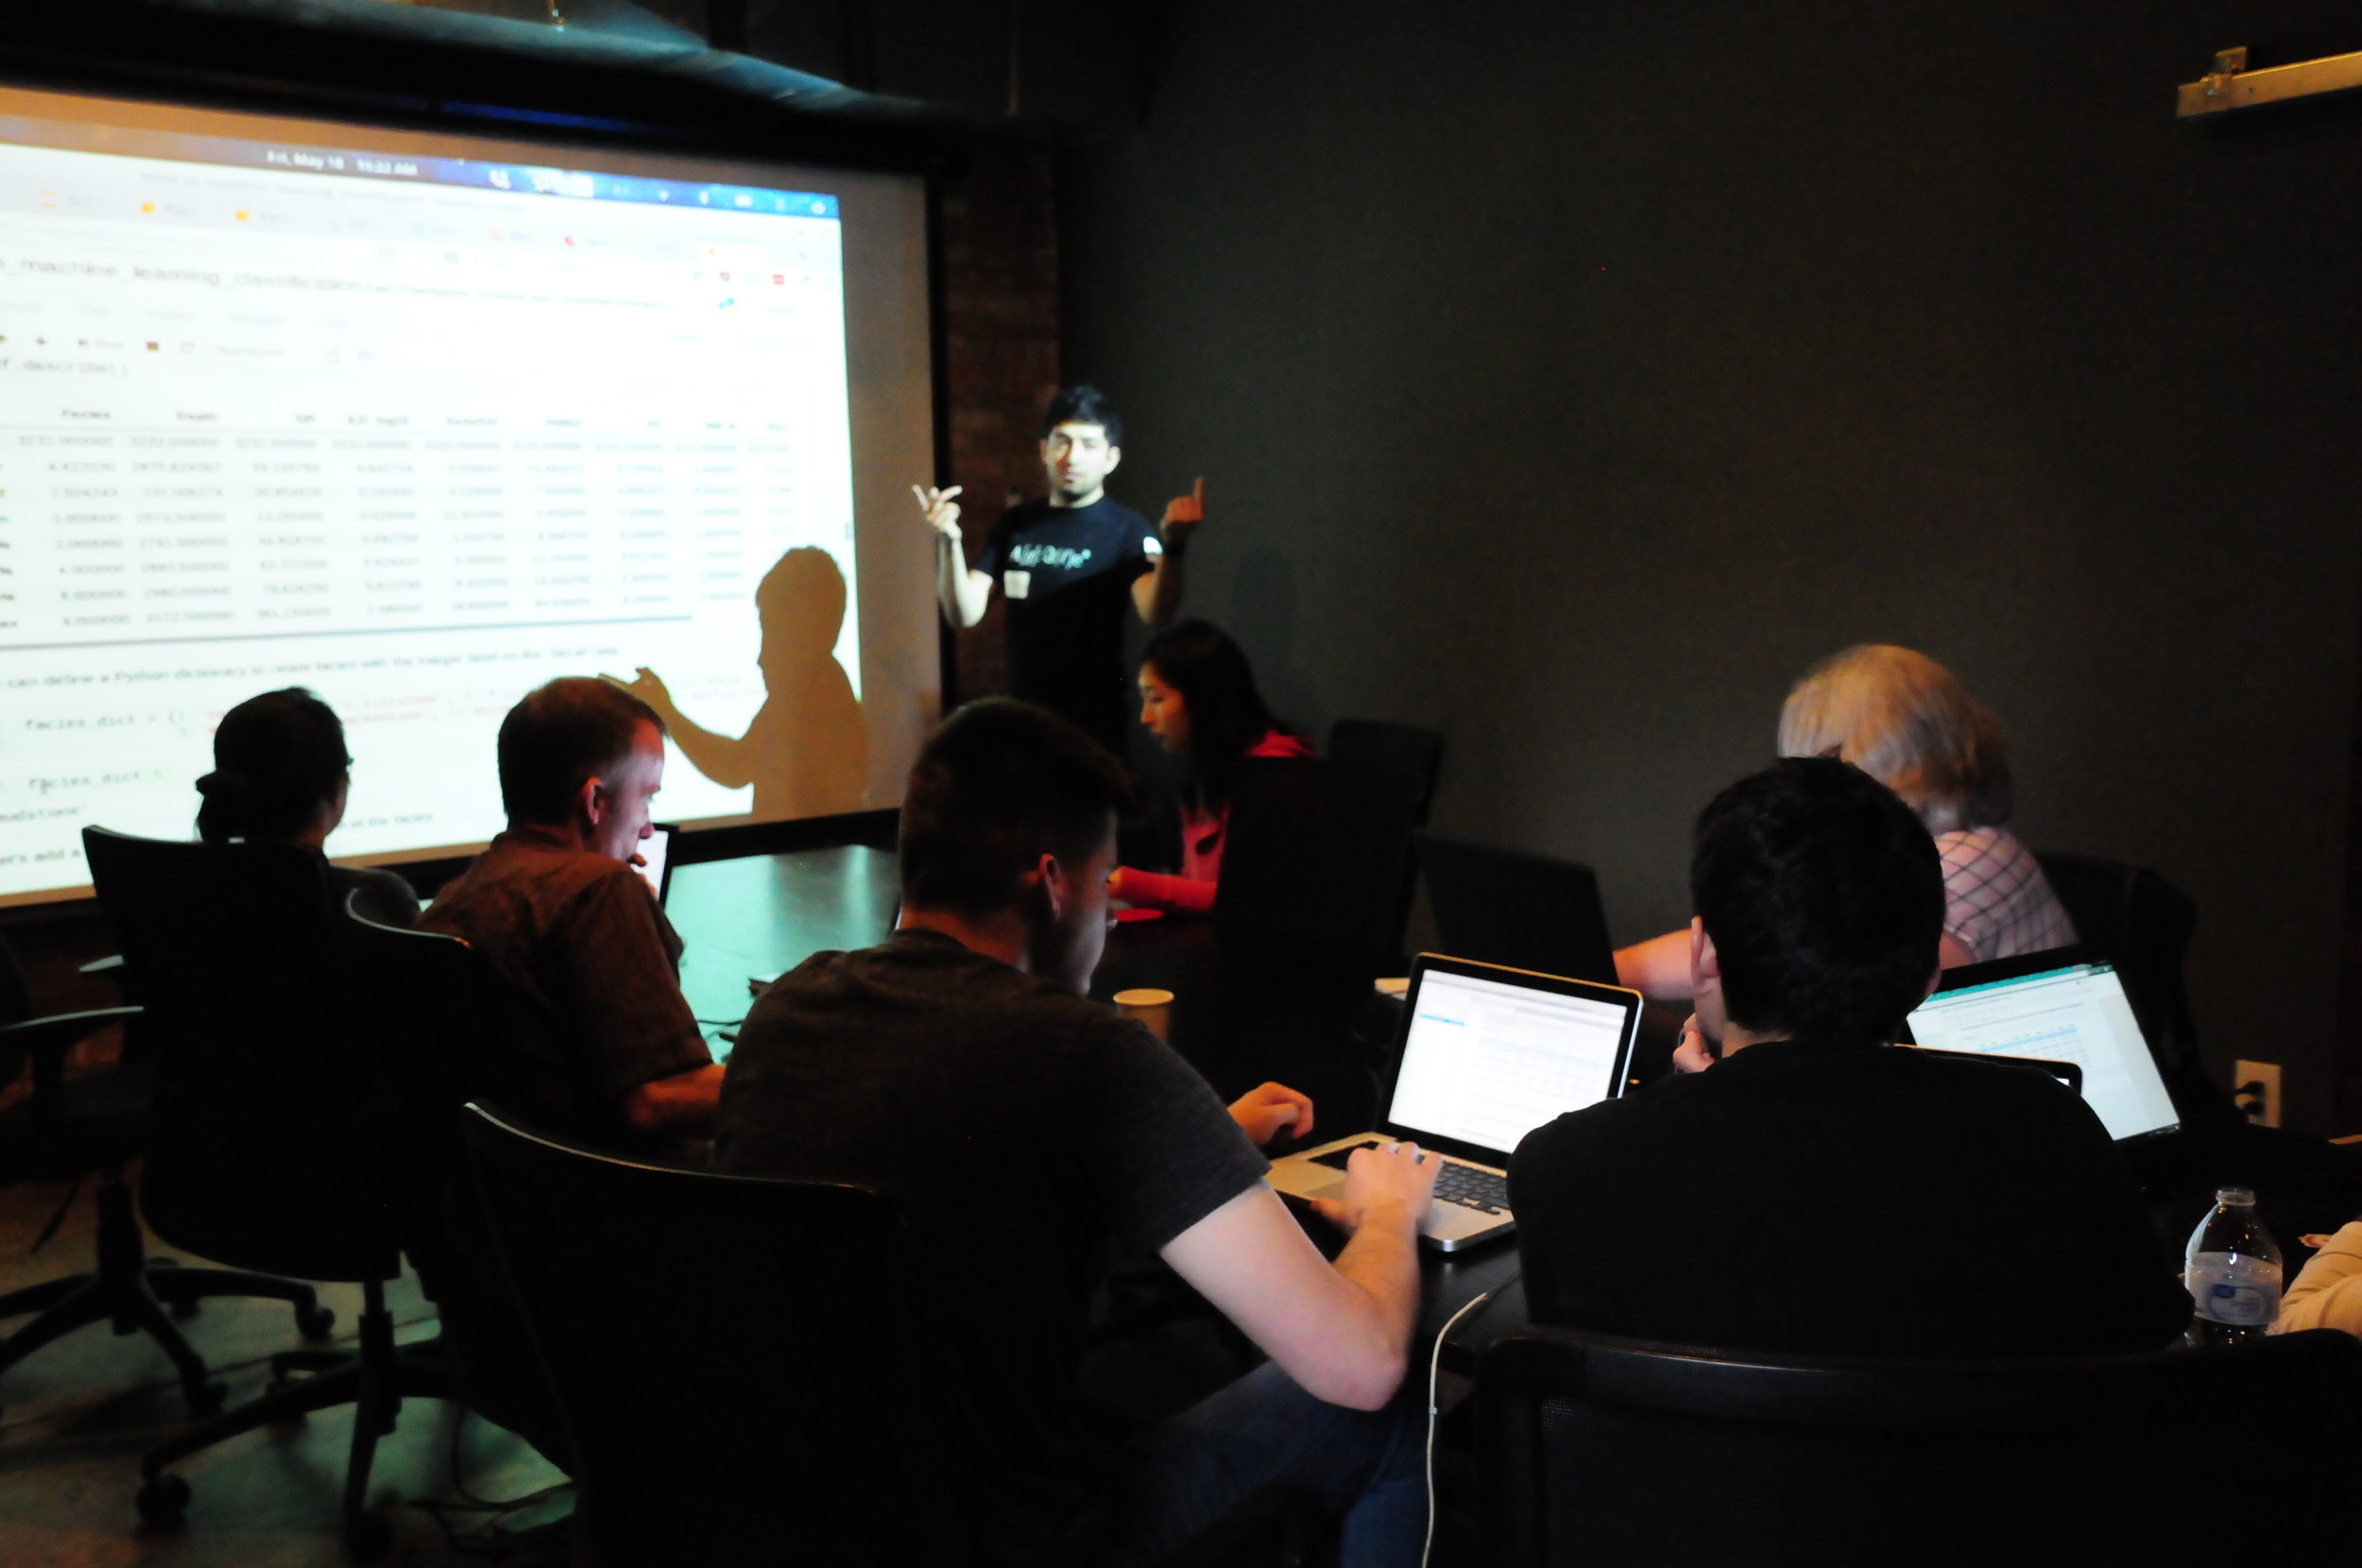
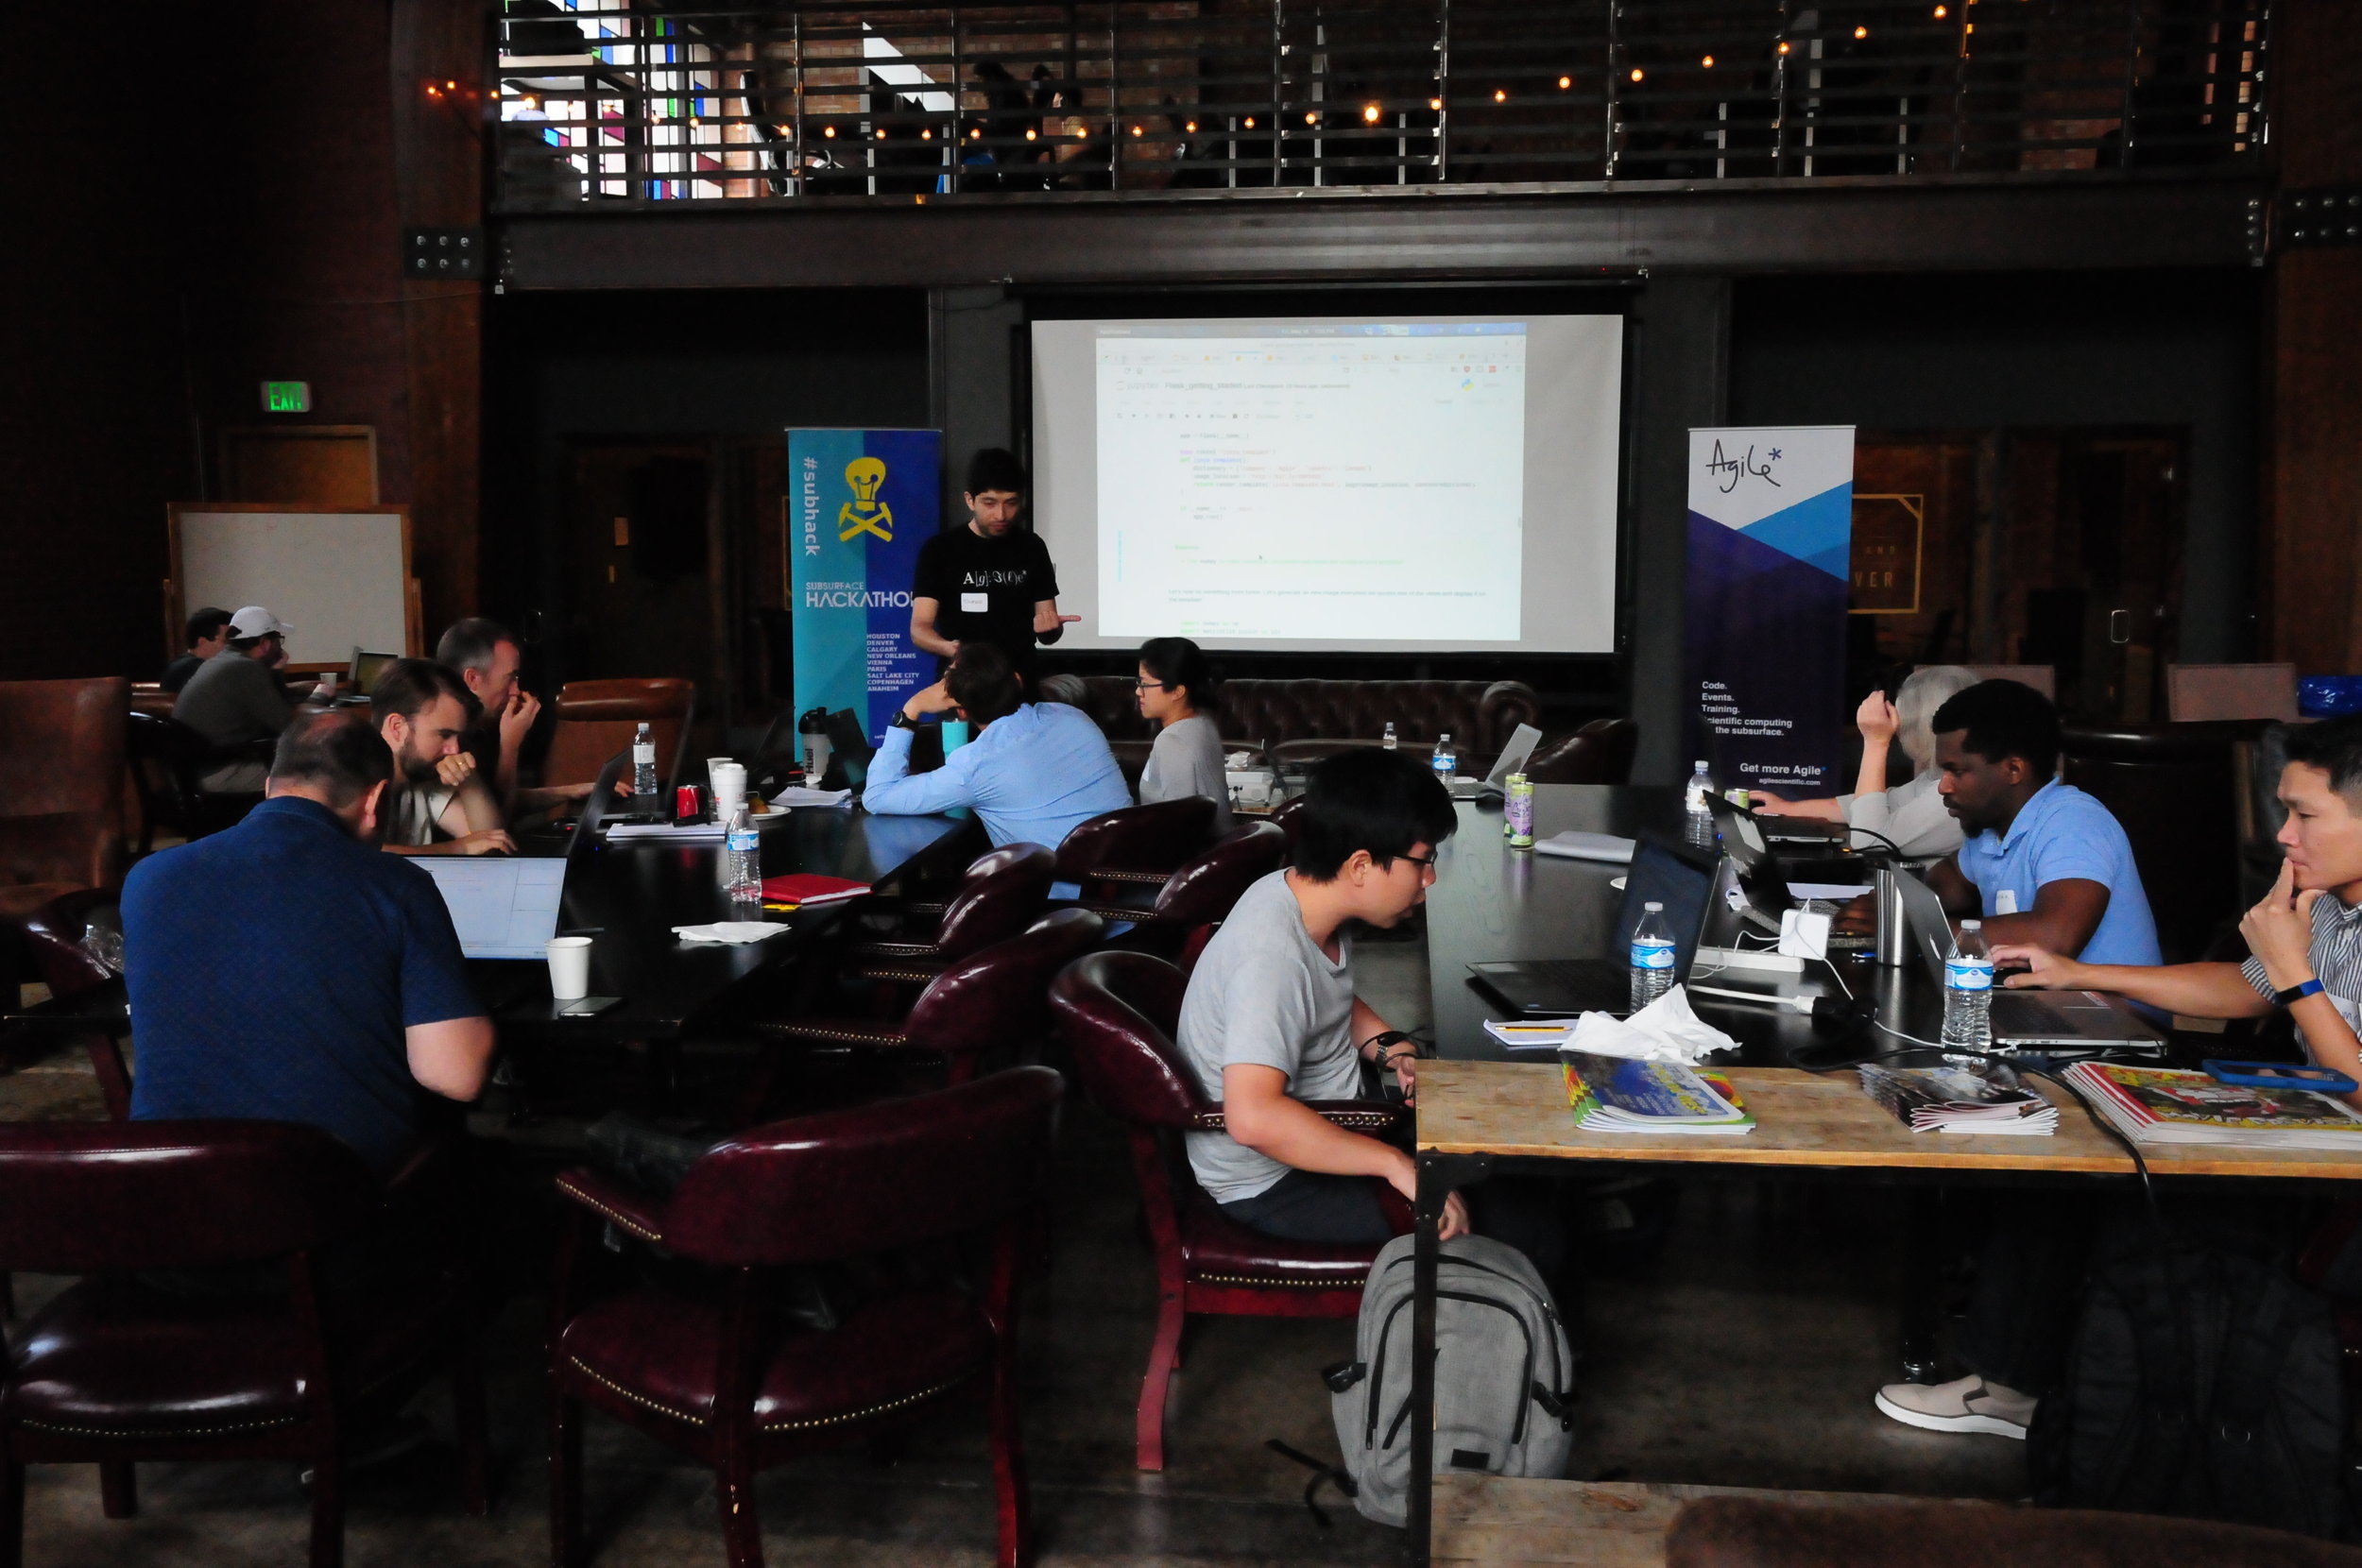
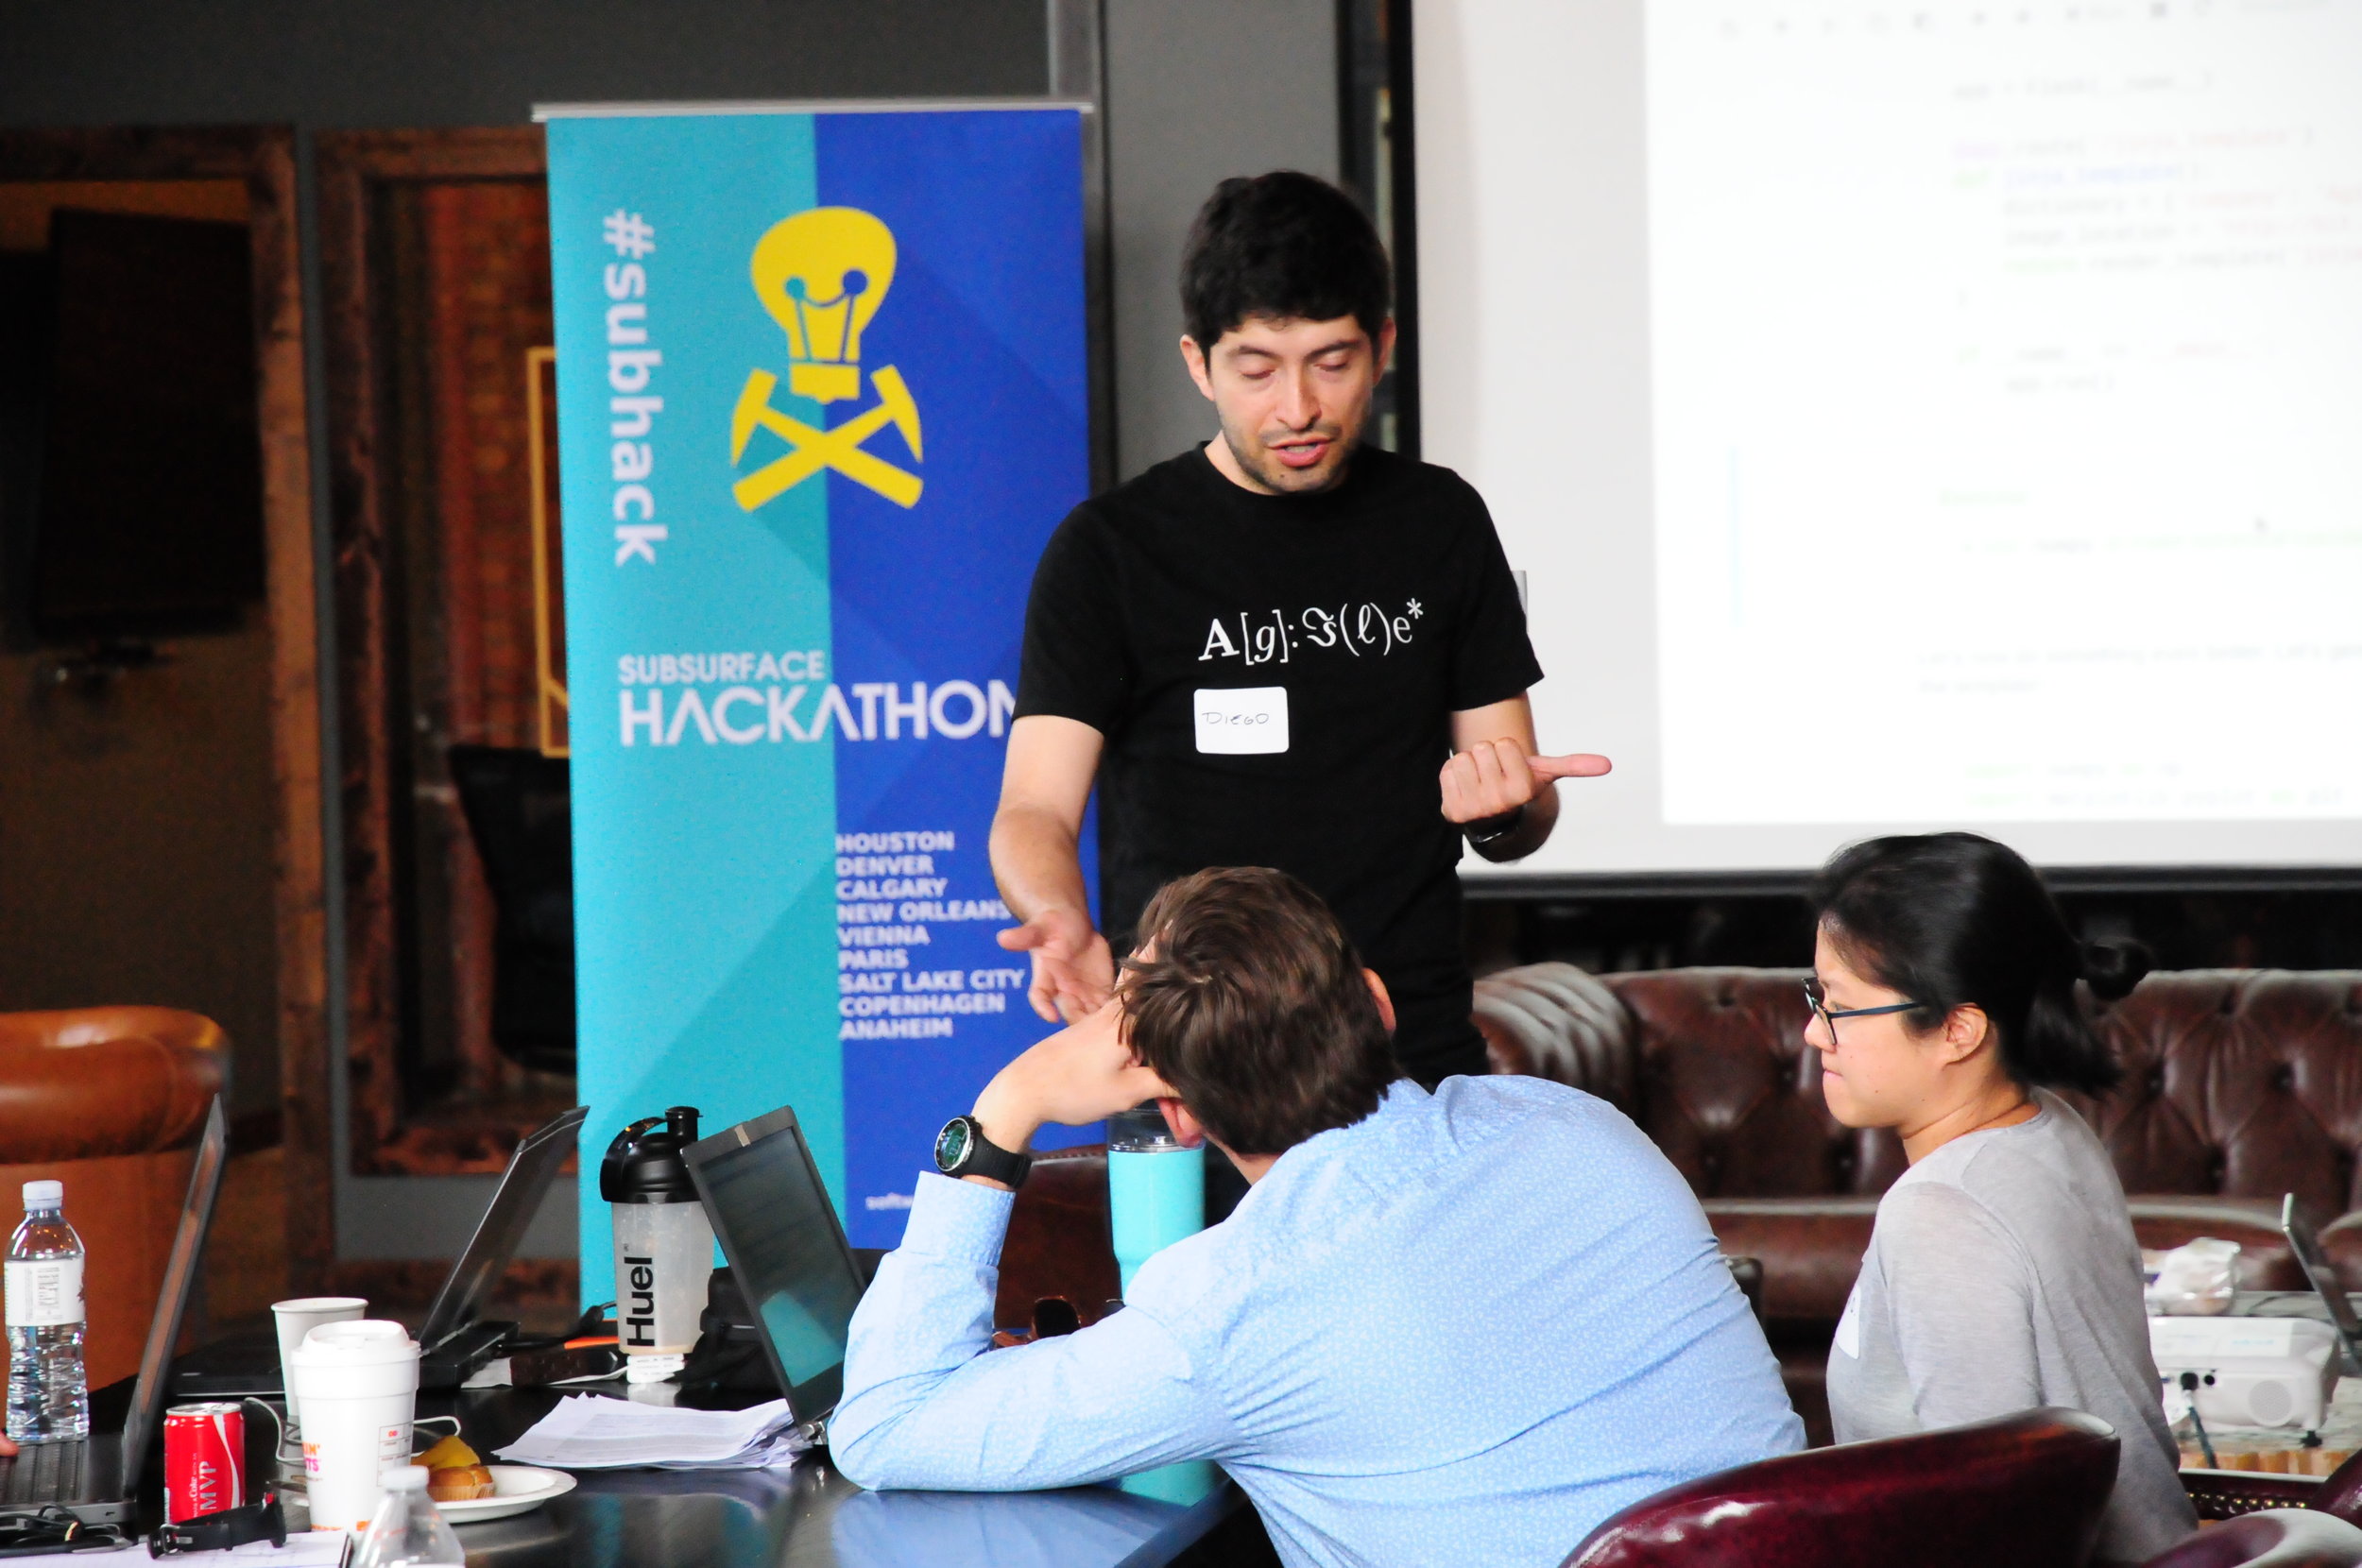
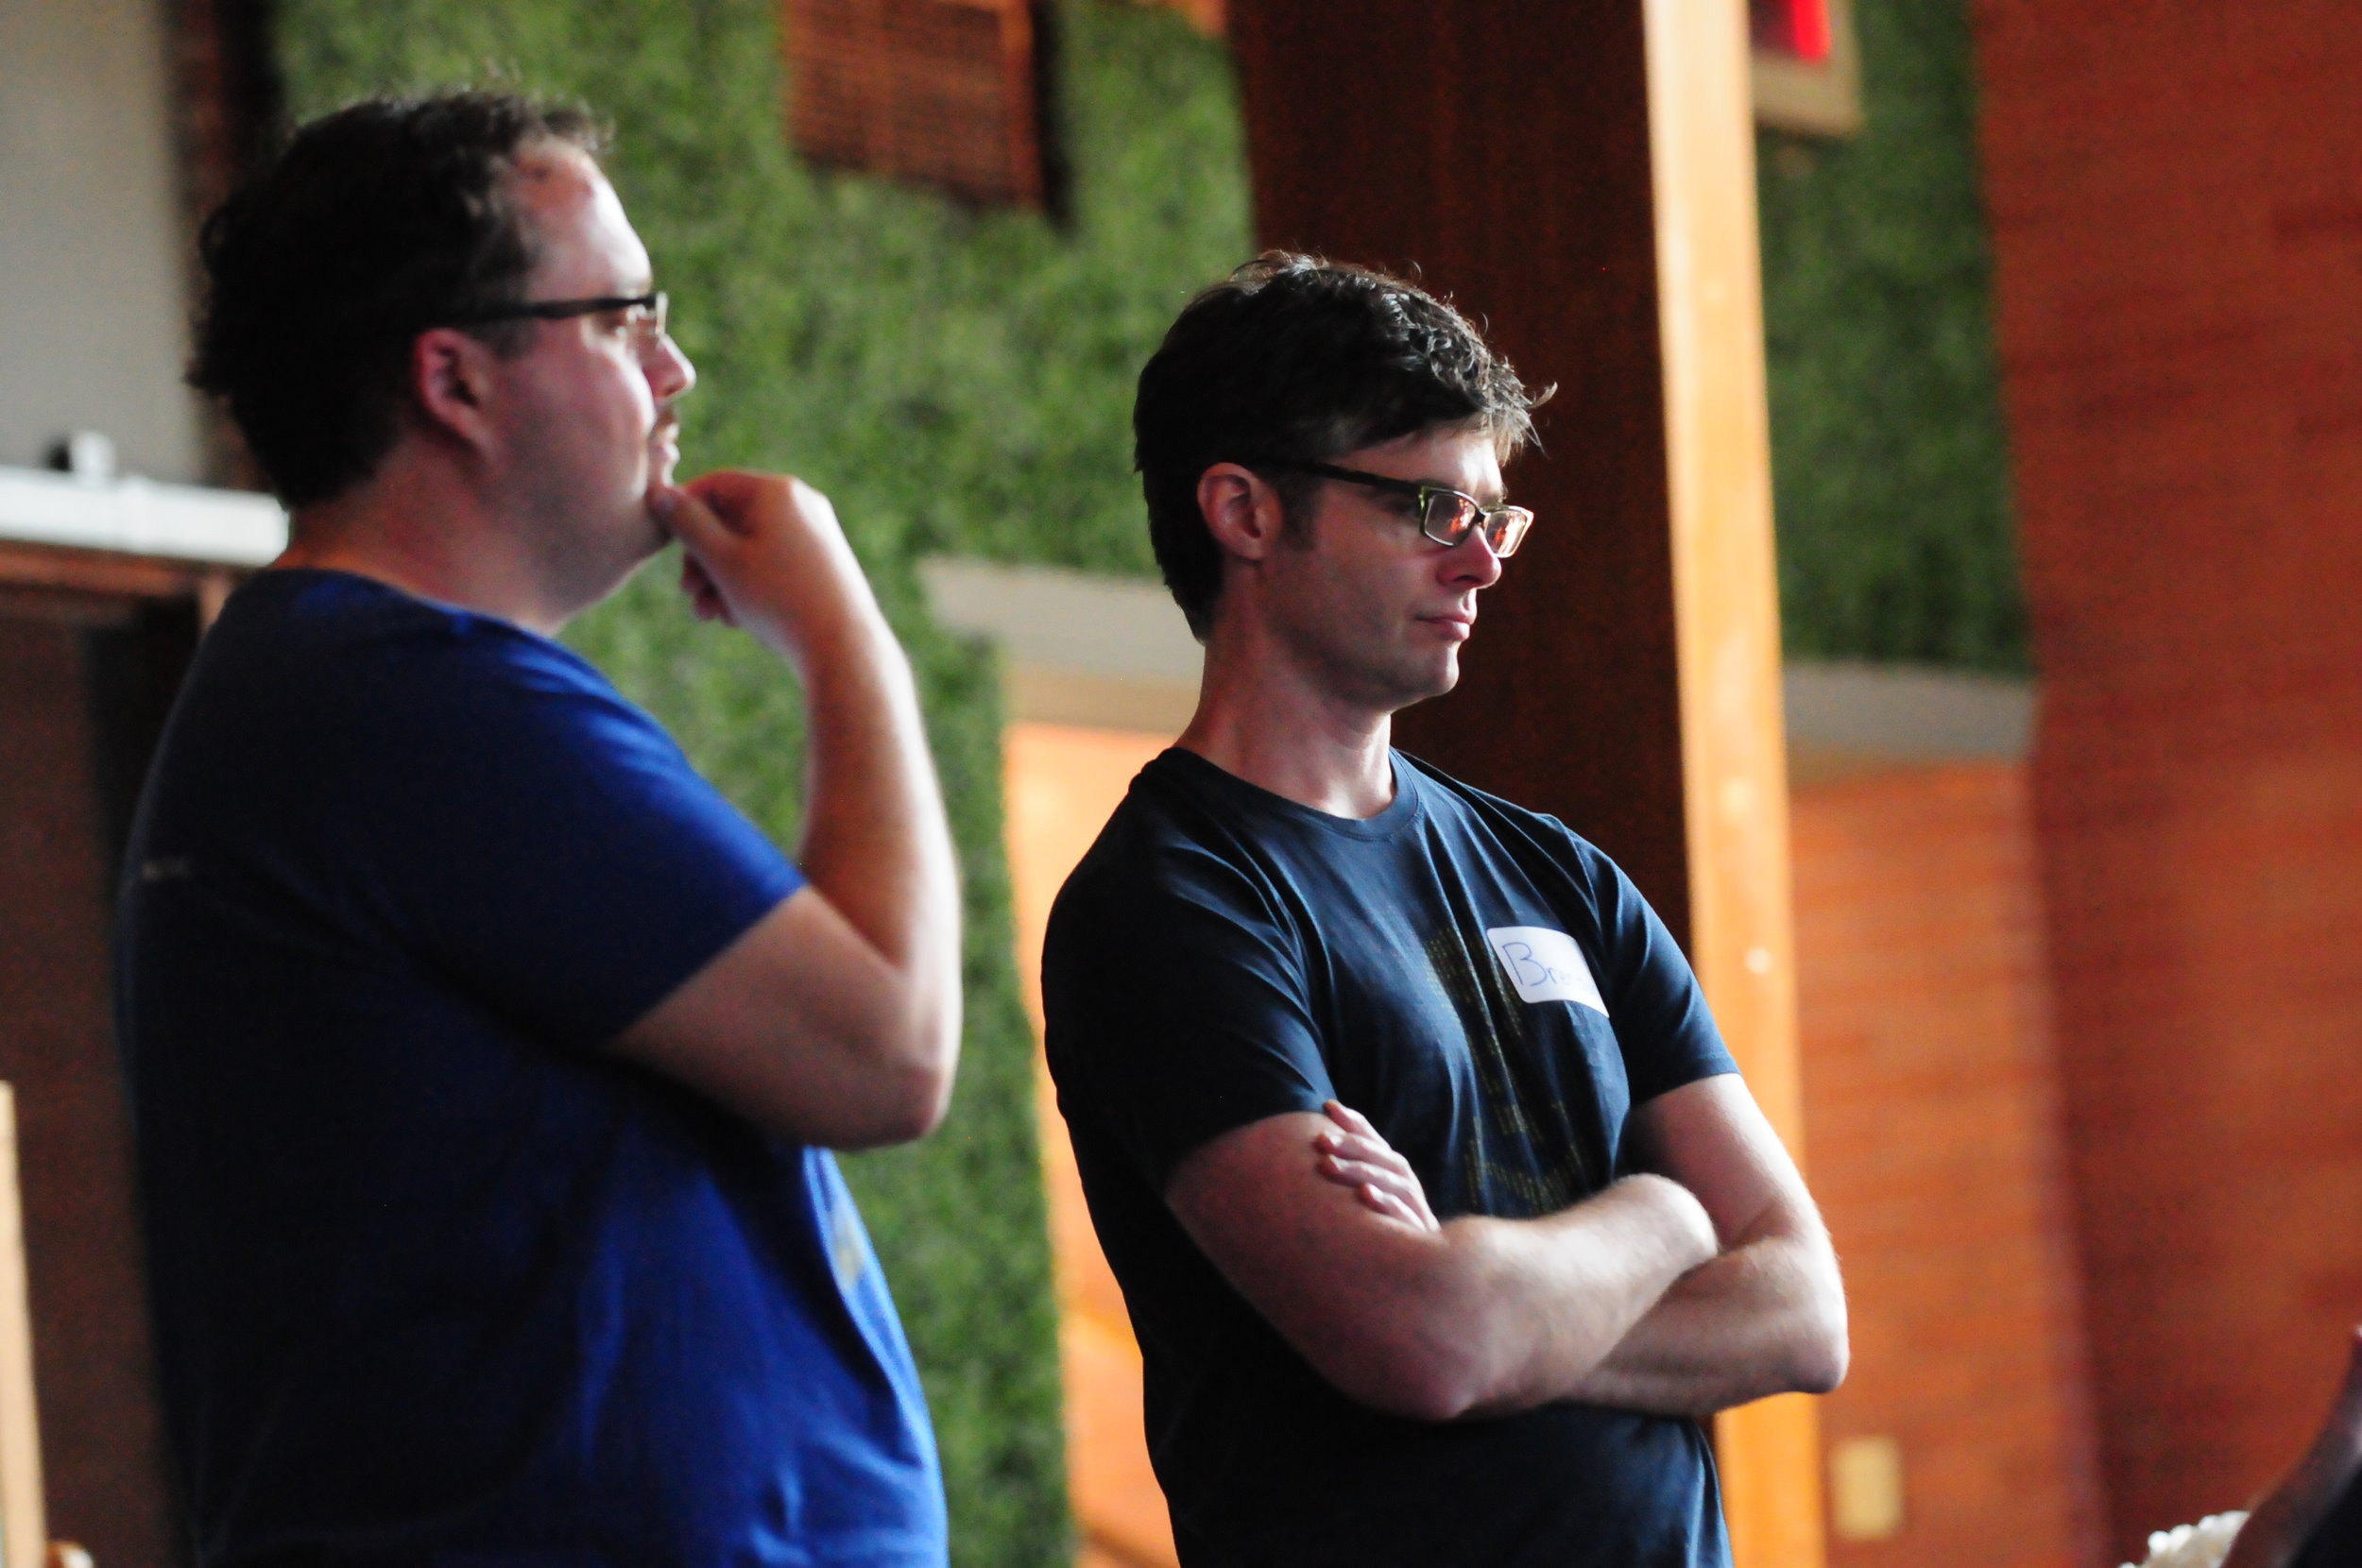
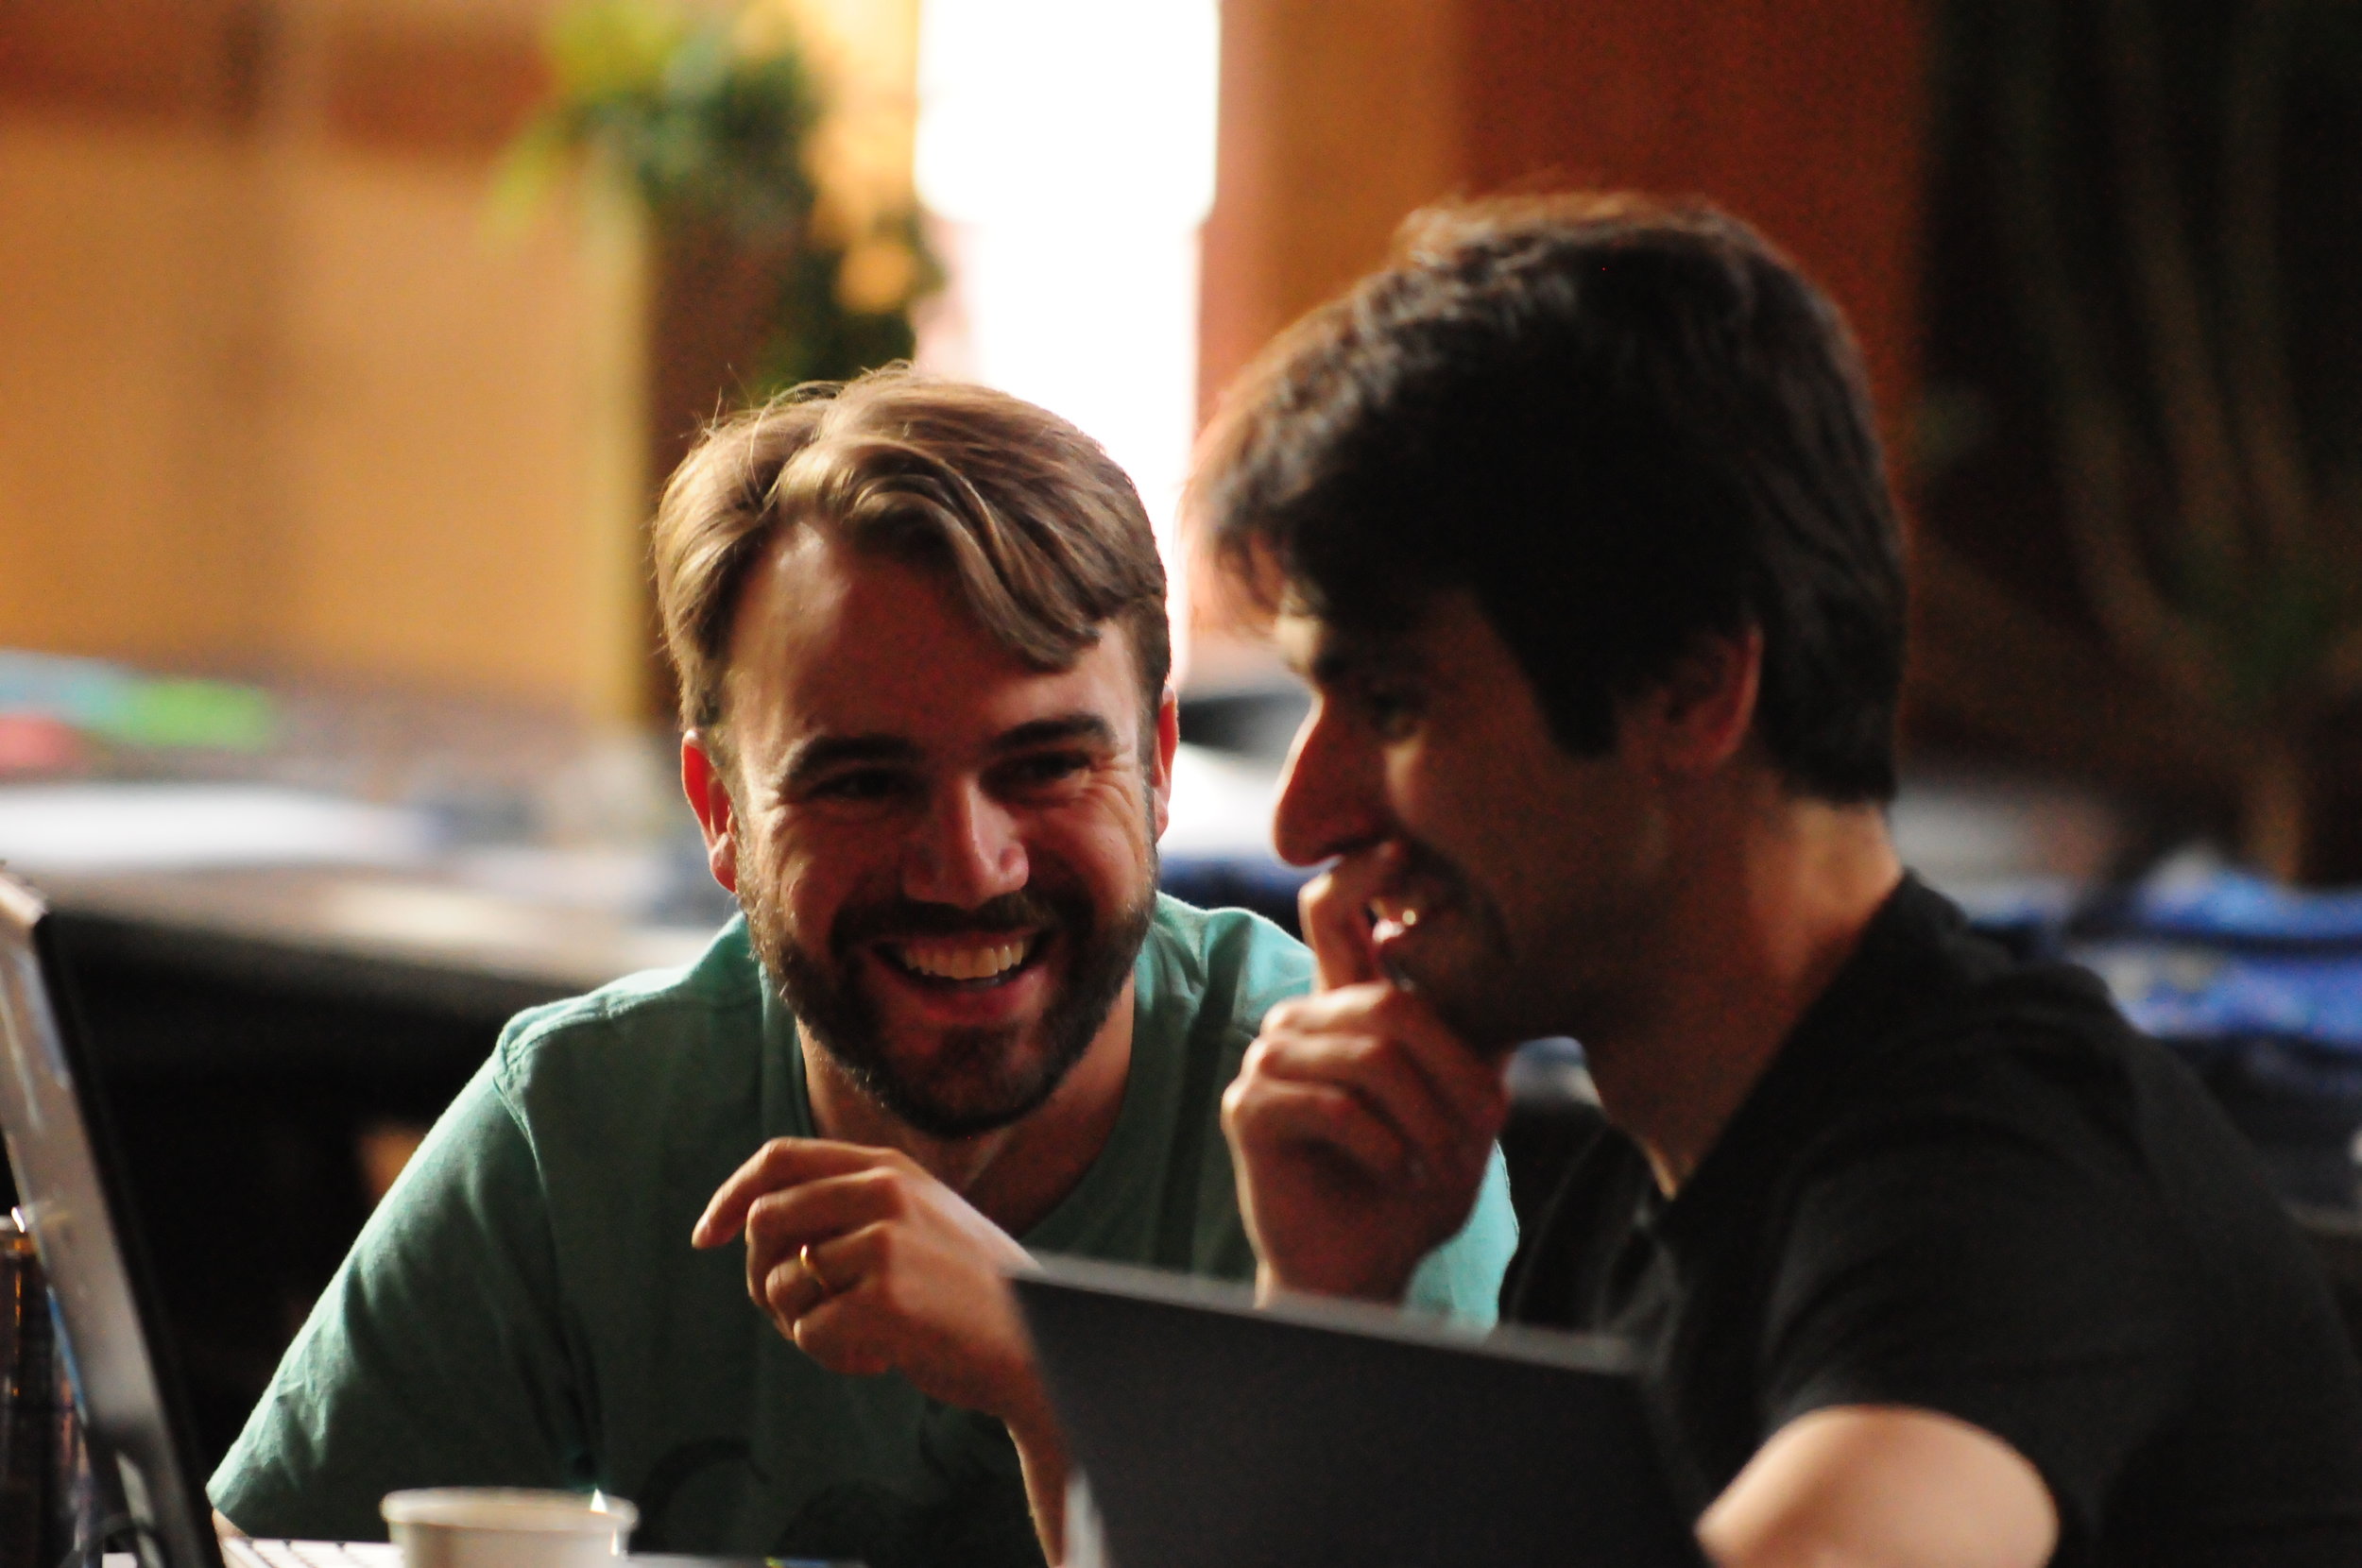
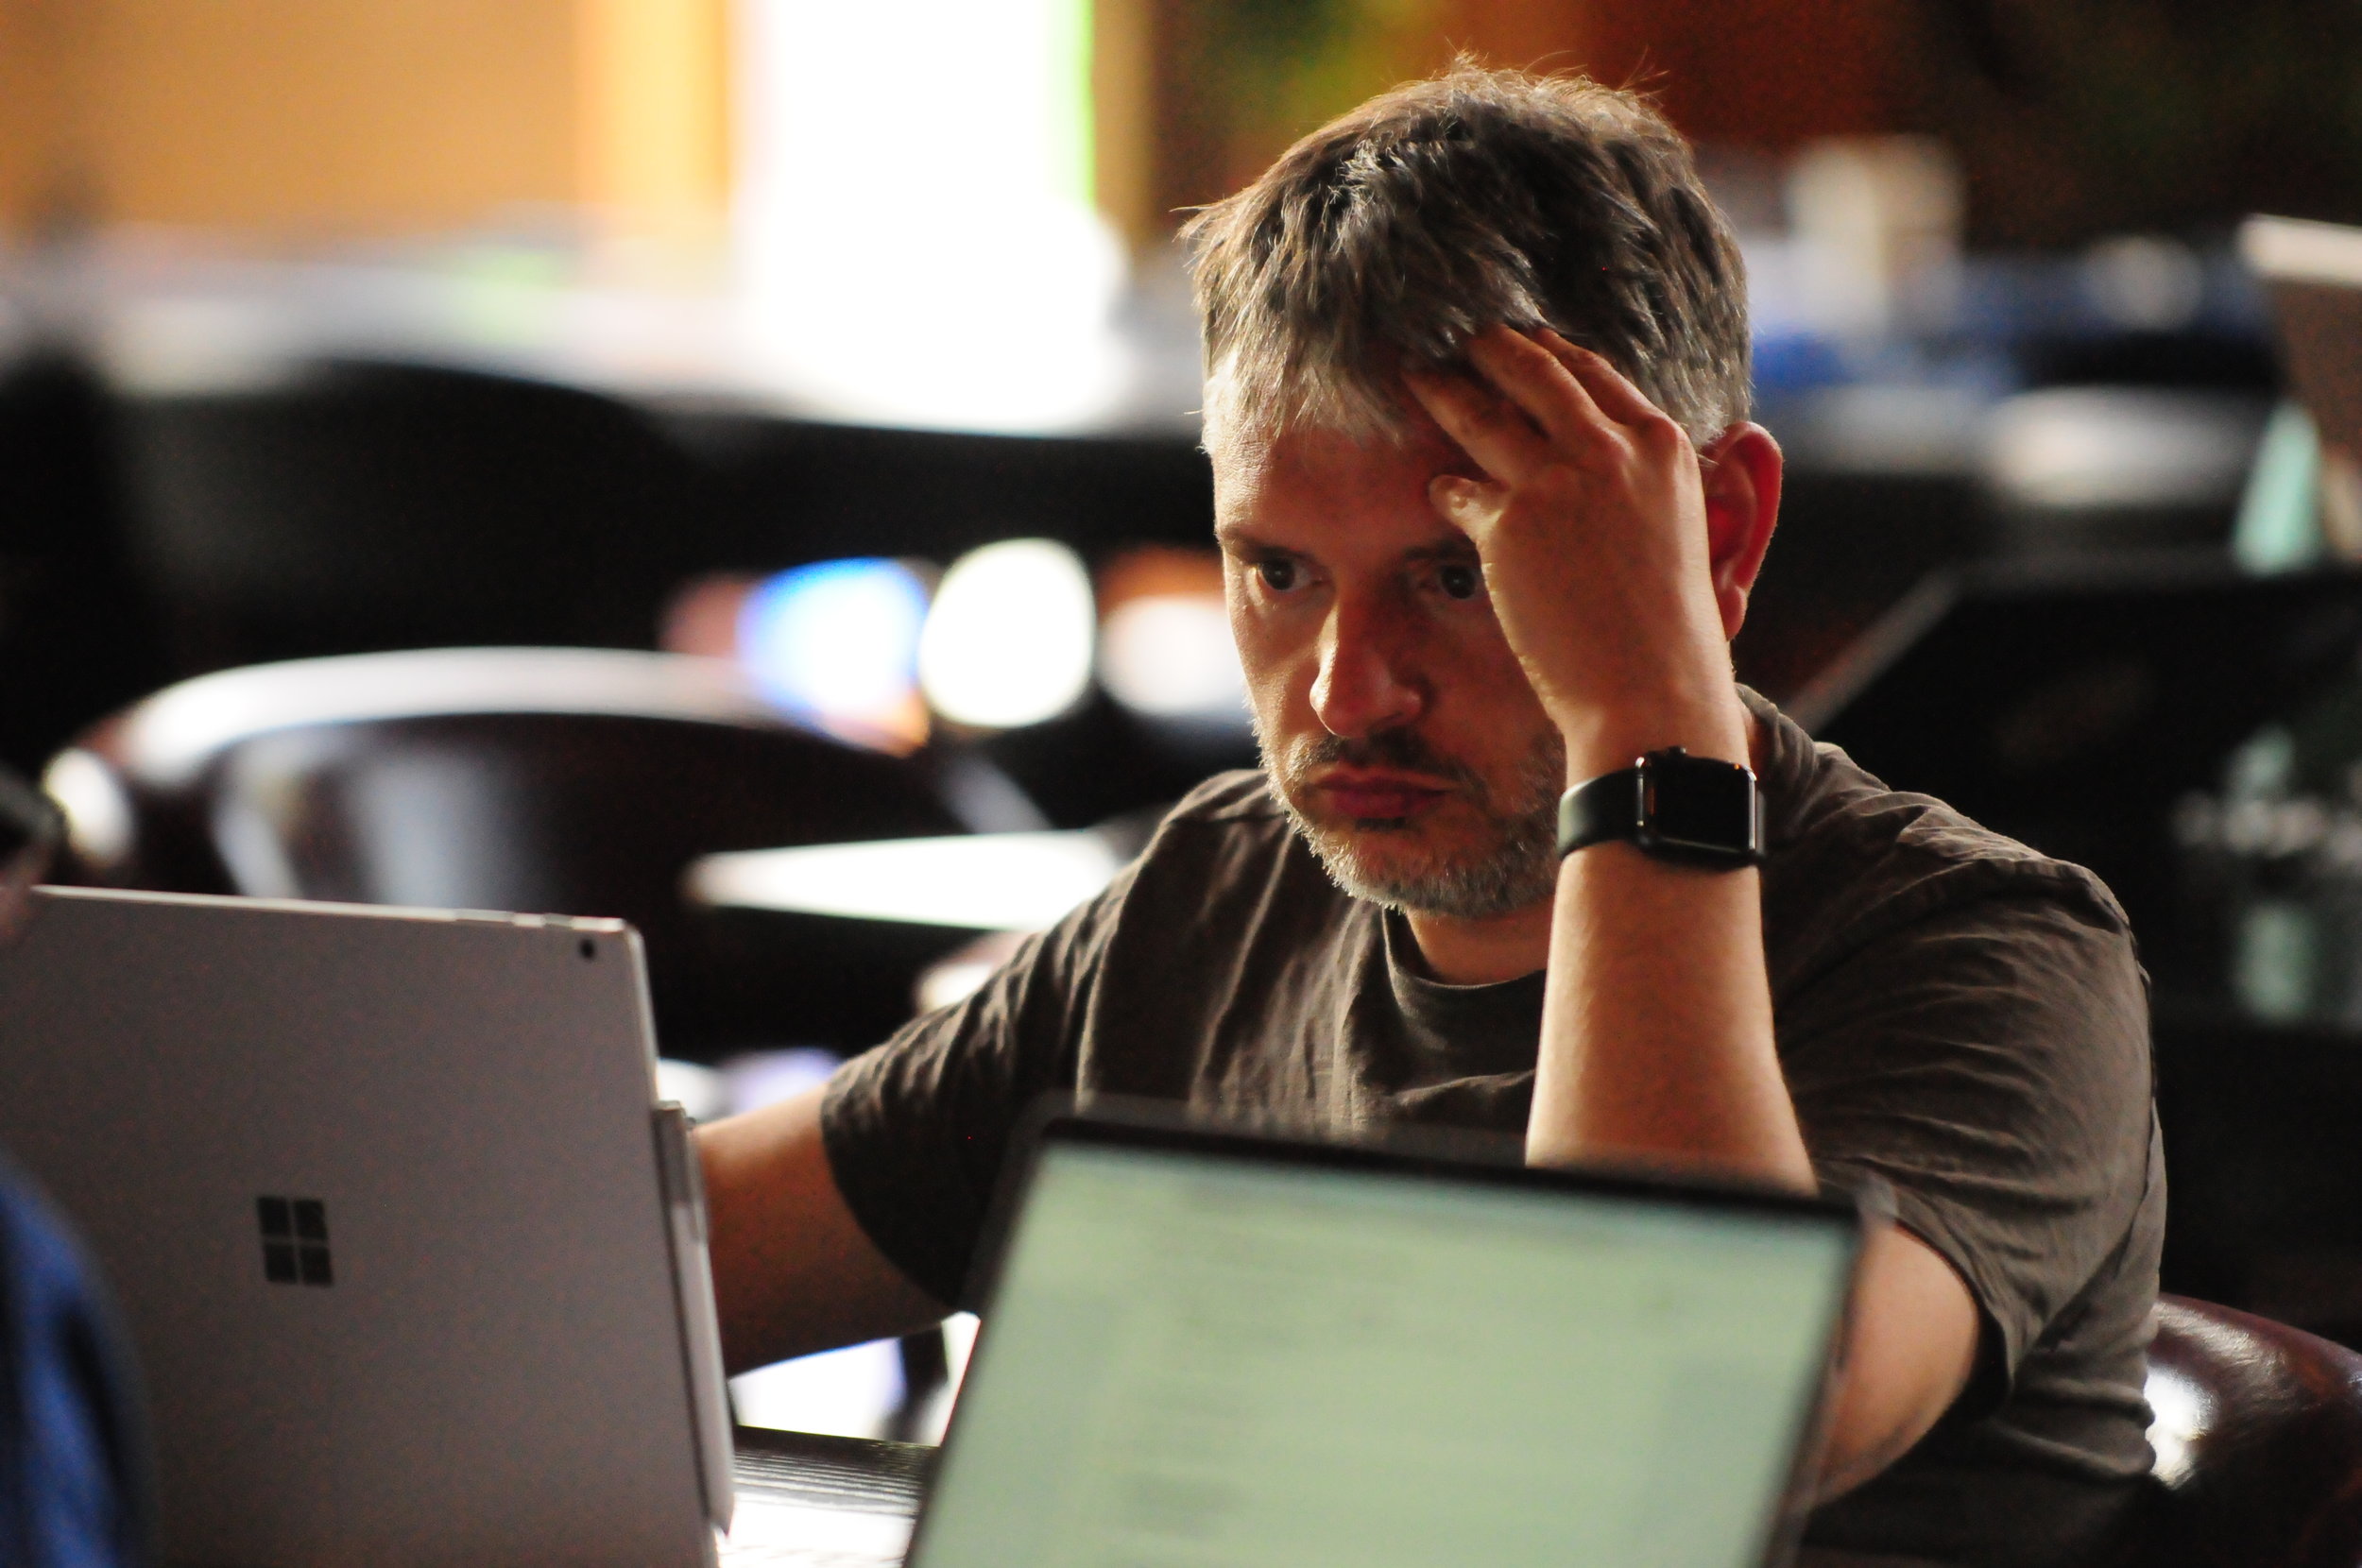
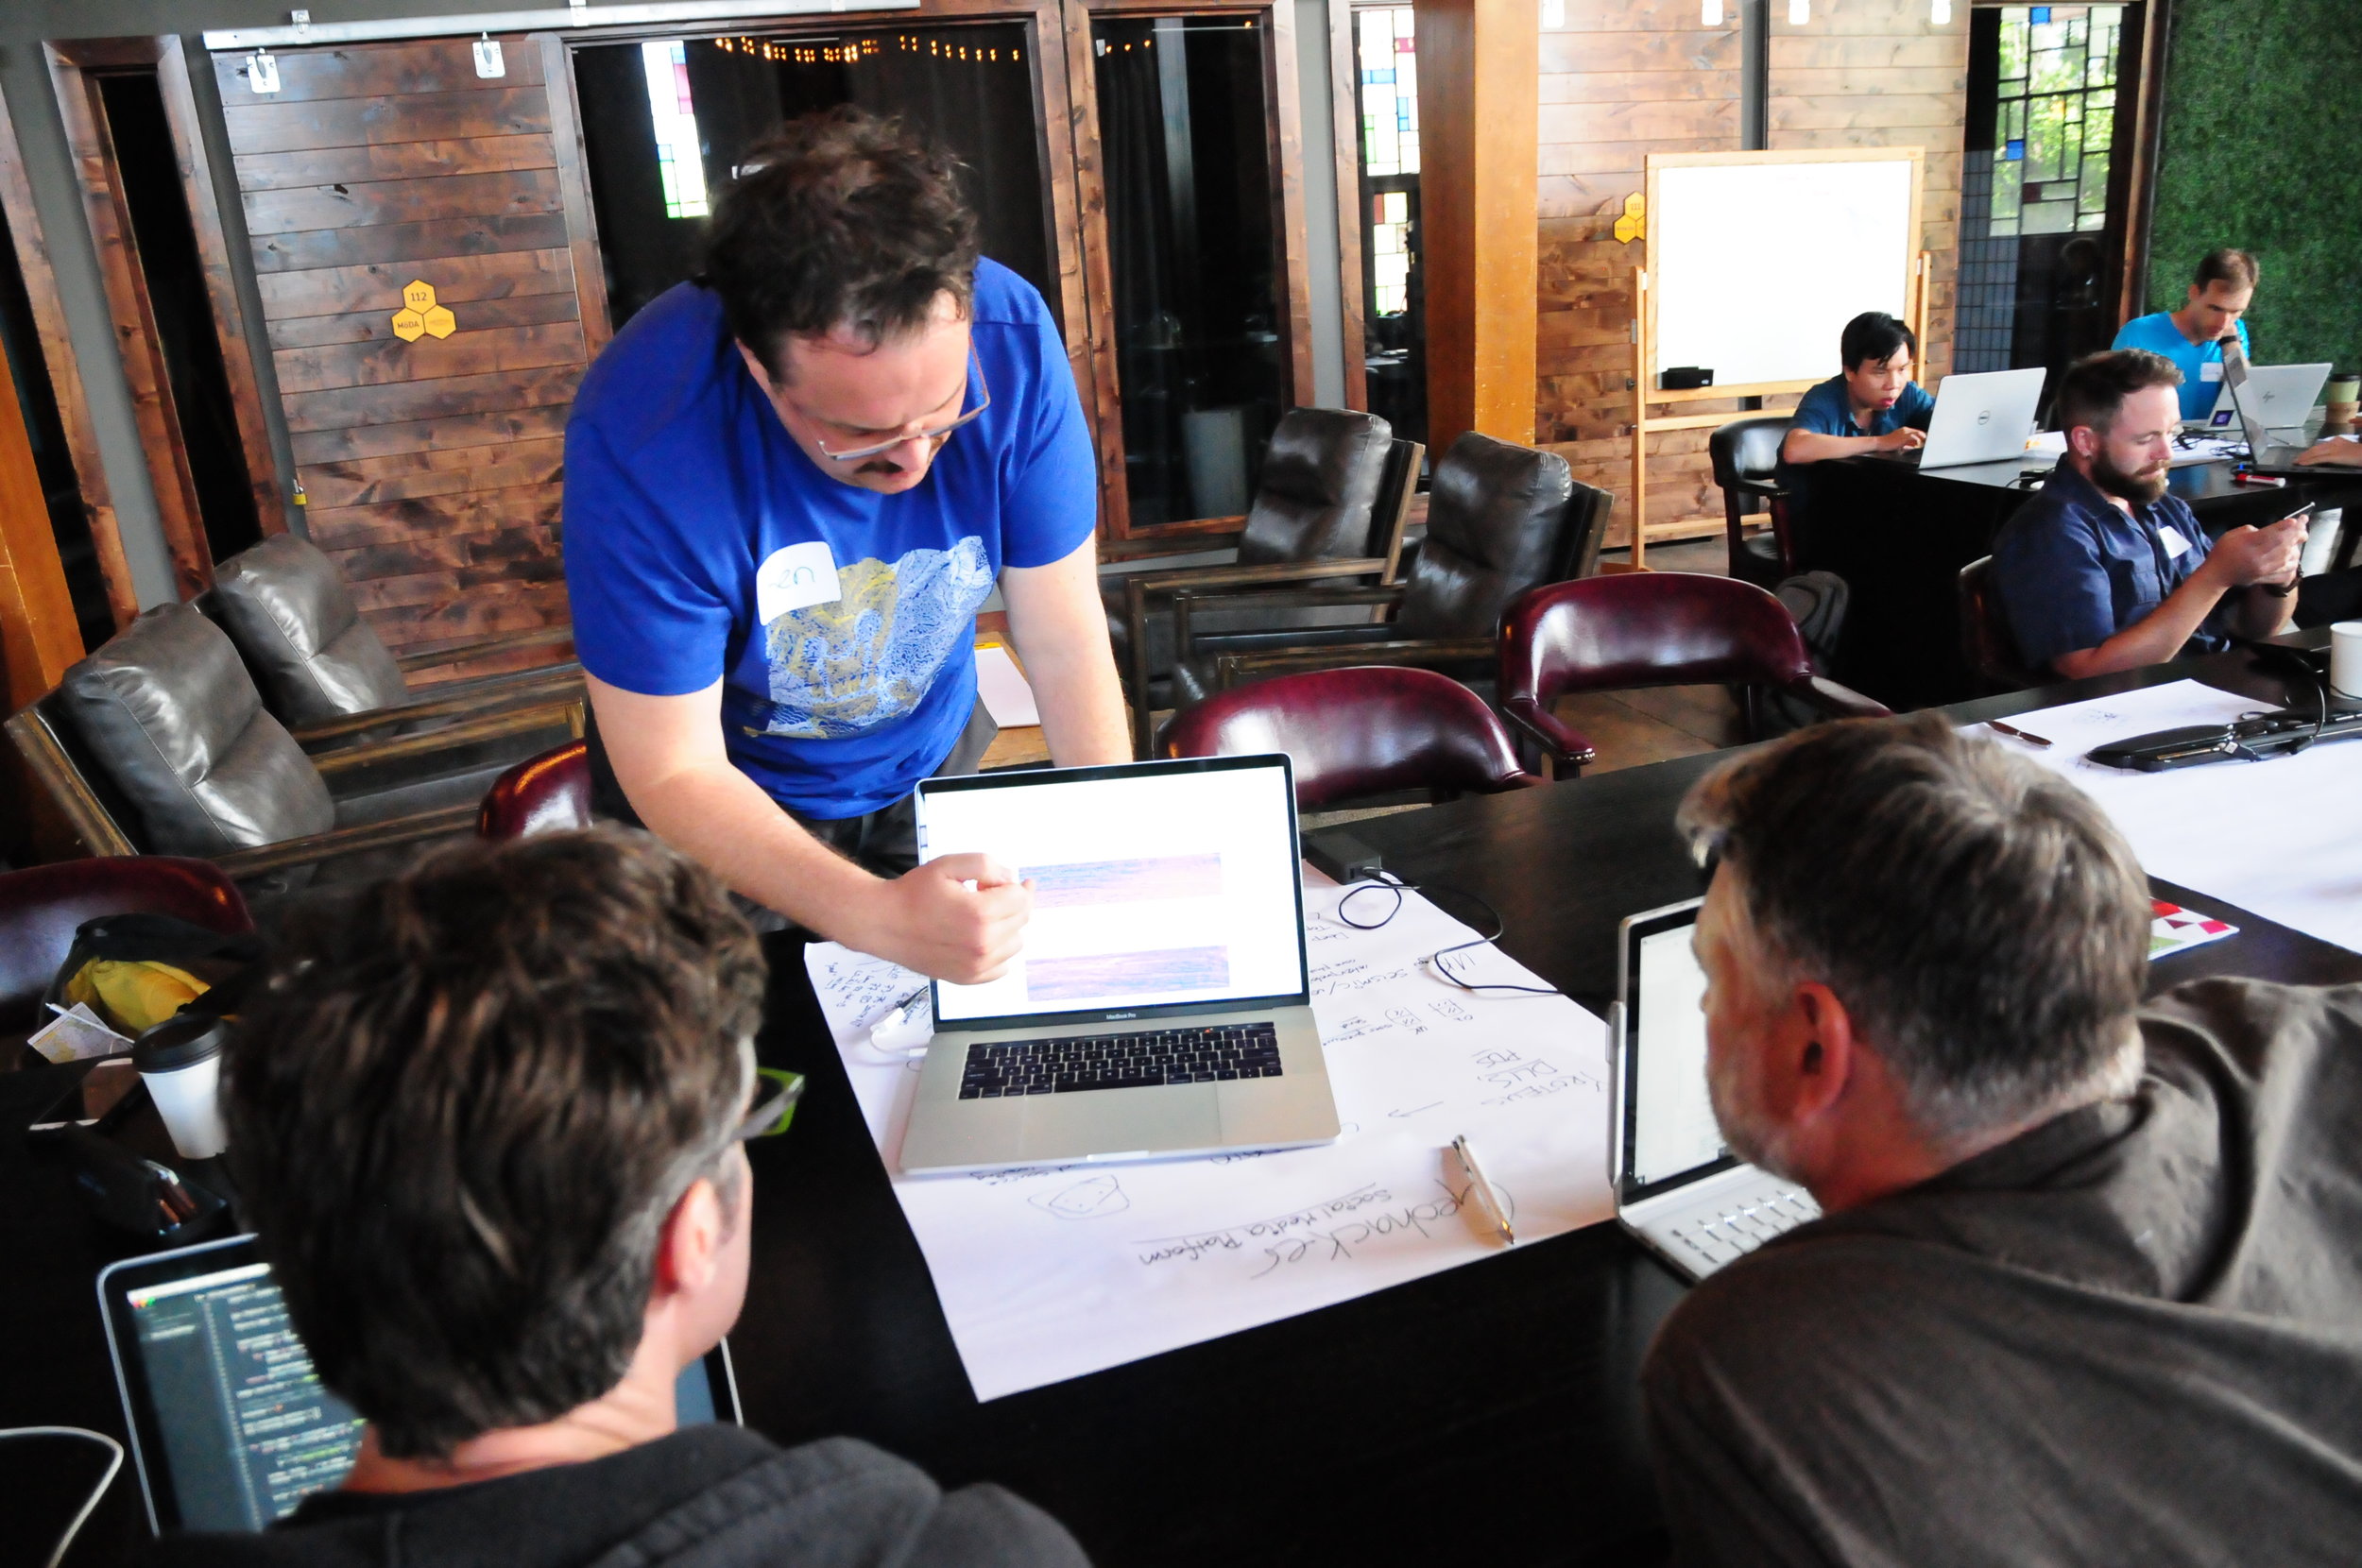
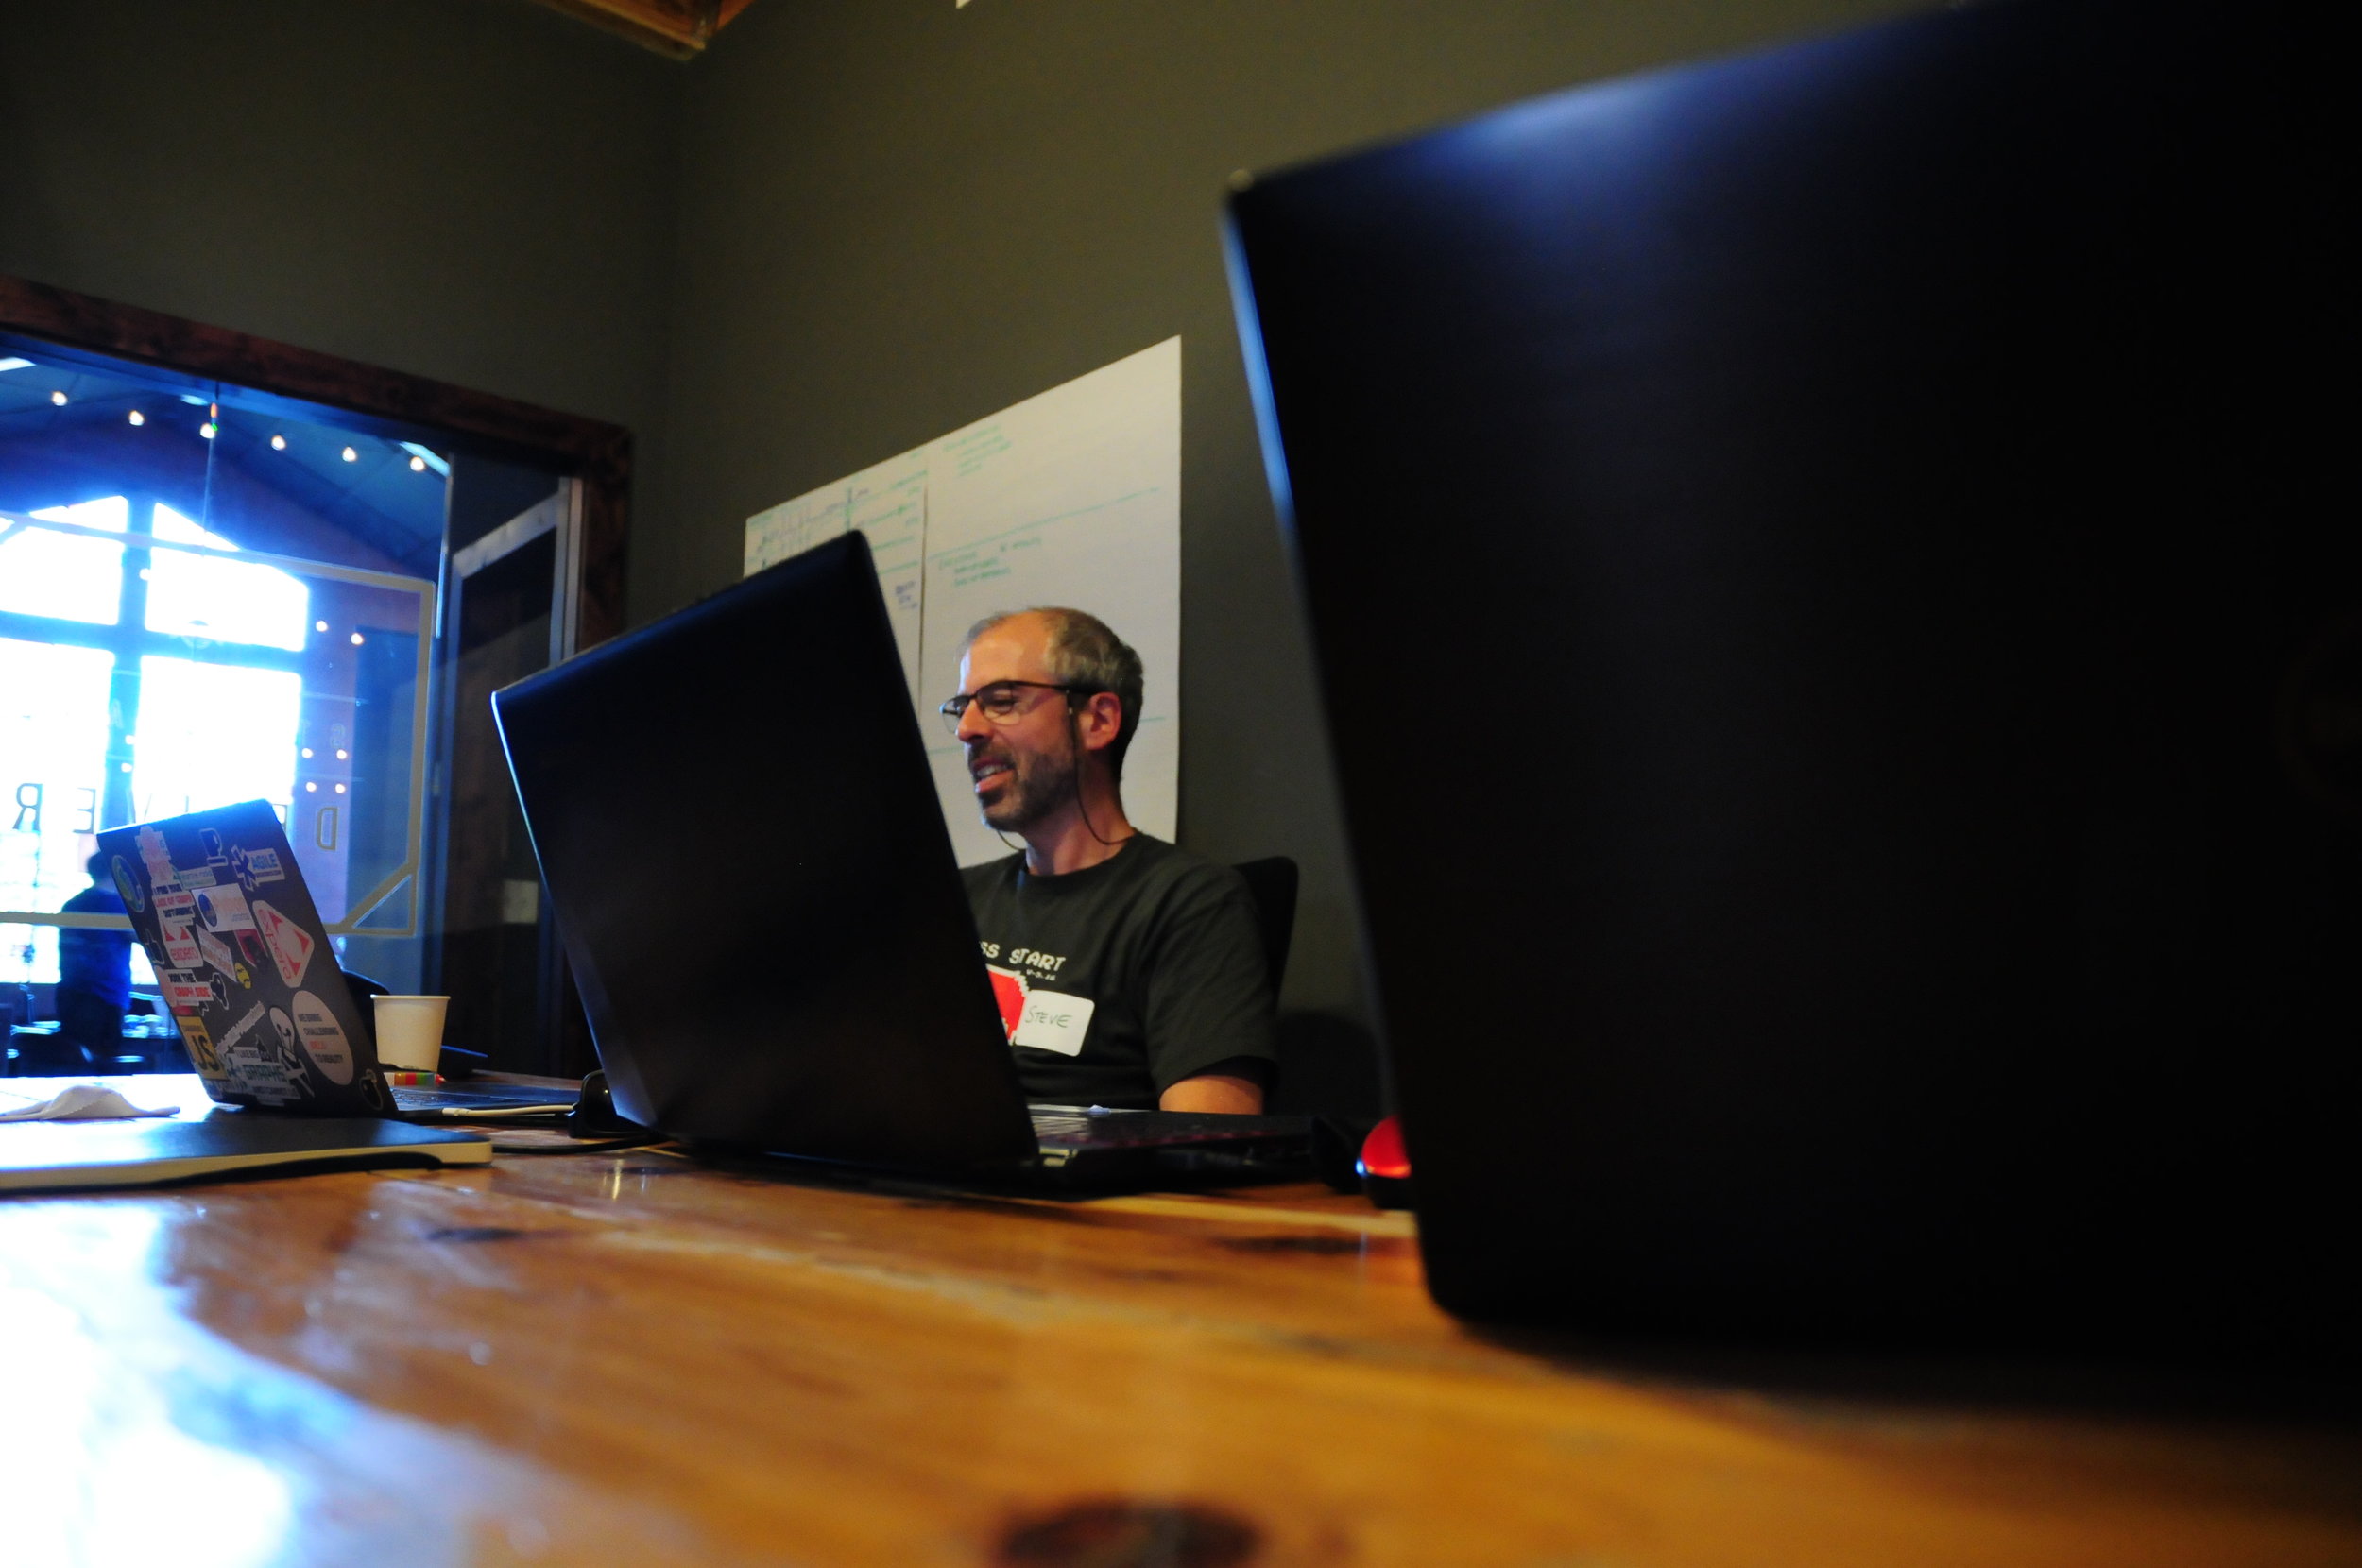
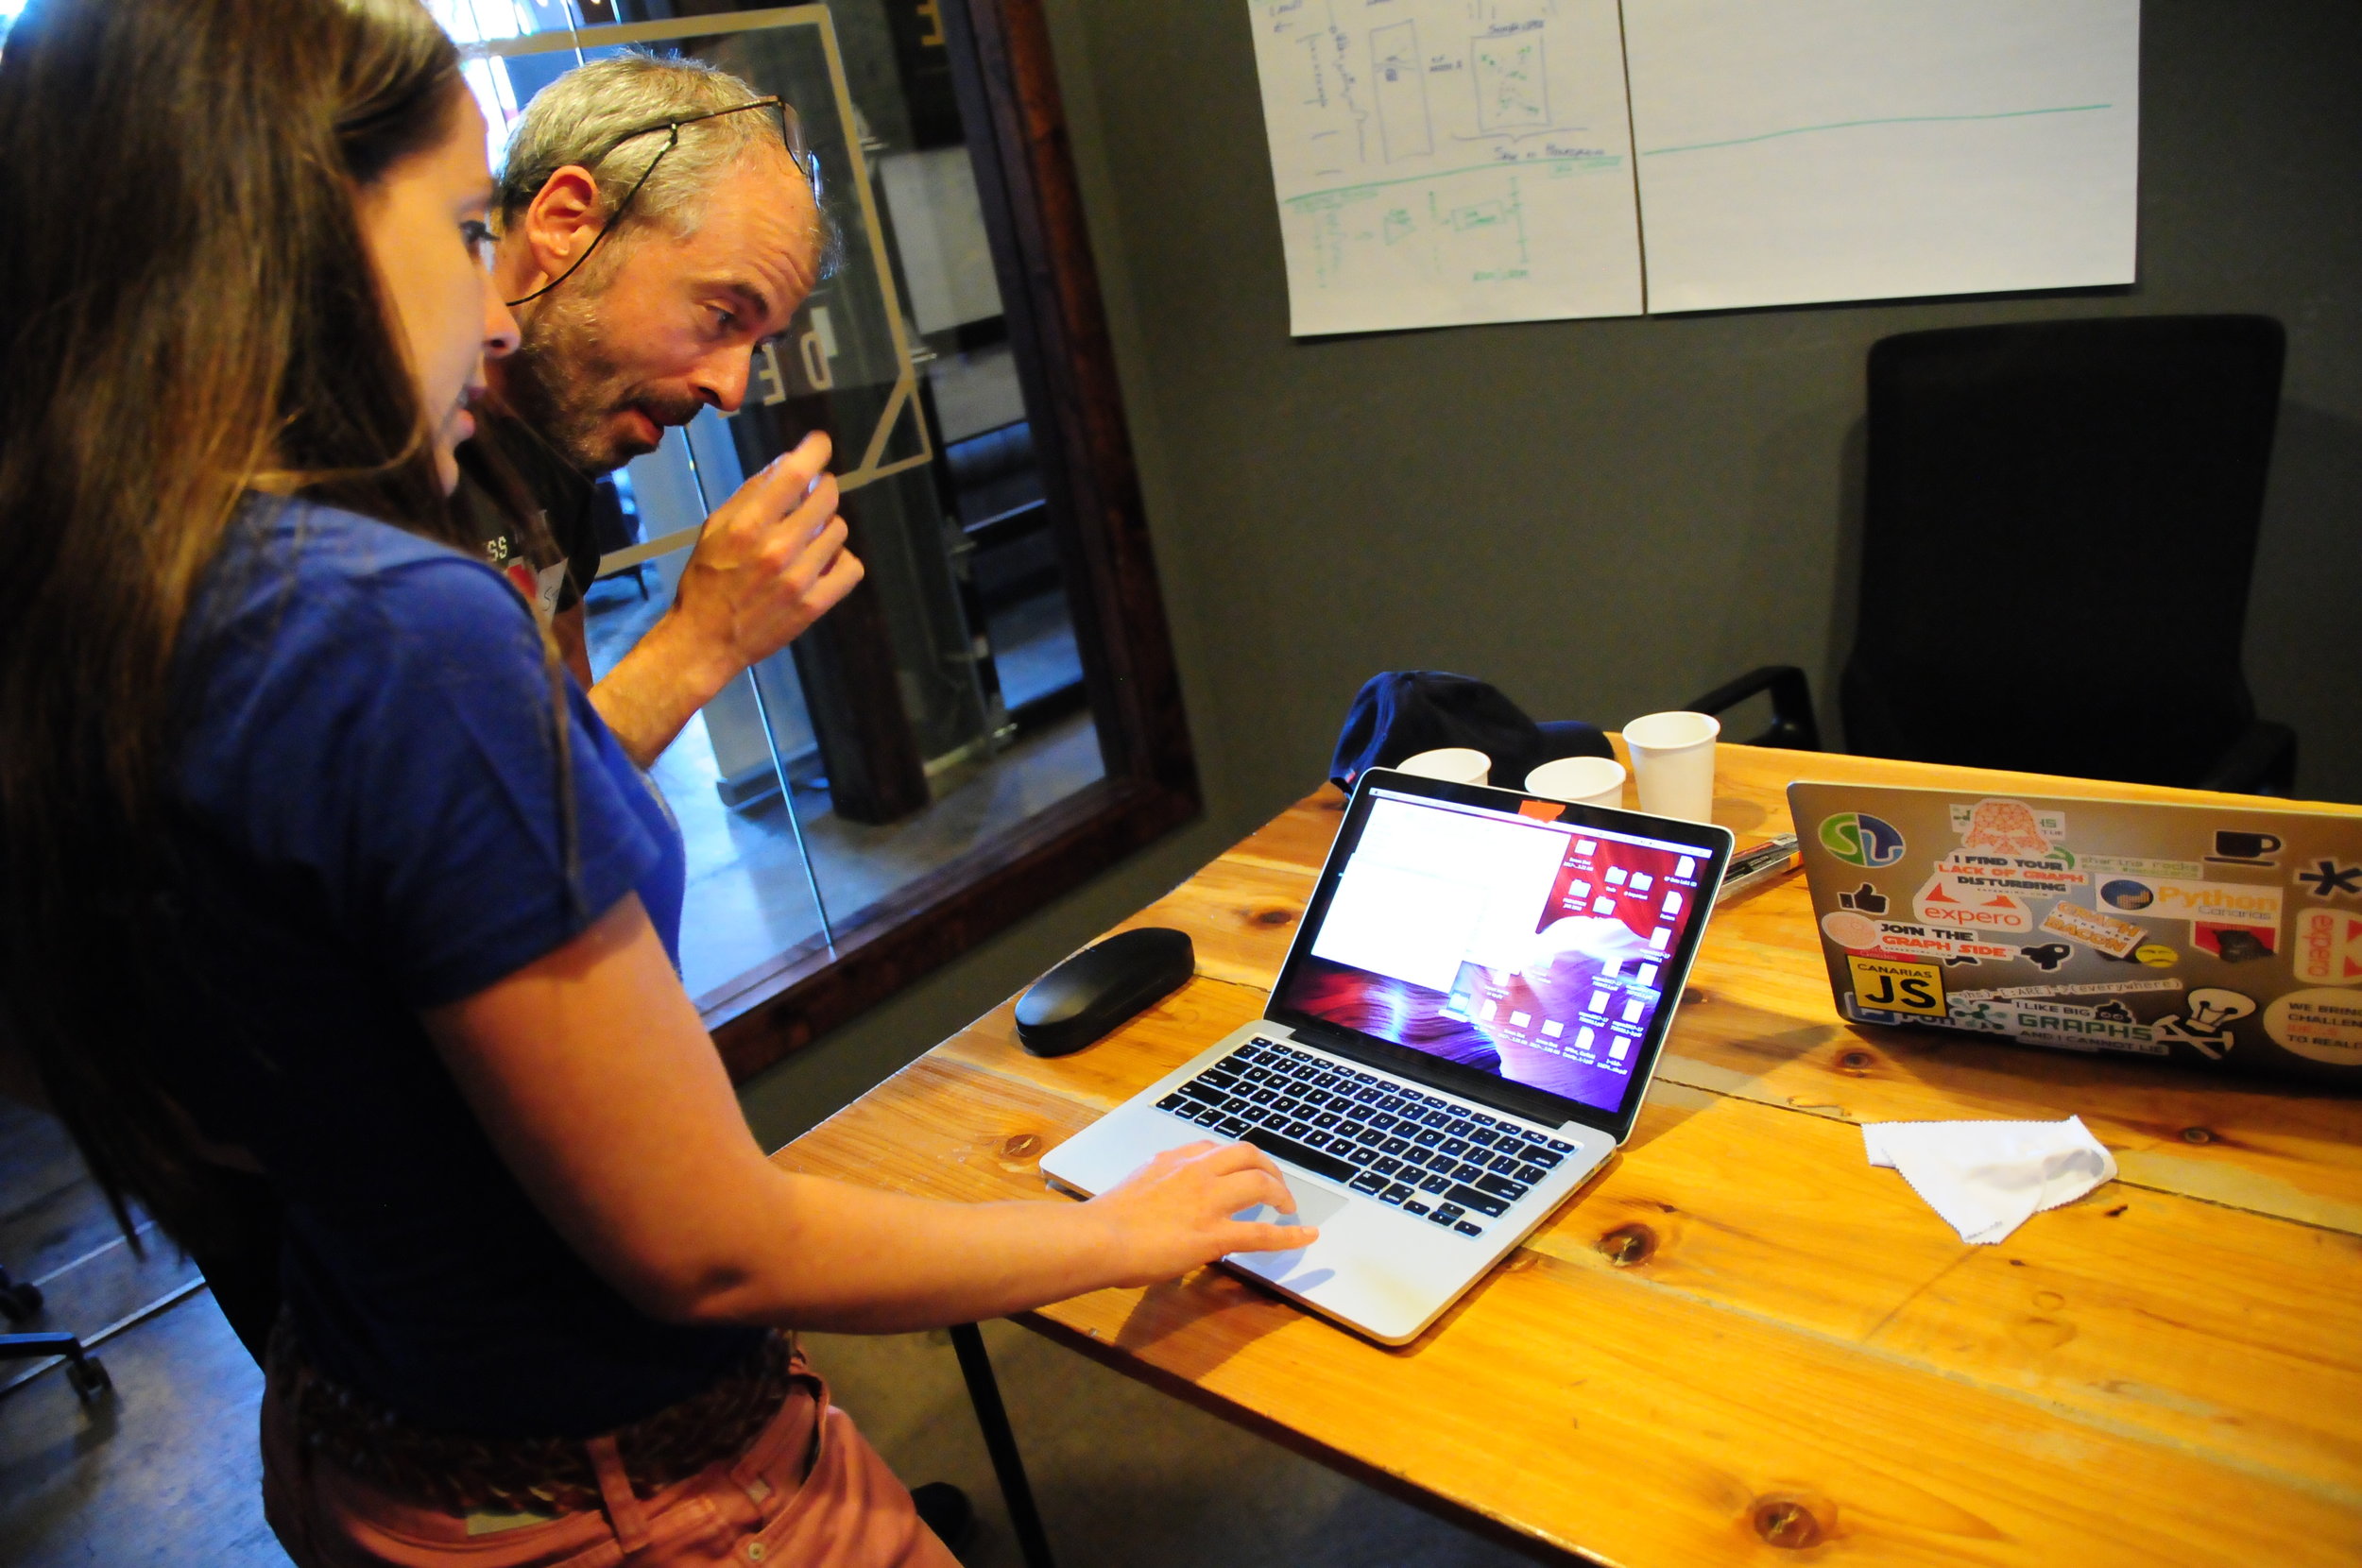
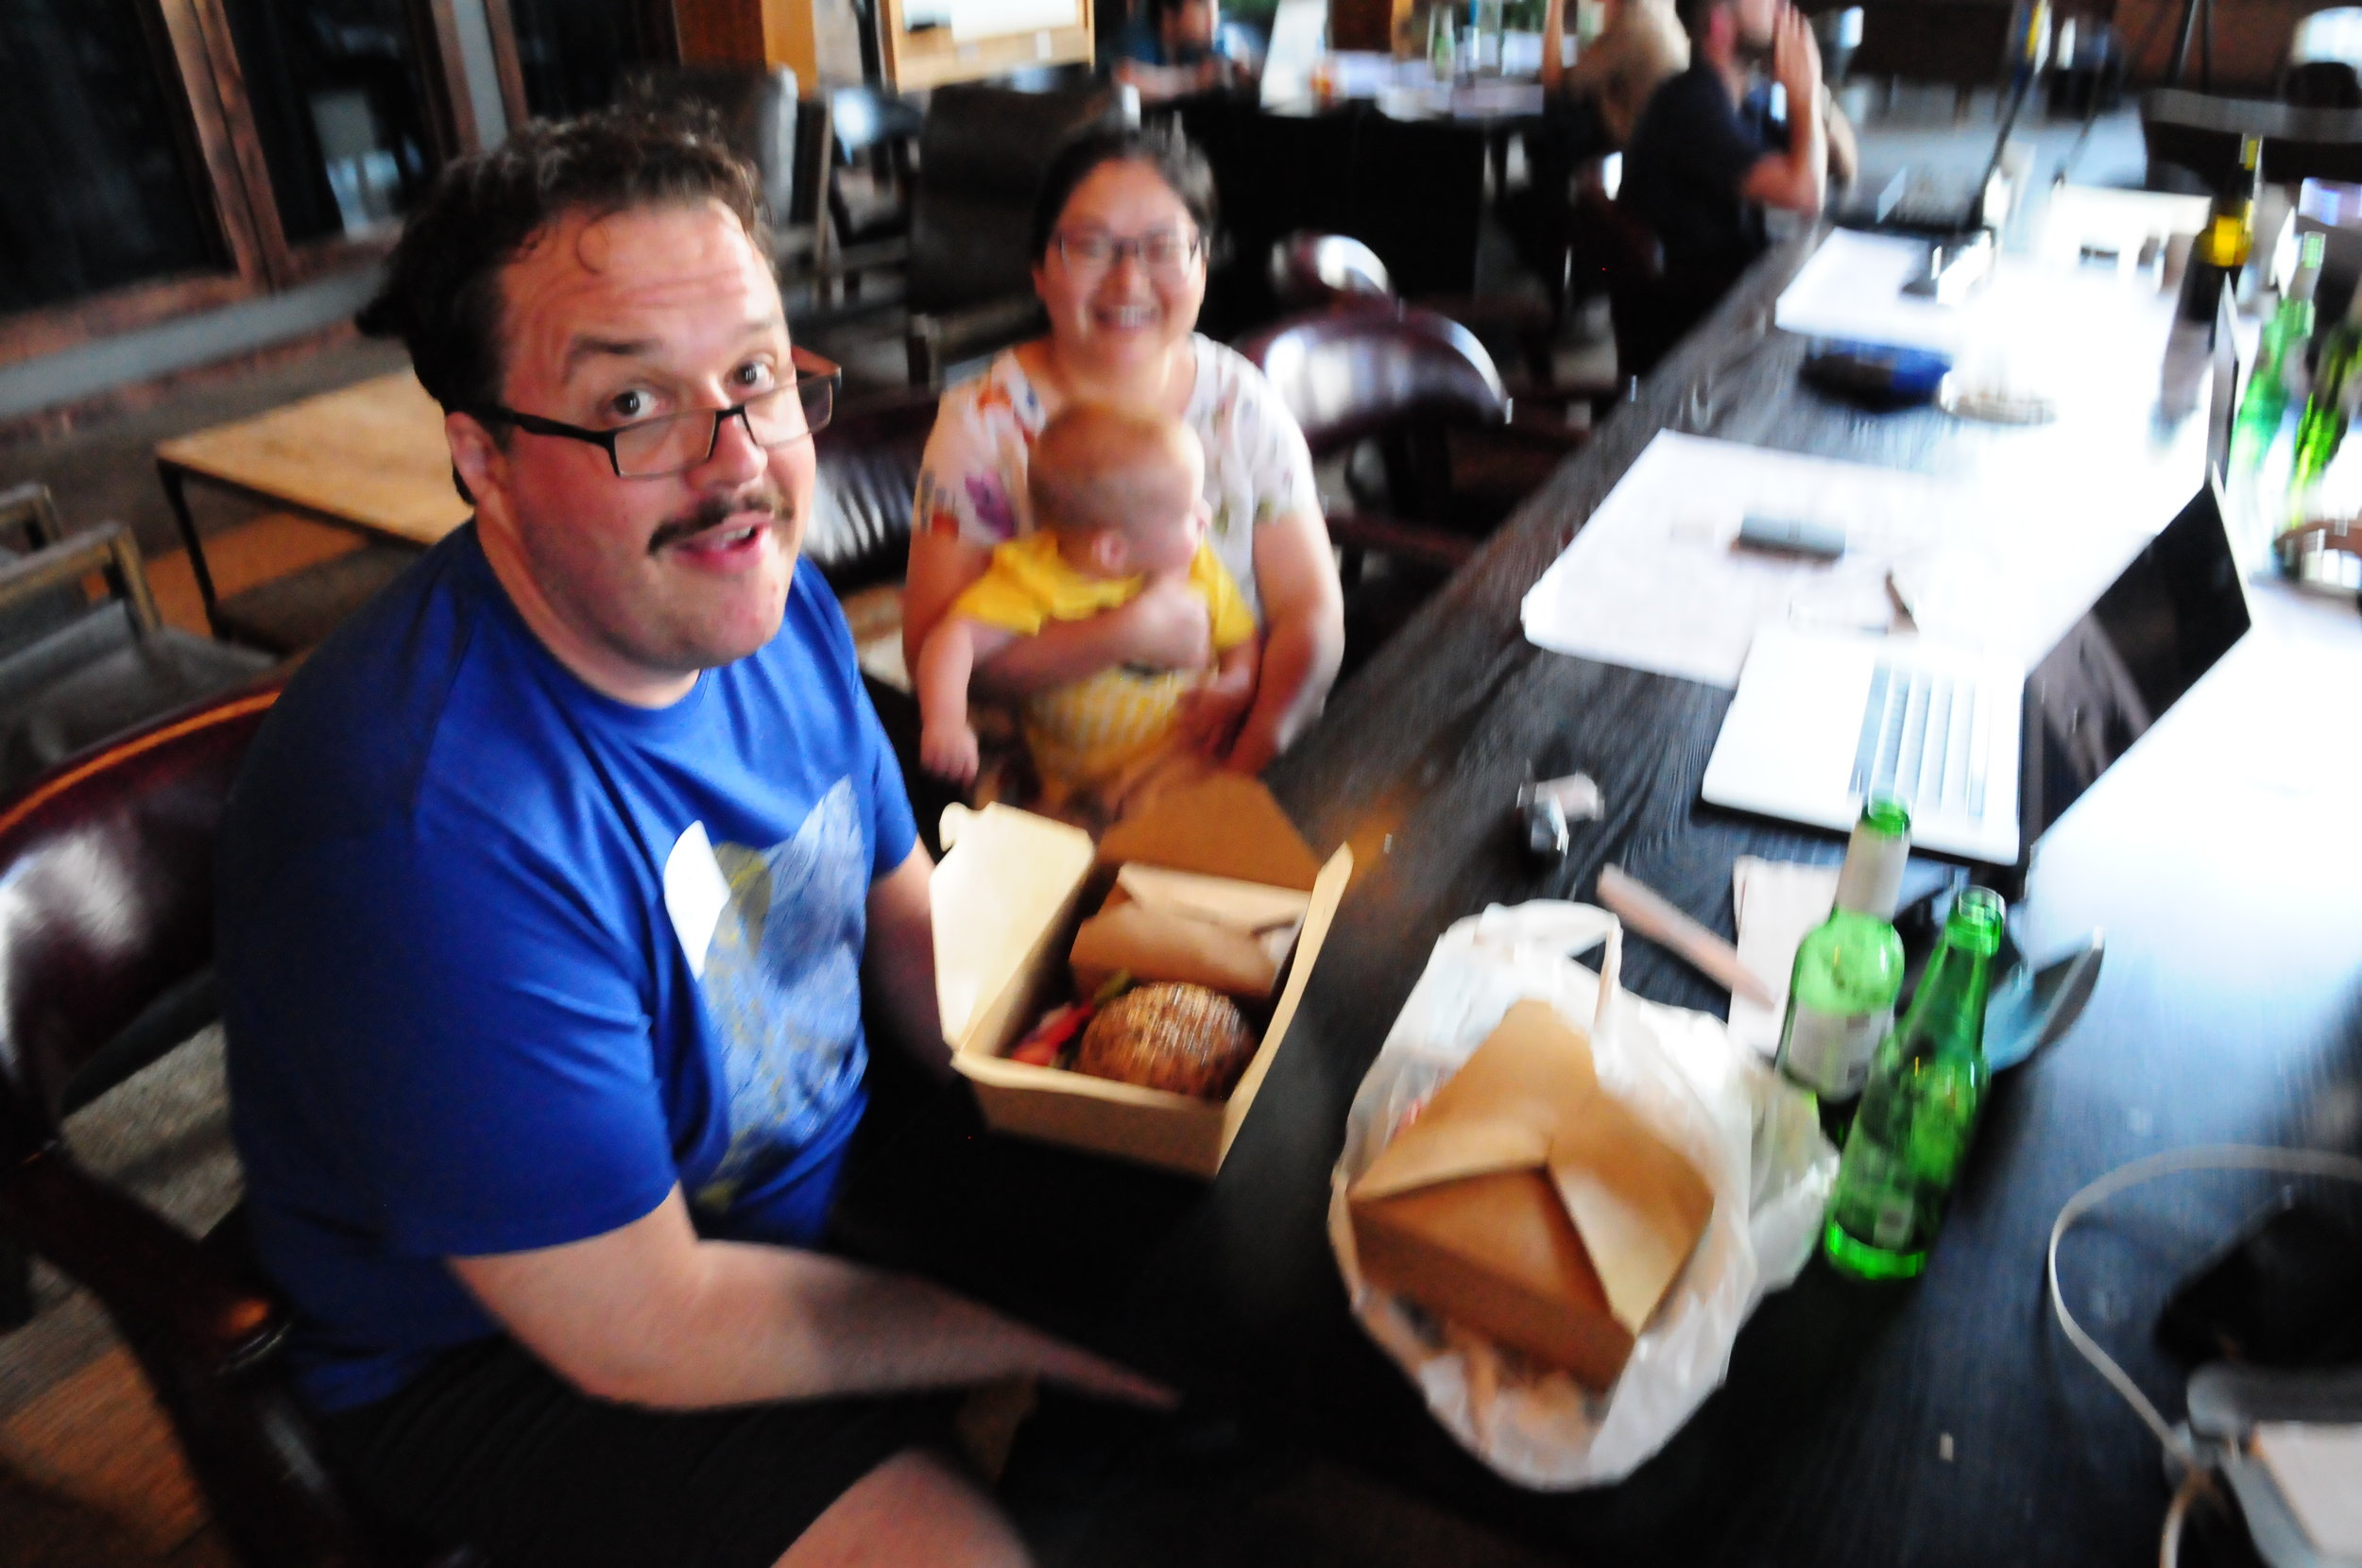
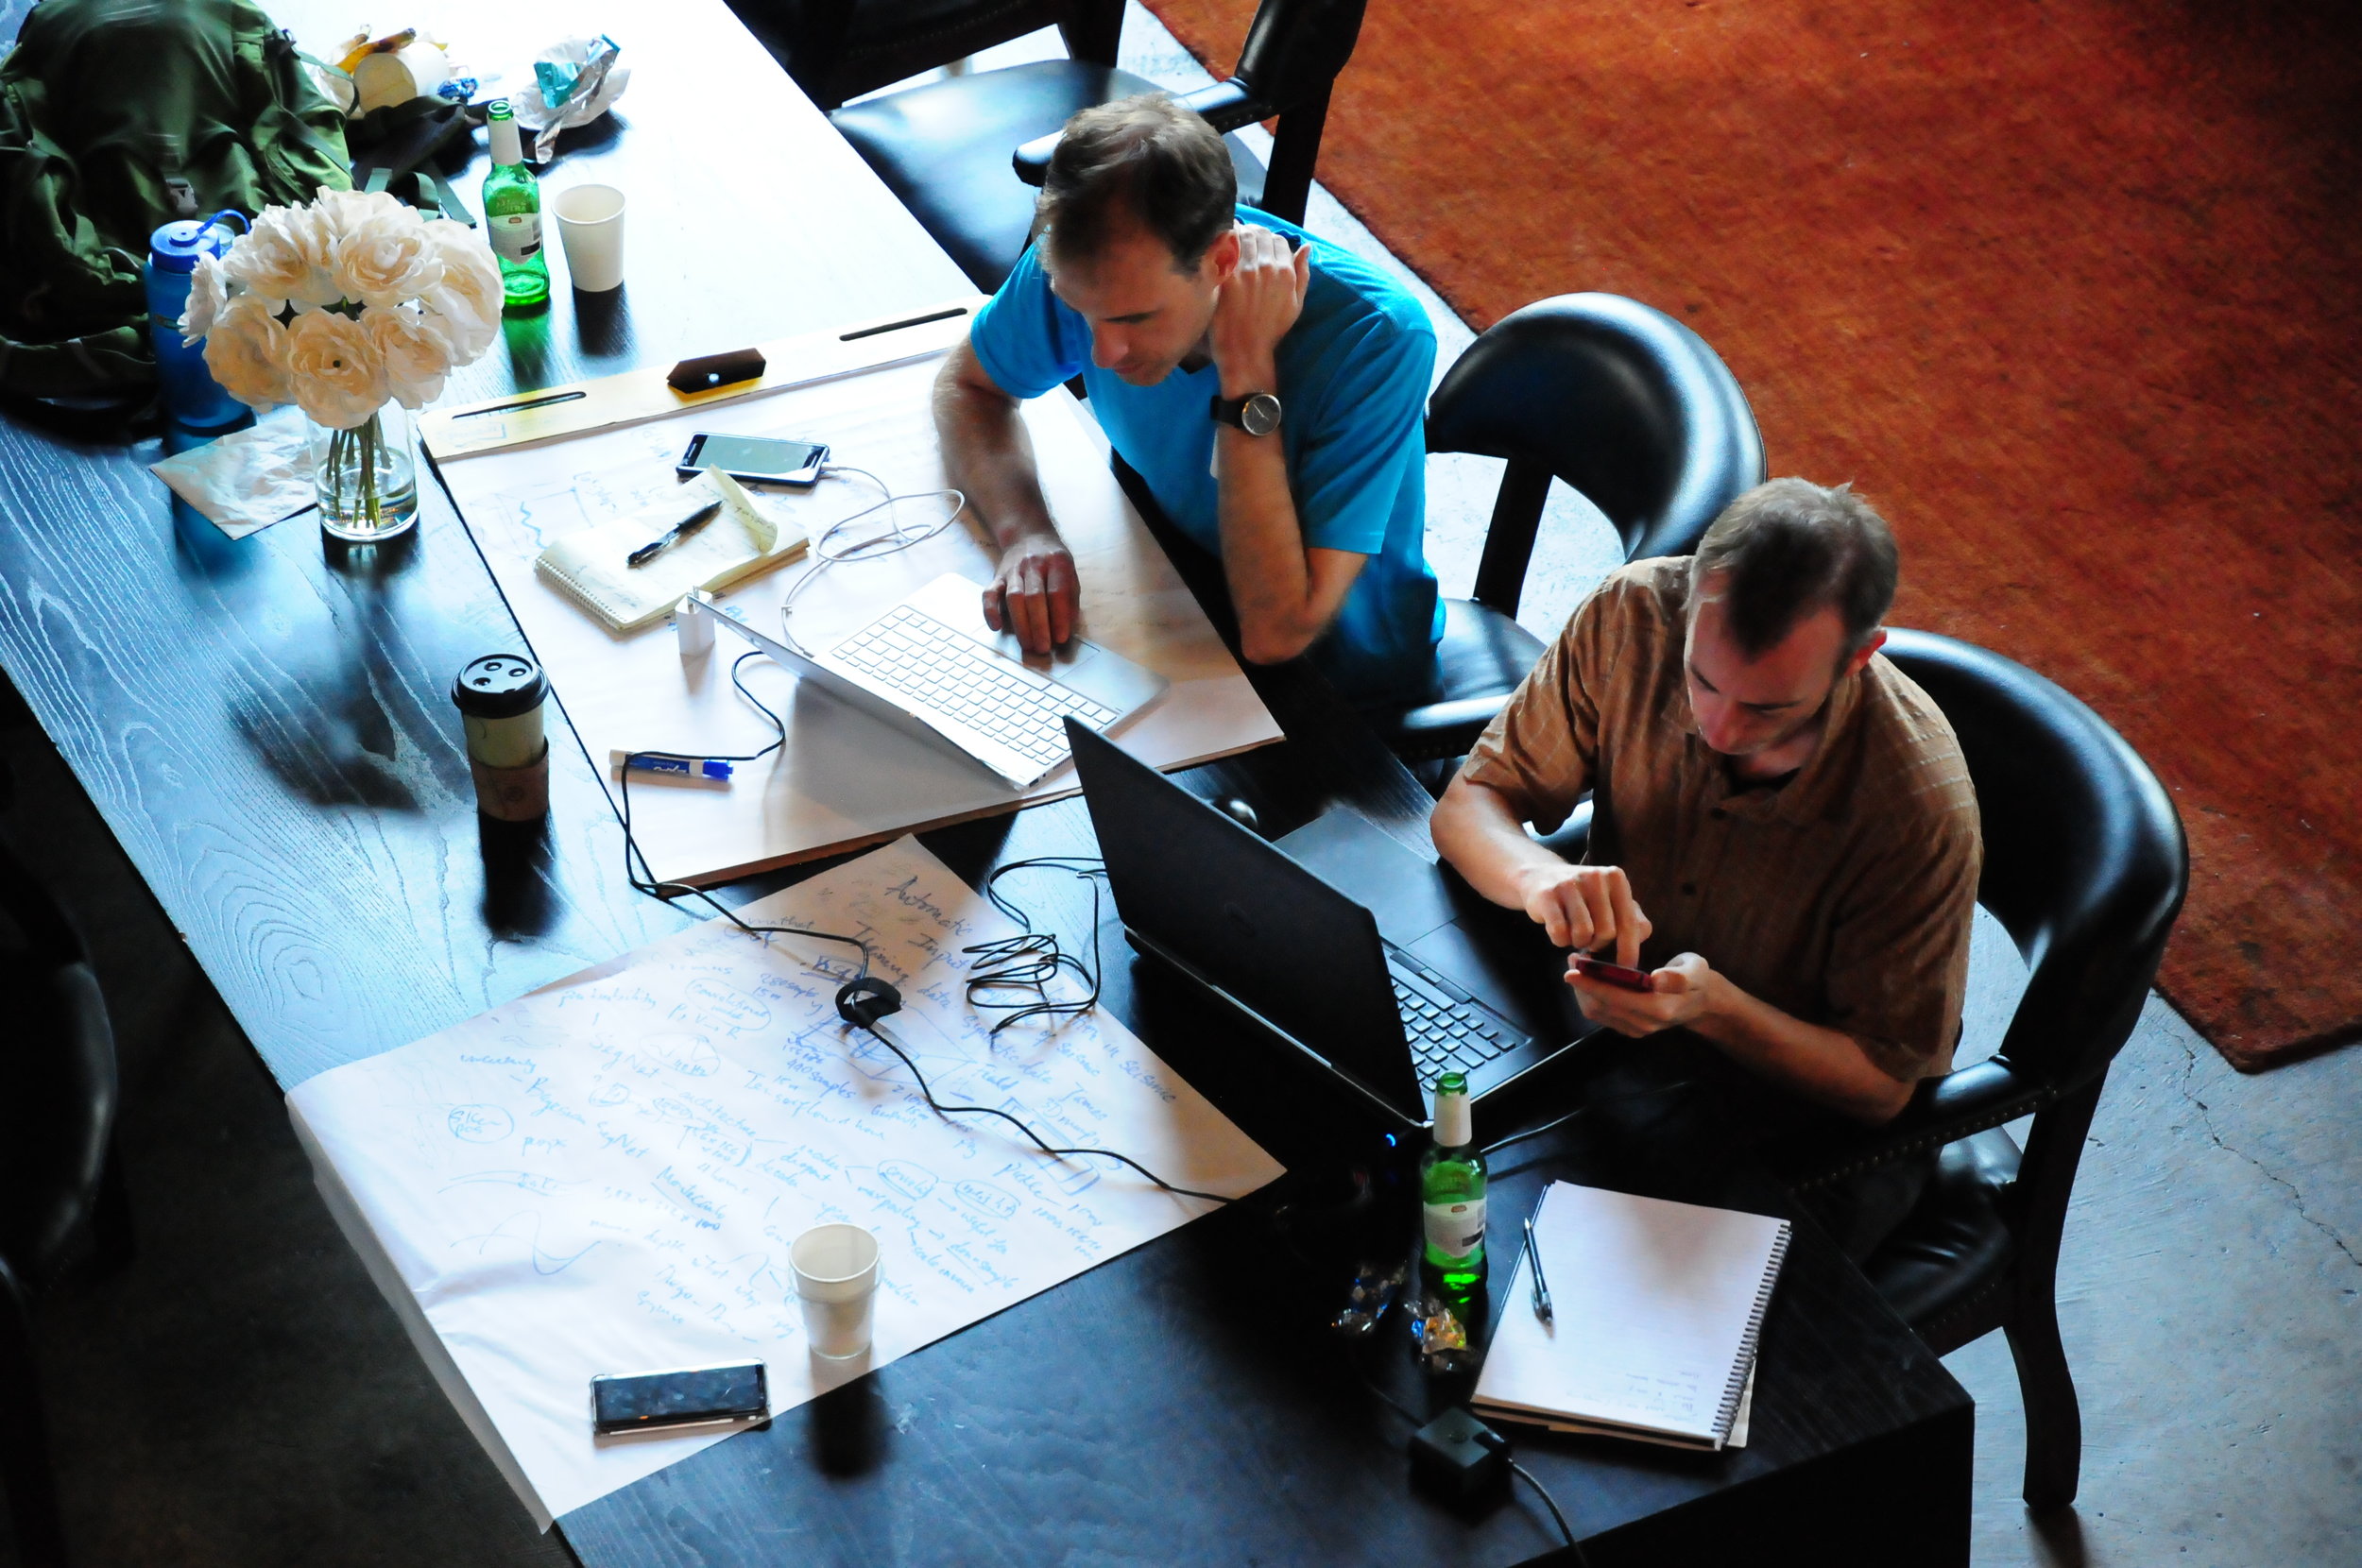
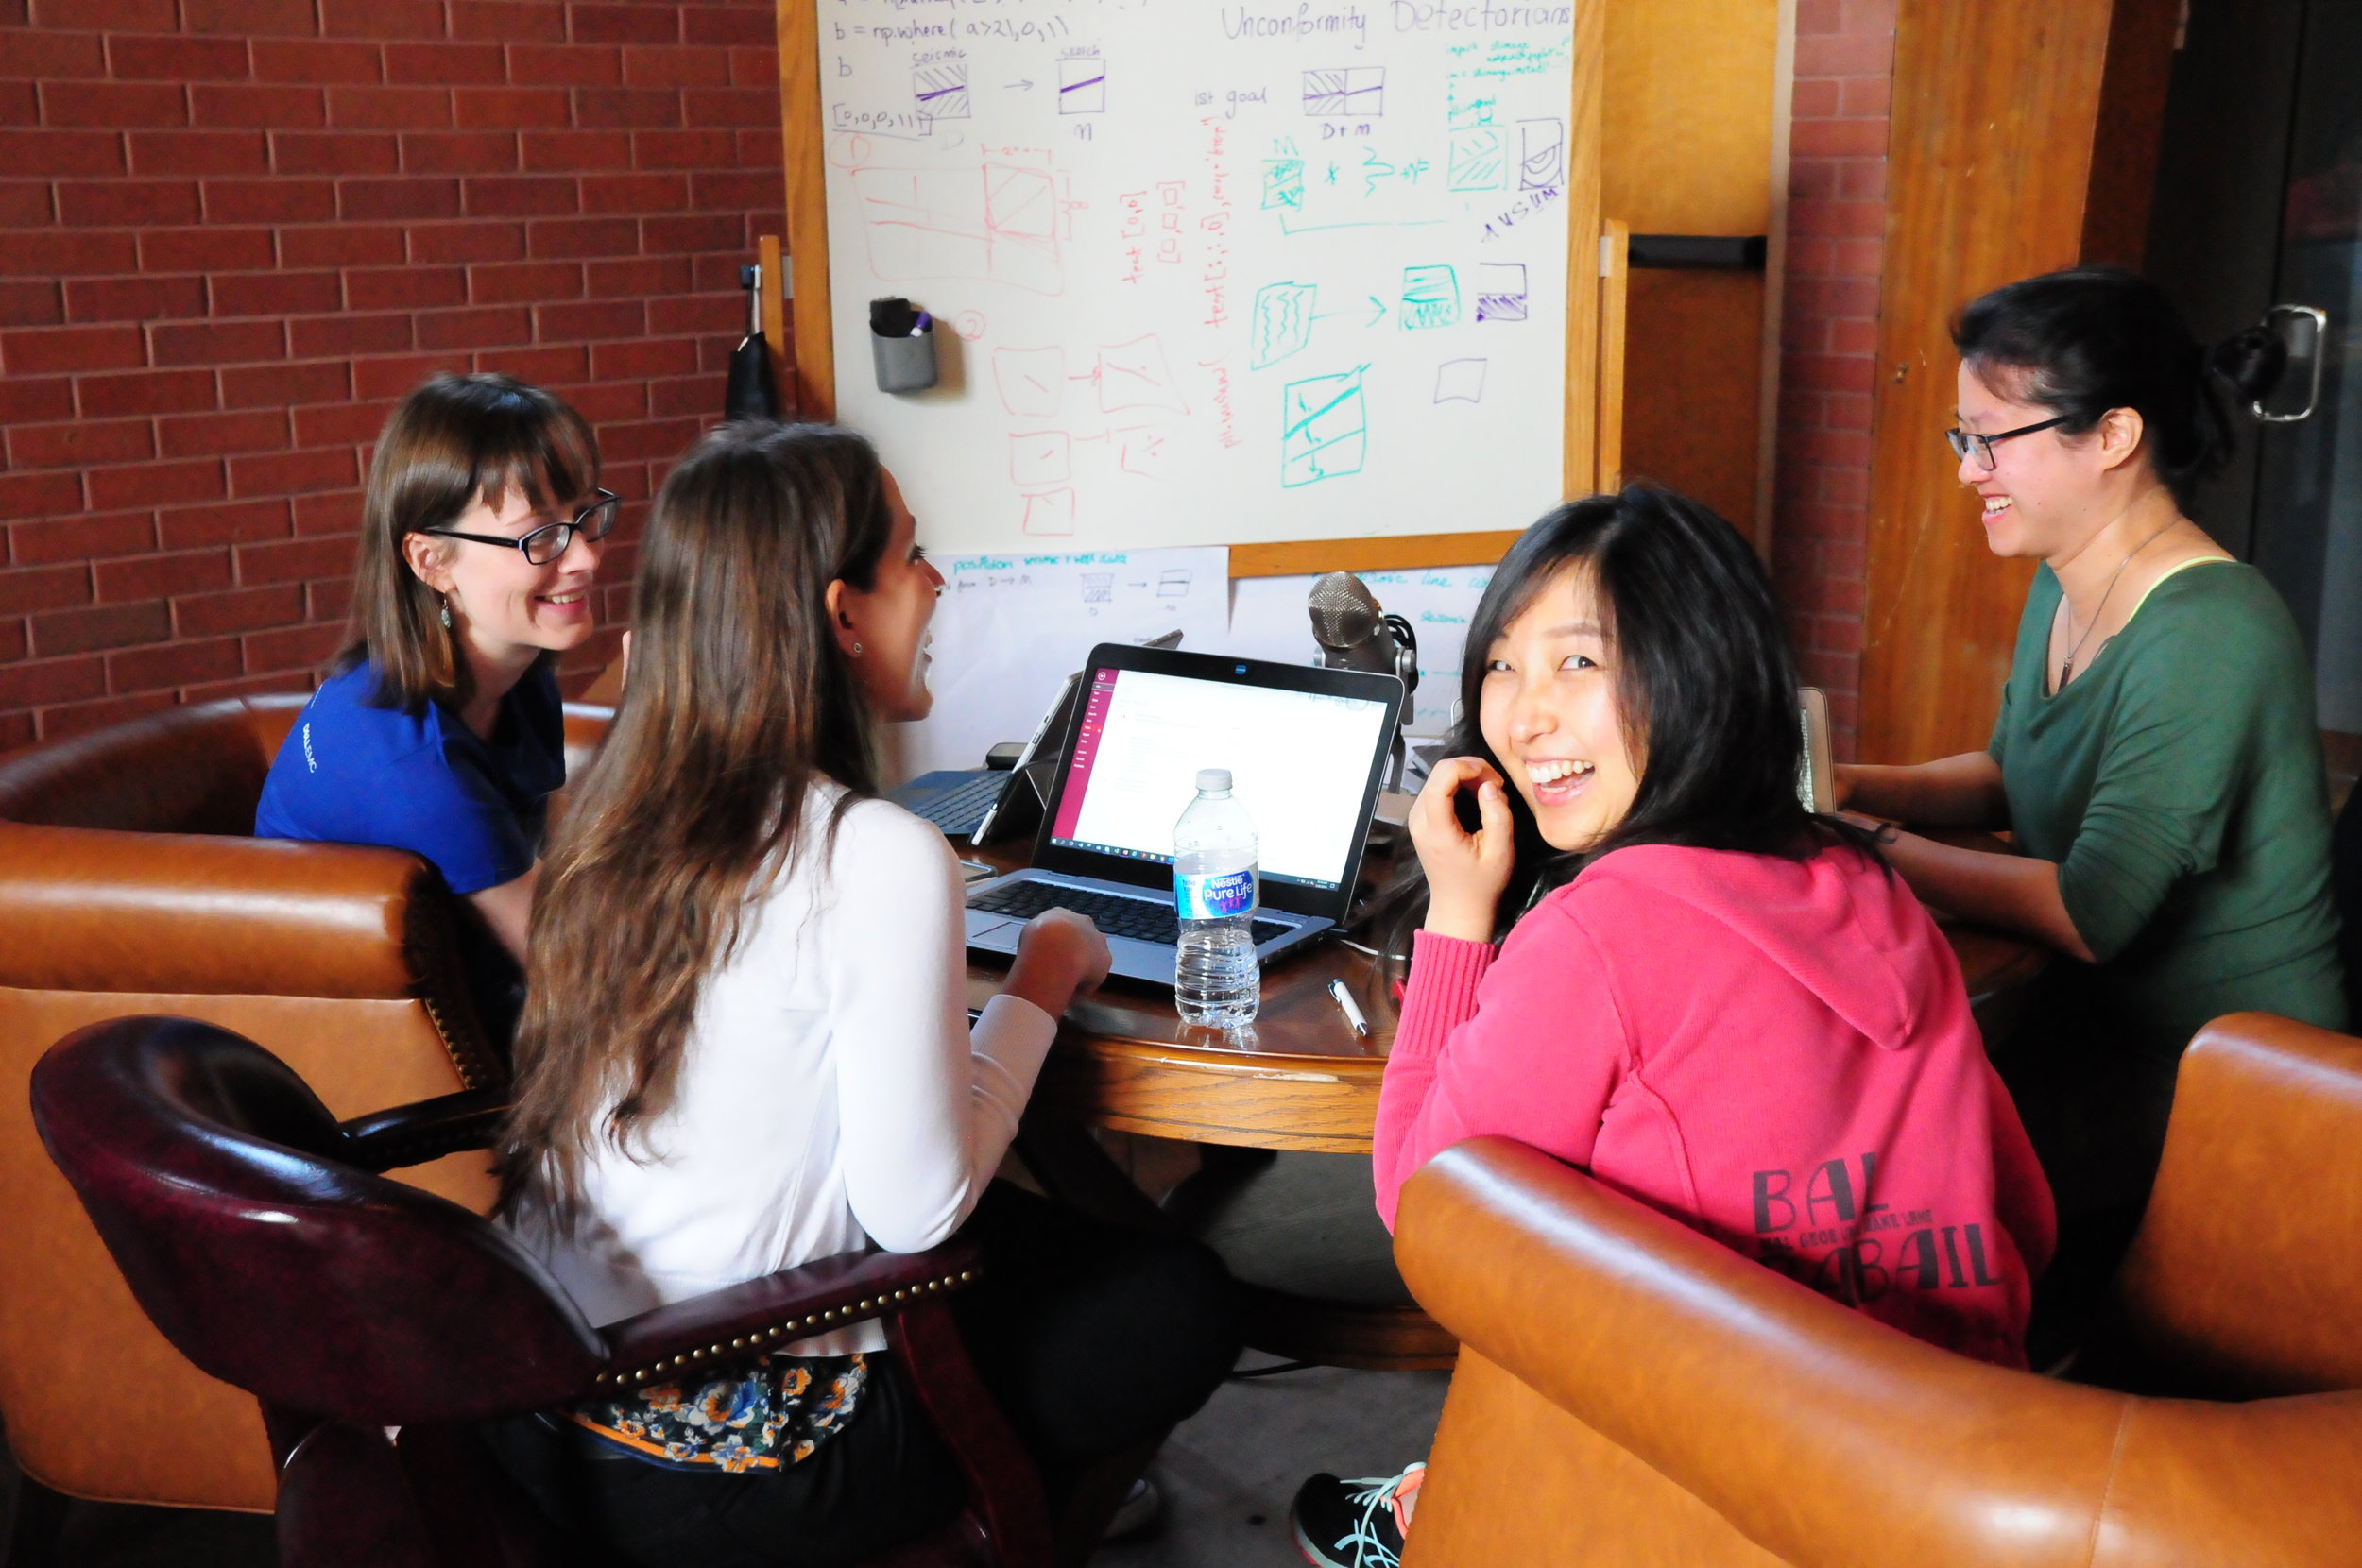
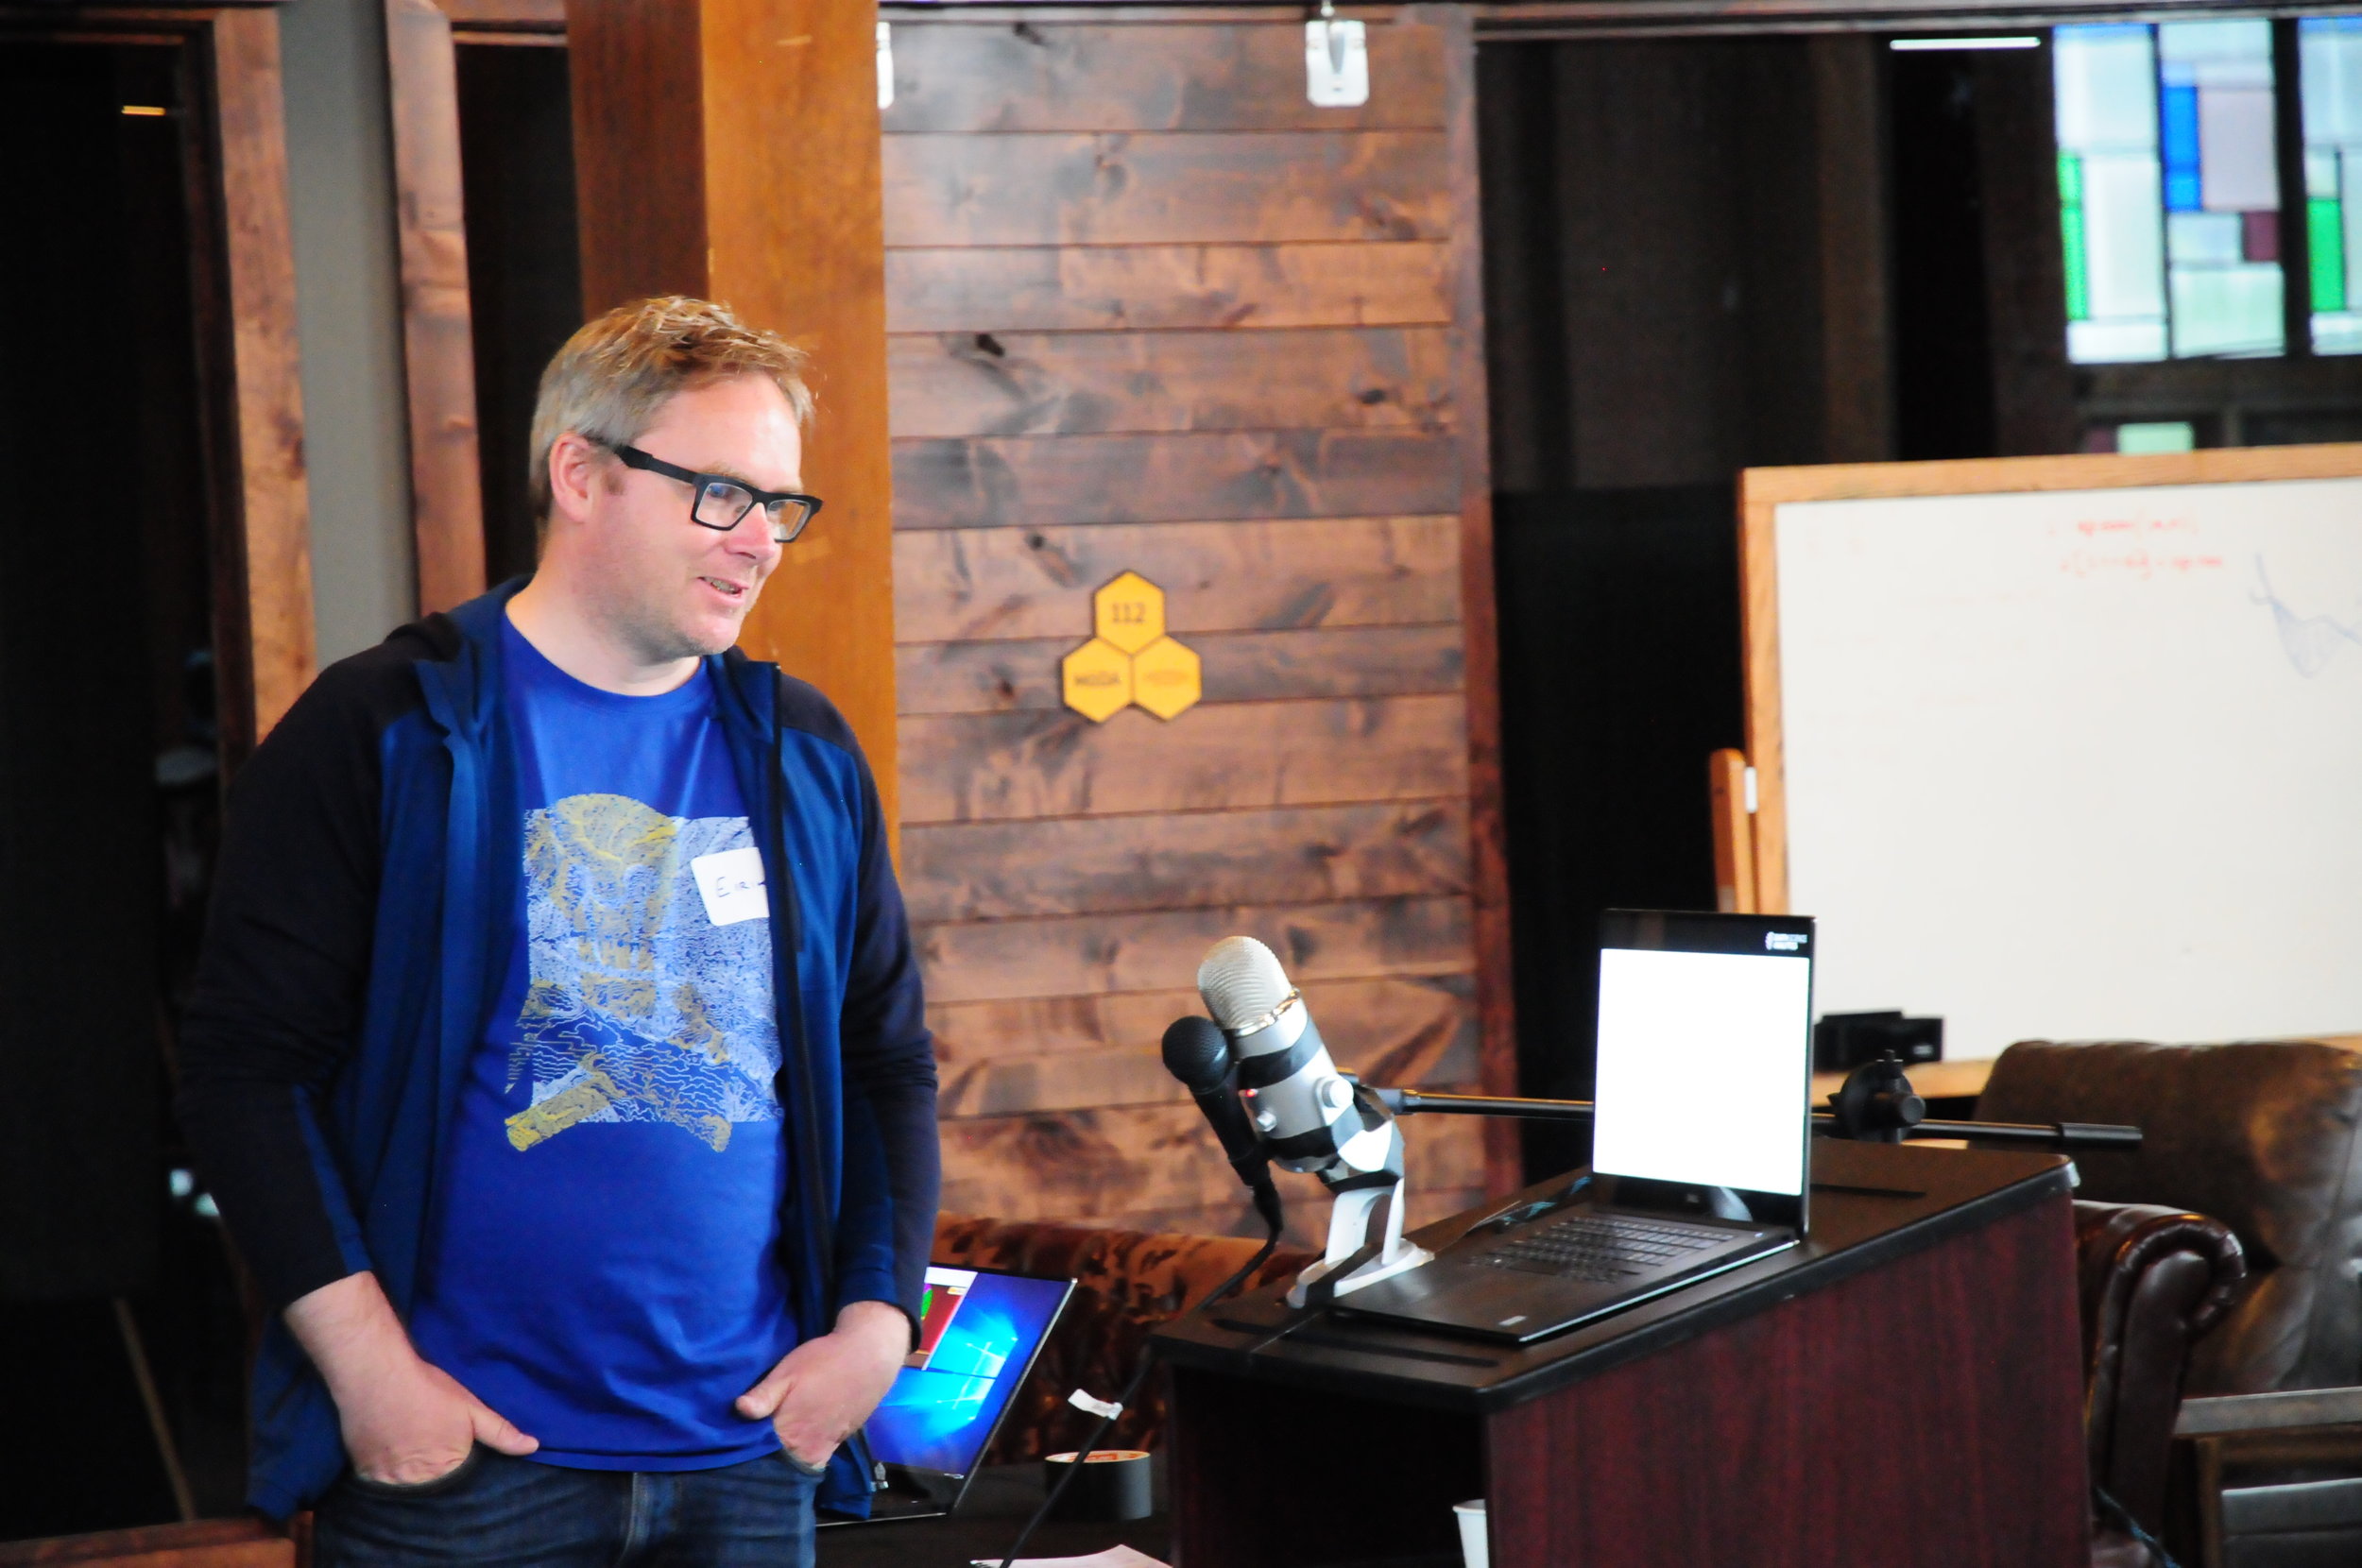
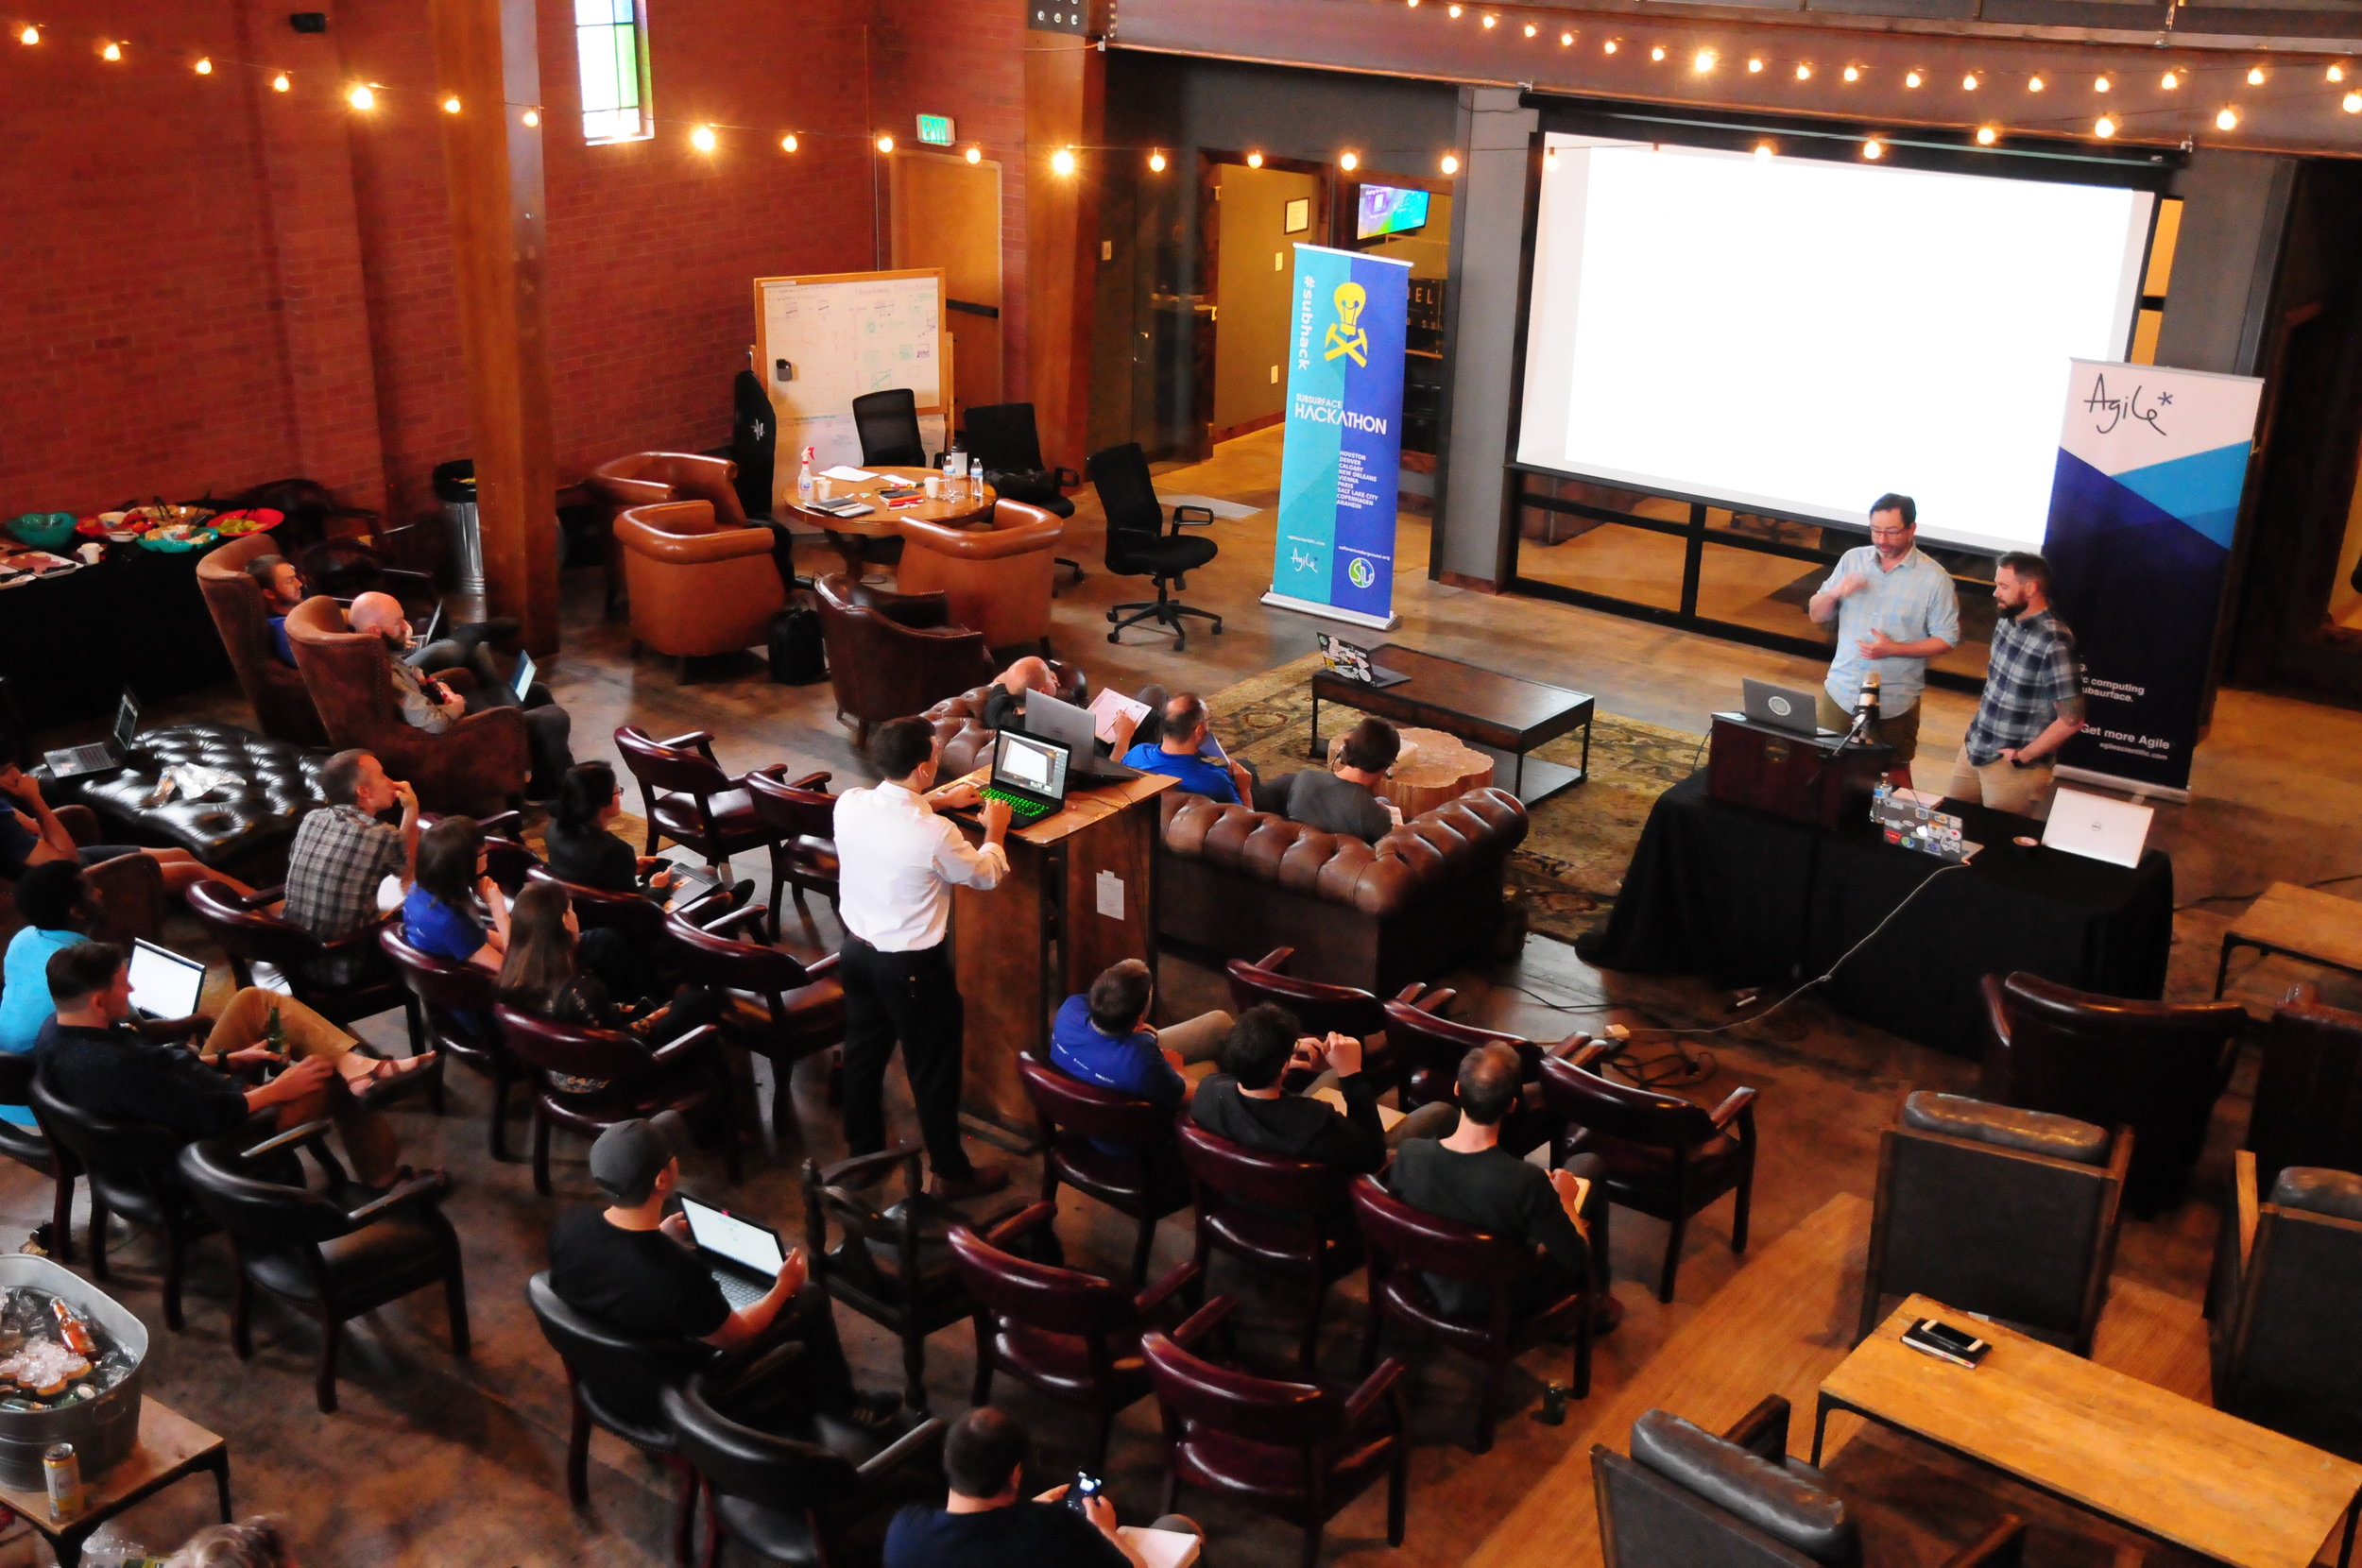
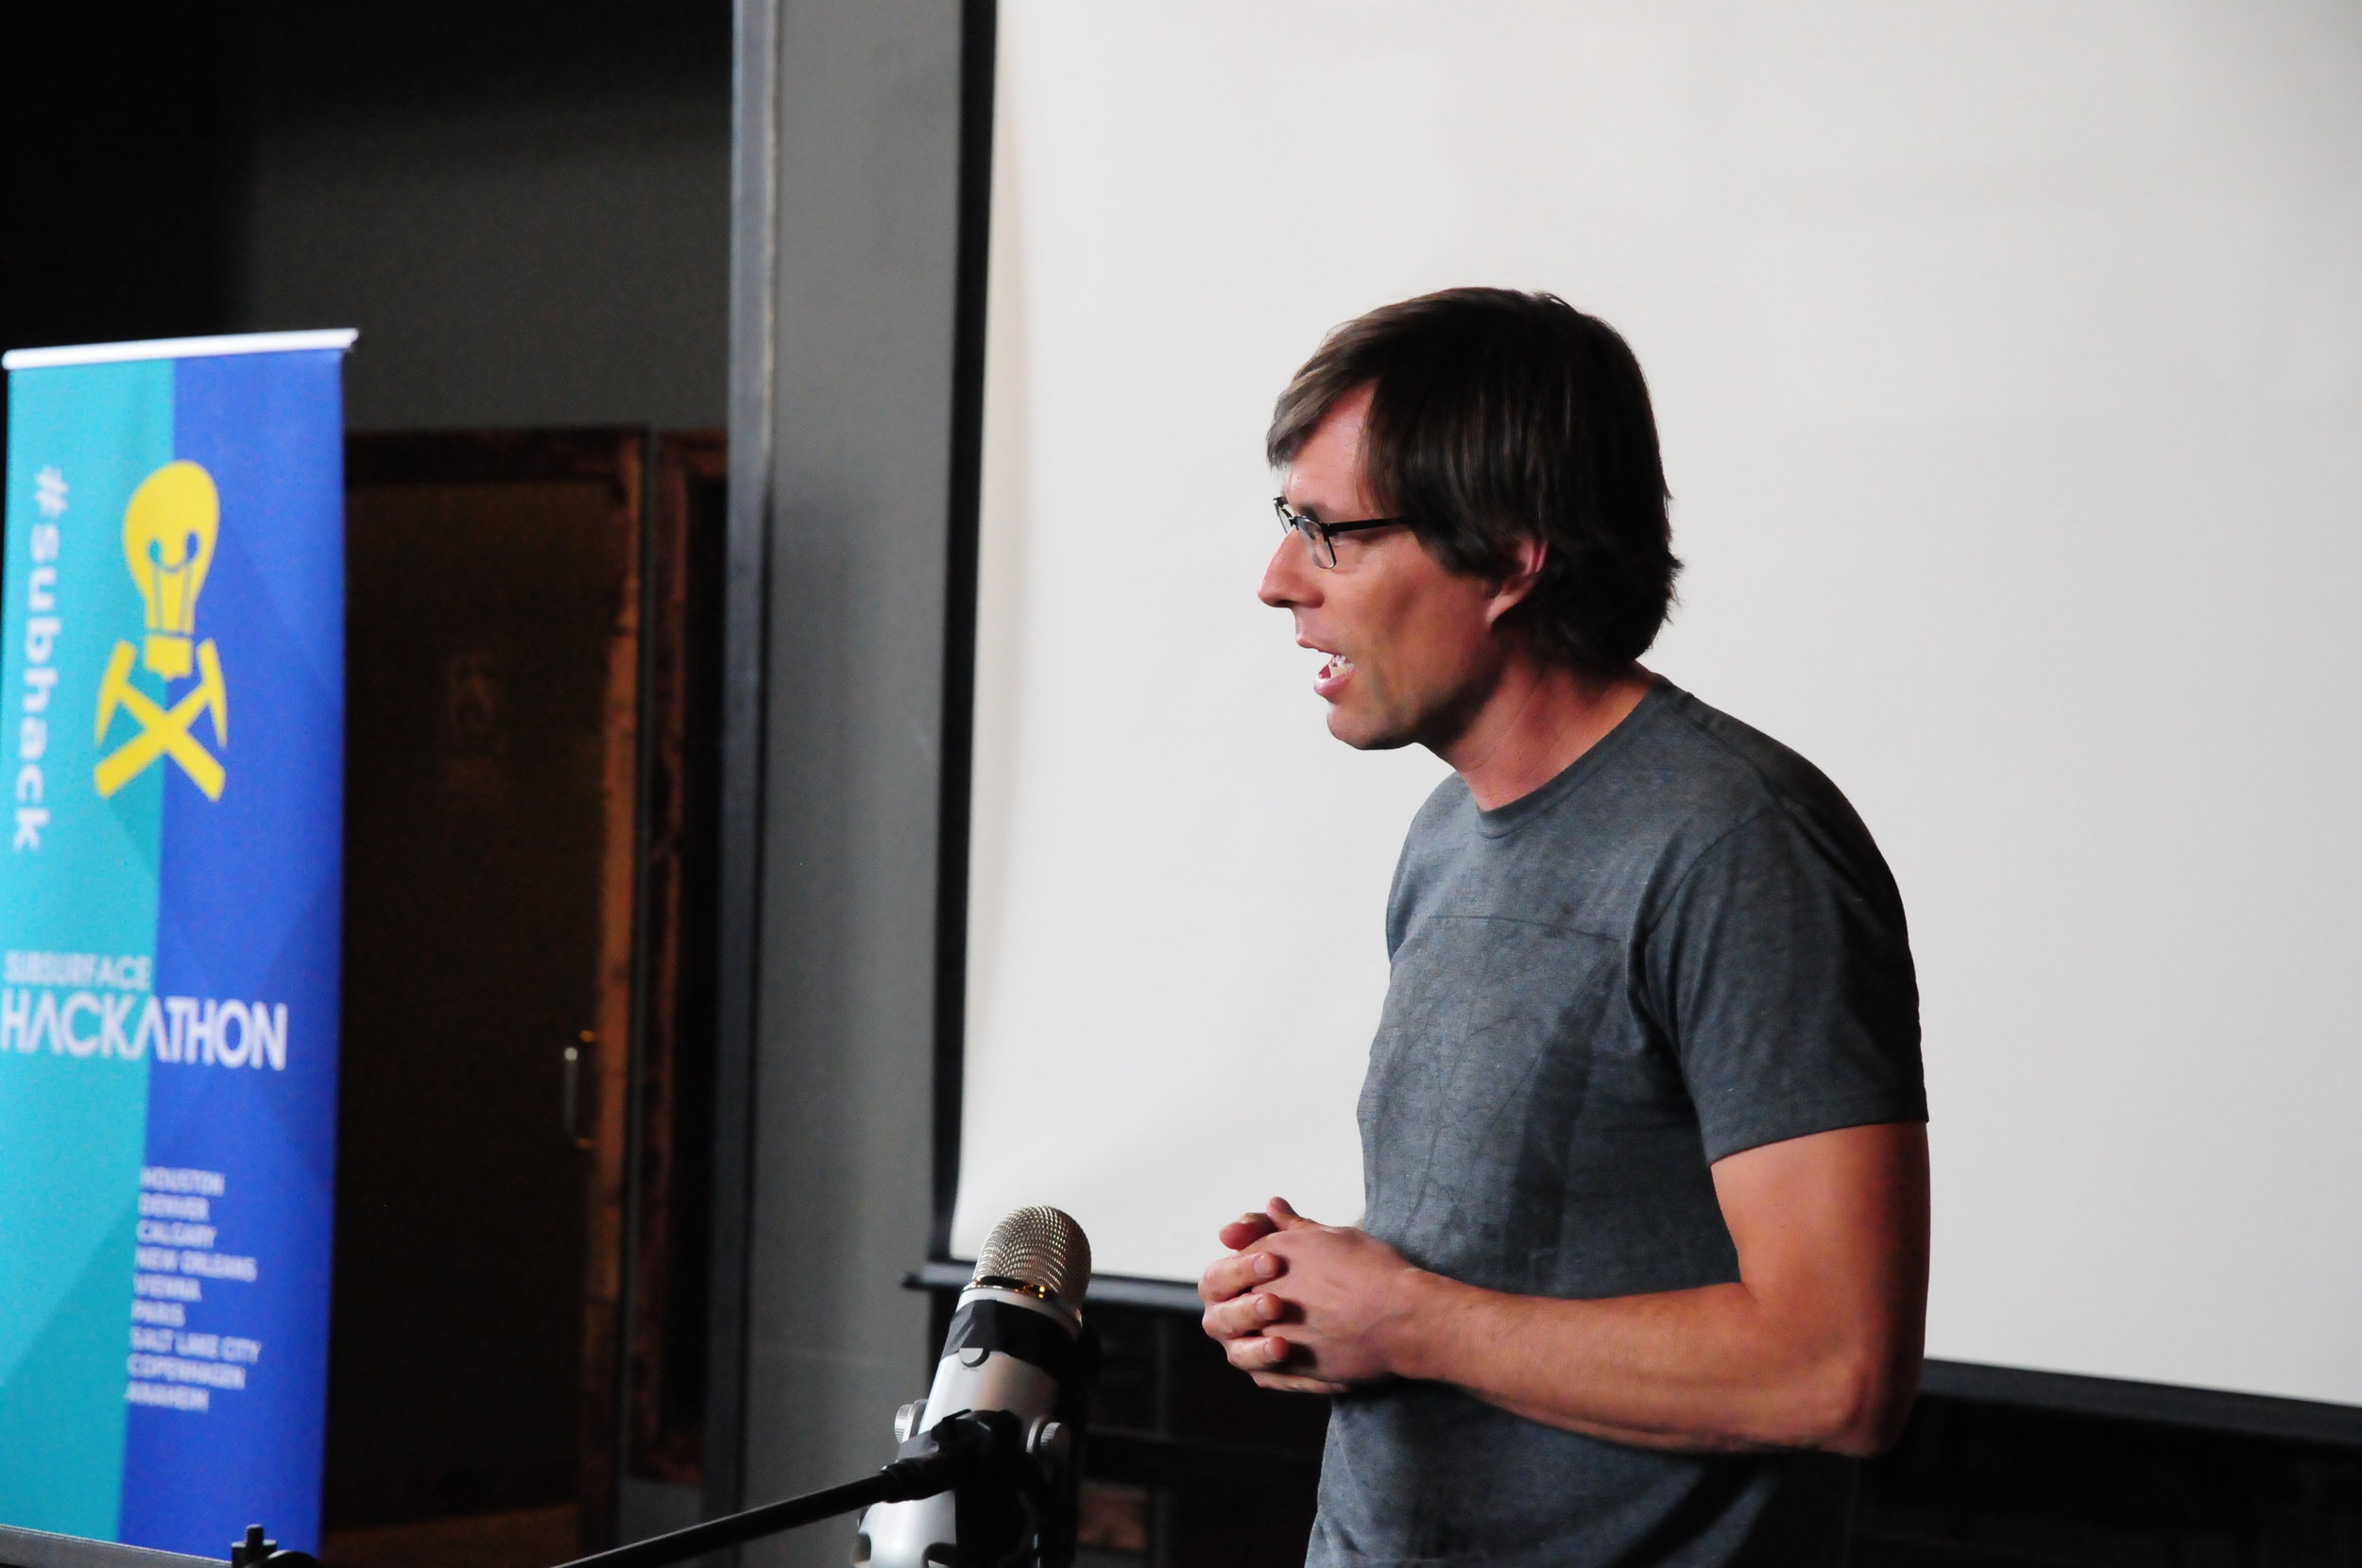
Thirty geoscientist-coders swarmed into Salt Lake City this past weekend to hack at Church & State, a co-working space in a converted church. There, we spent two days appealing to the almighty power of machine learning.

Nine teams worked on the usual rich variety of projects around the theme. Projects included AIs that pick unconformities, natural language processing to describe stratigraphy, and designing an open data platform in service of machine learning. 

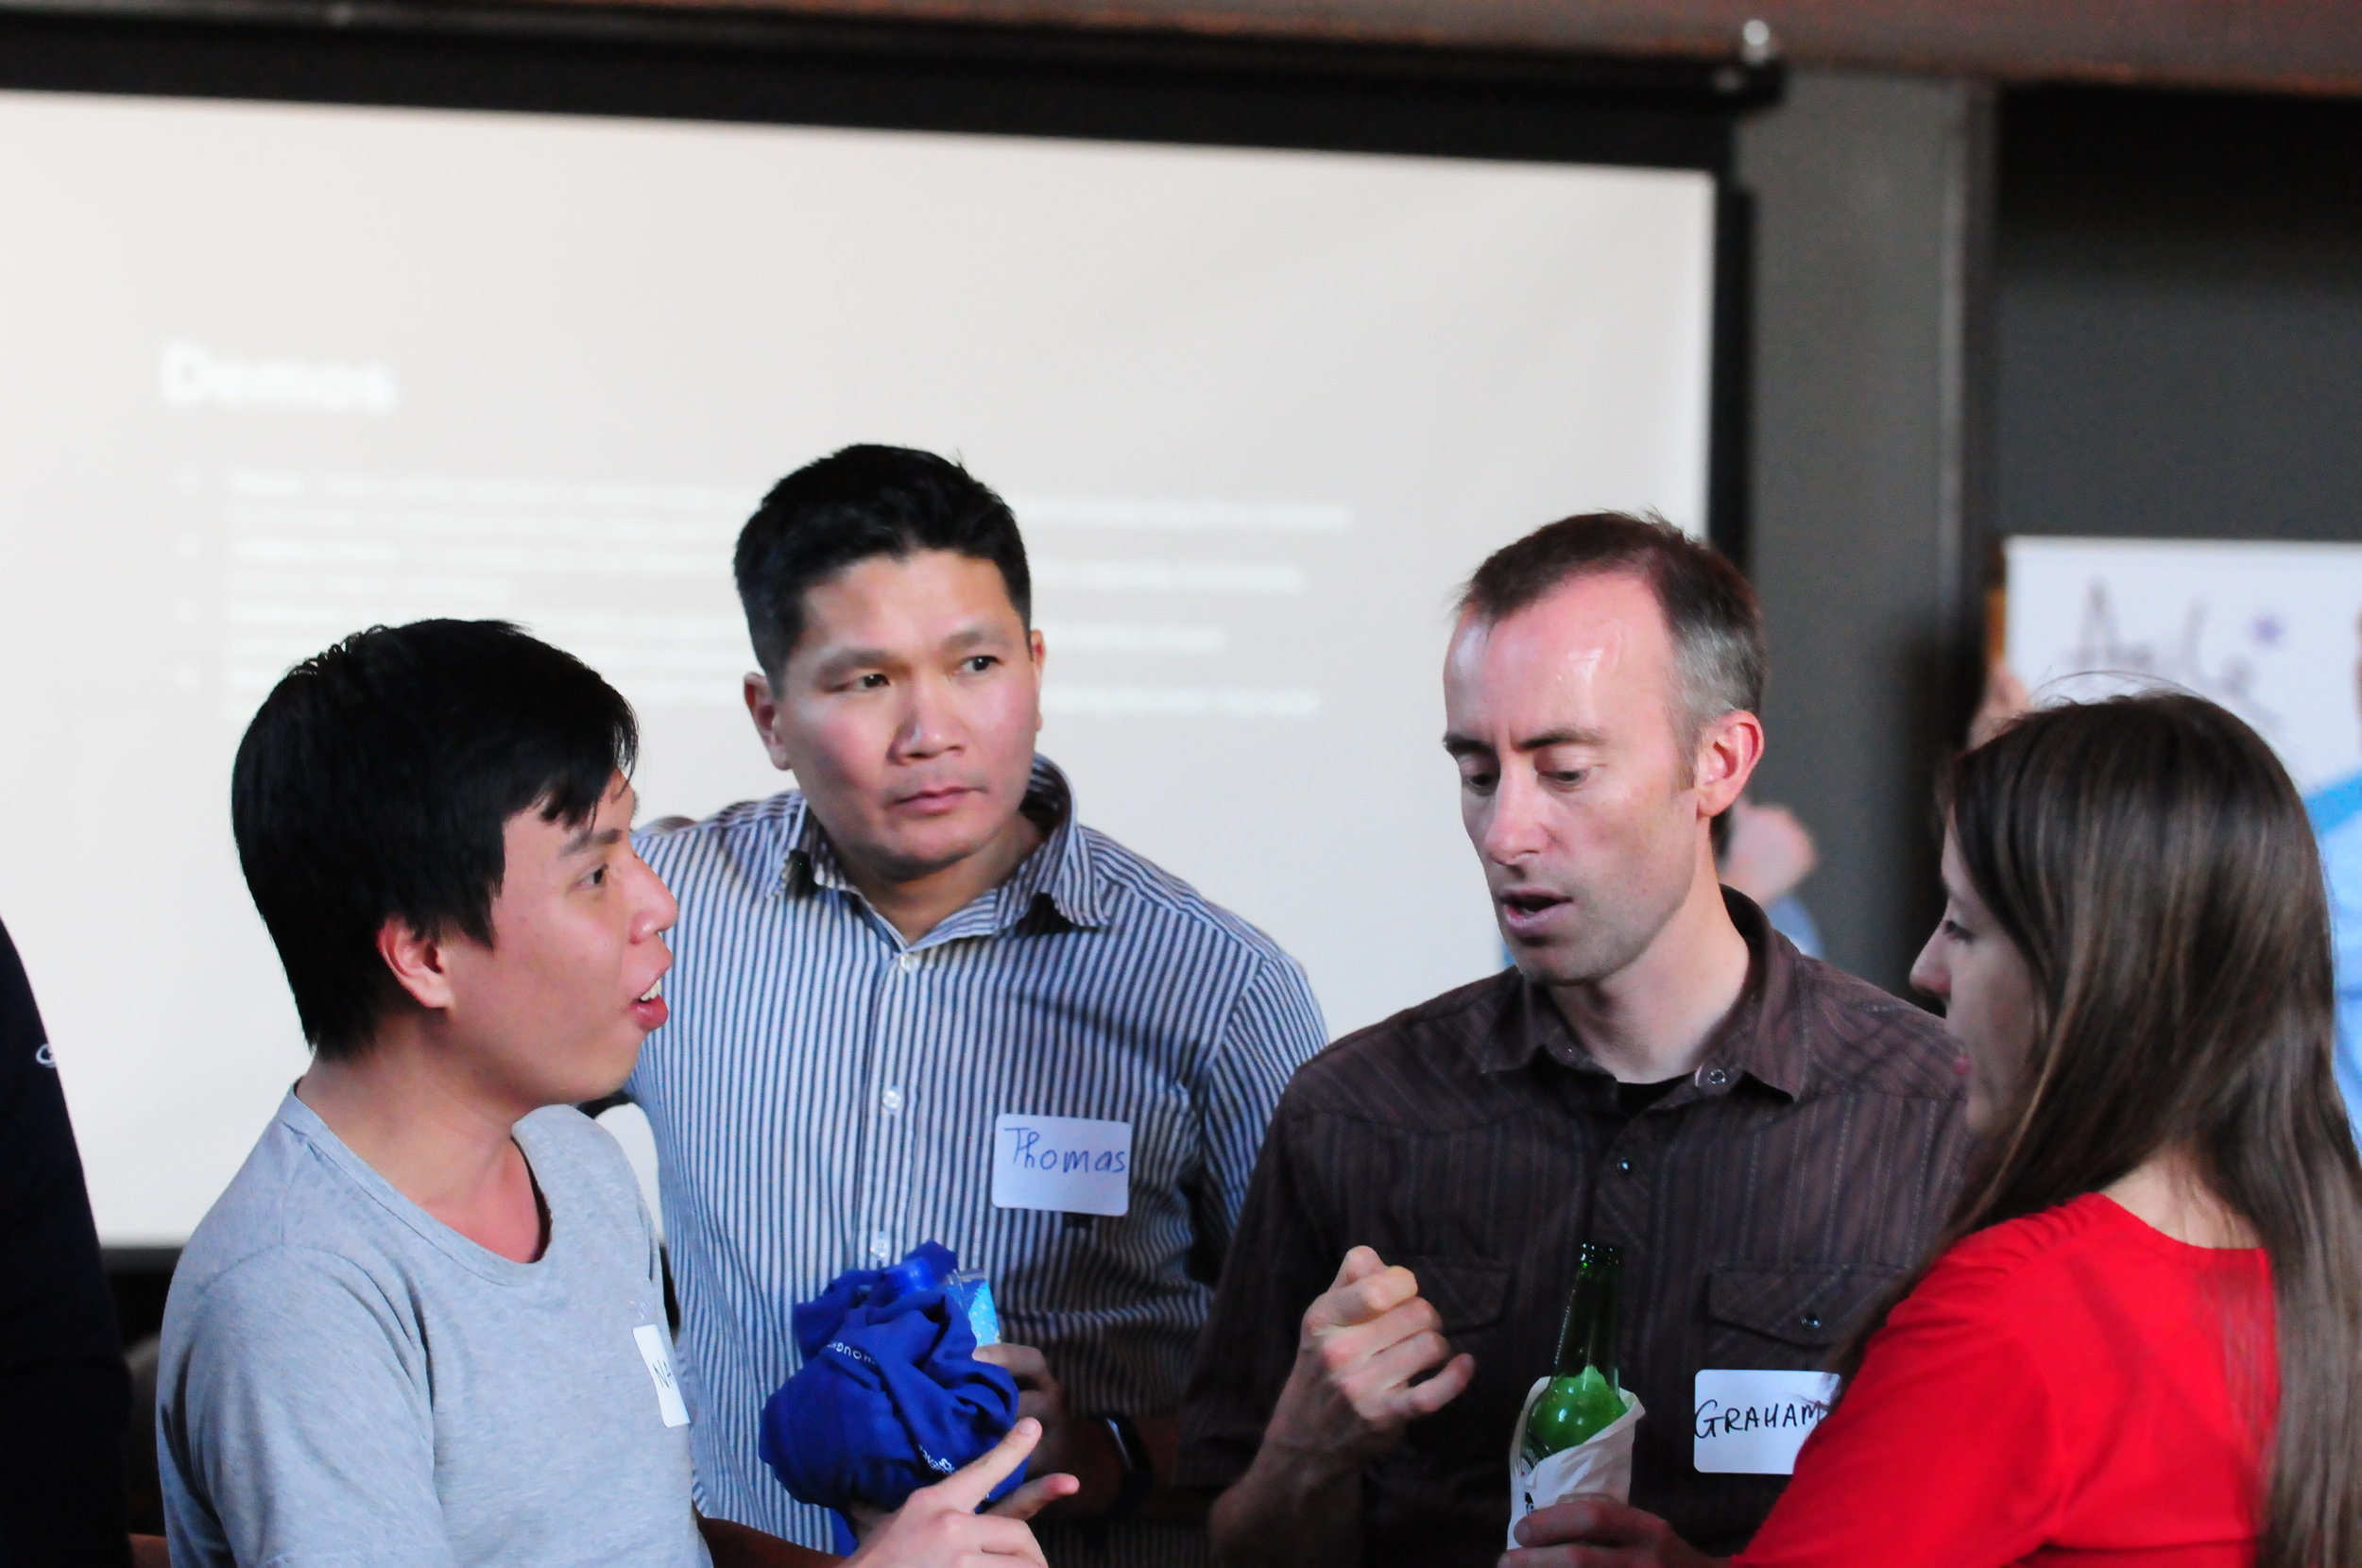
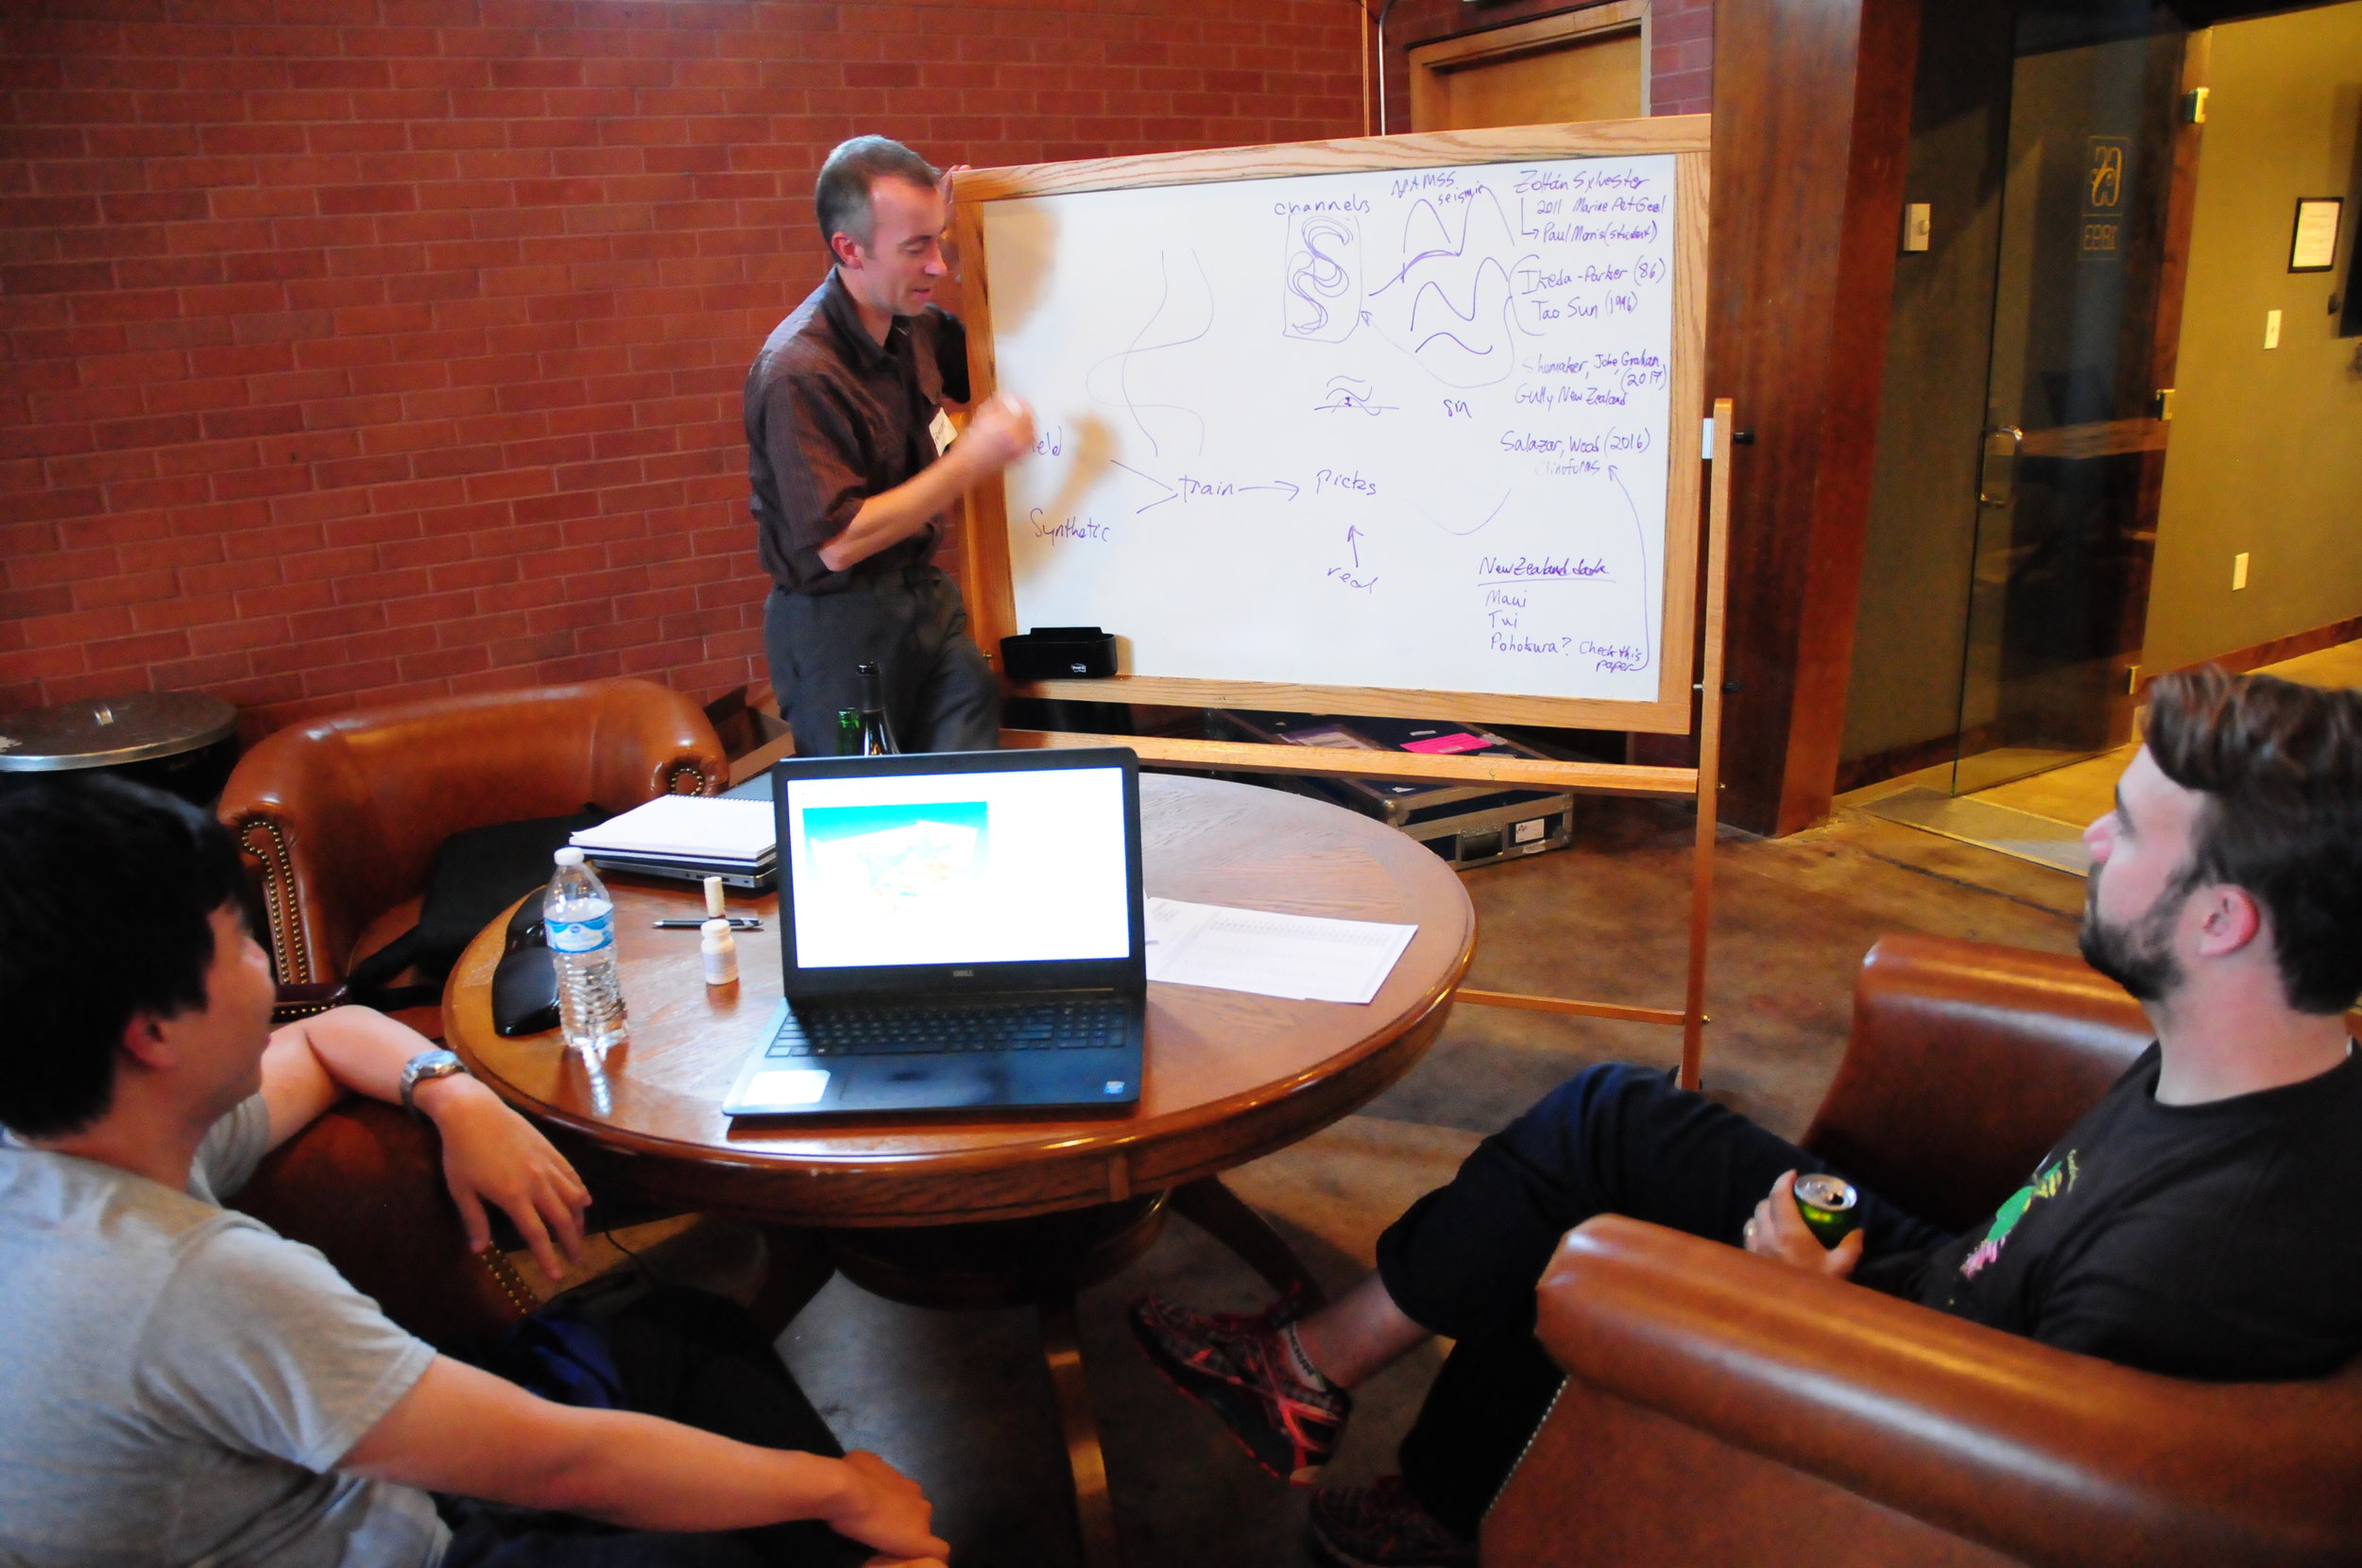
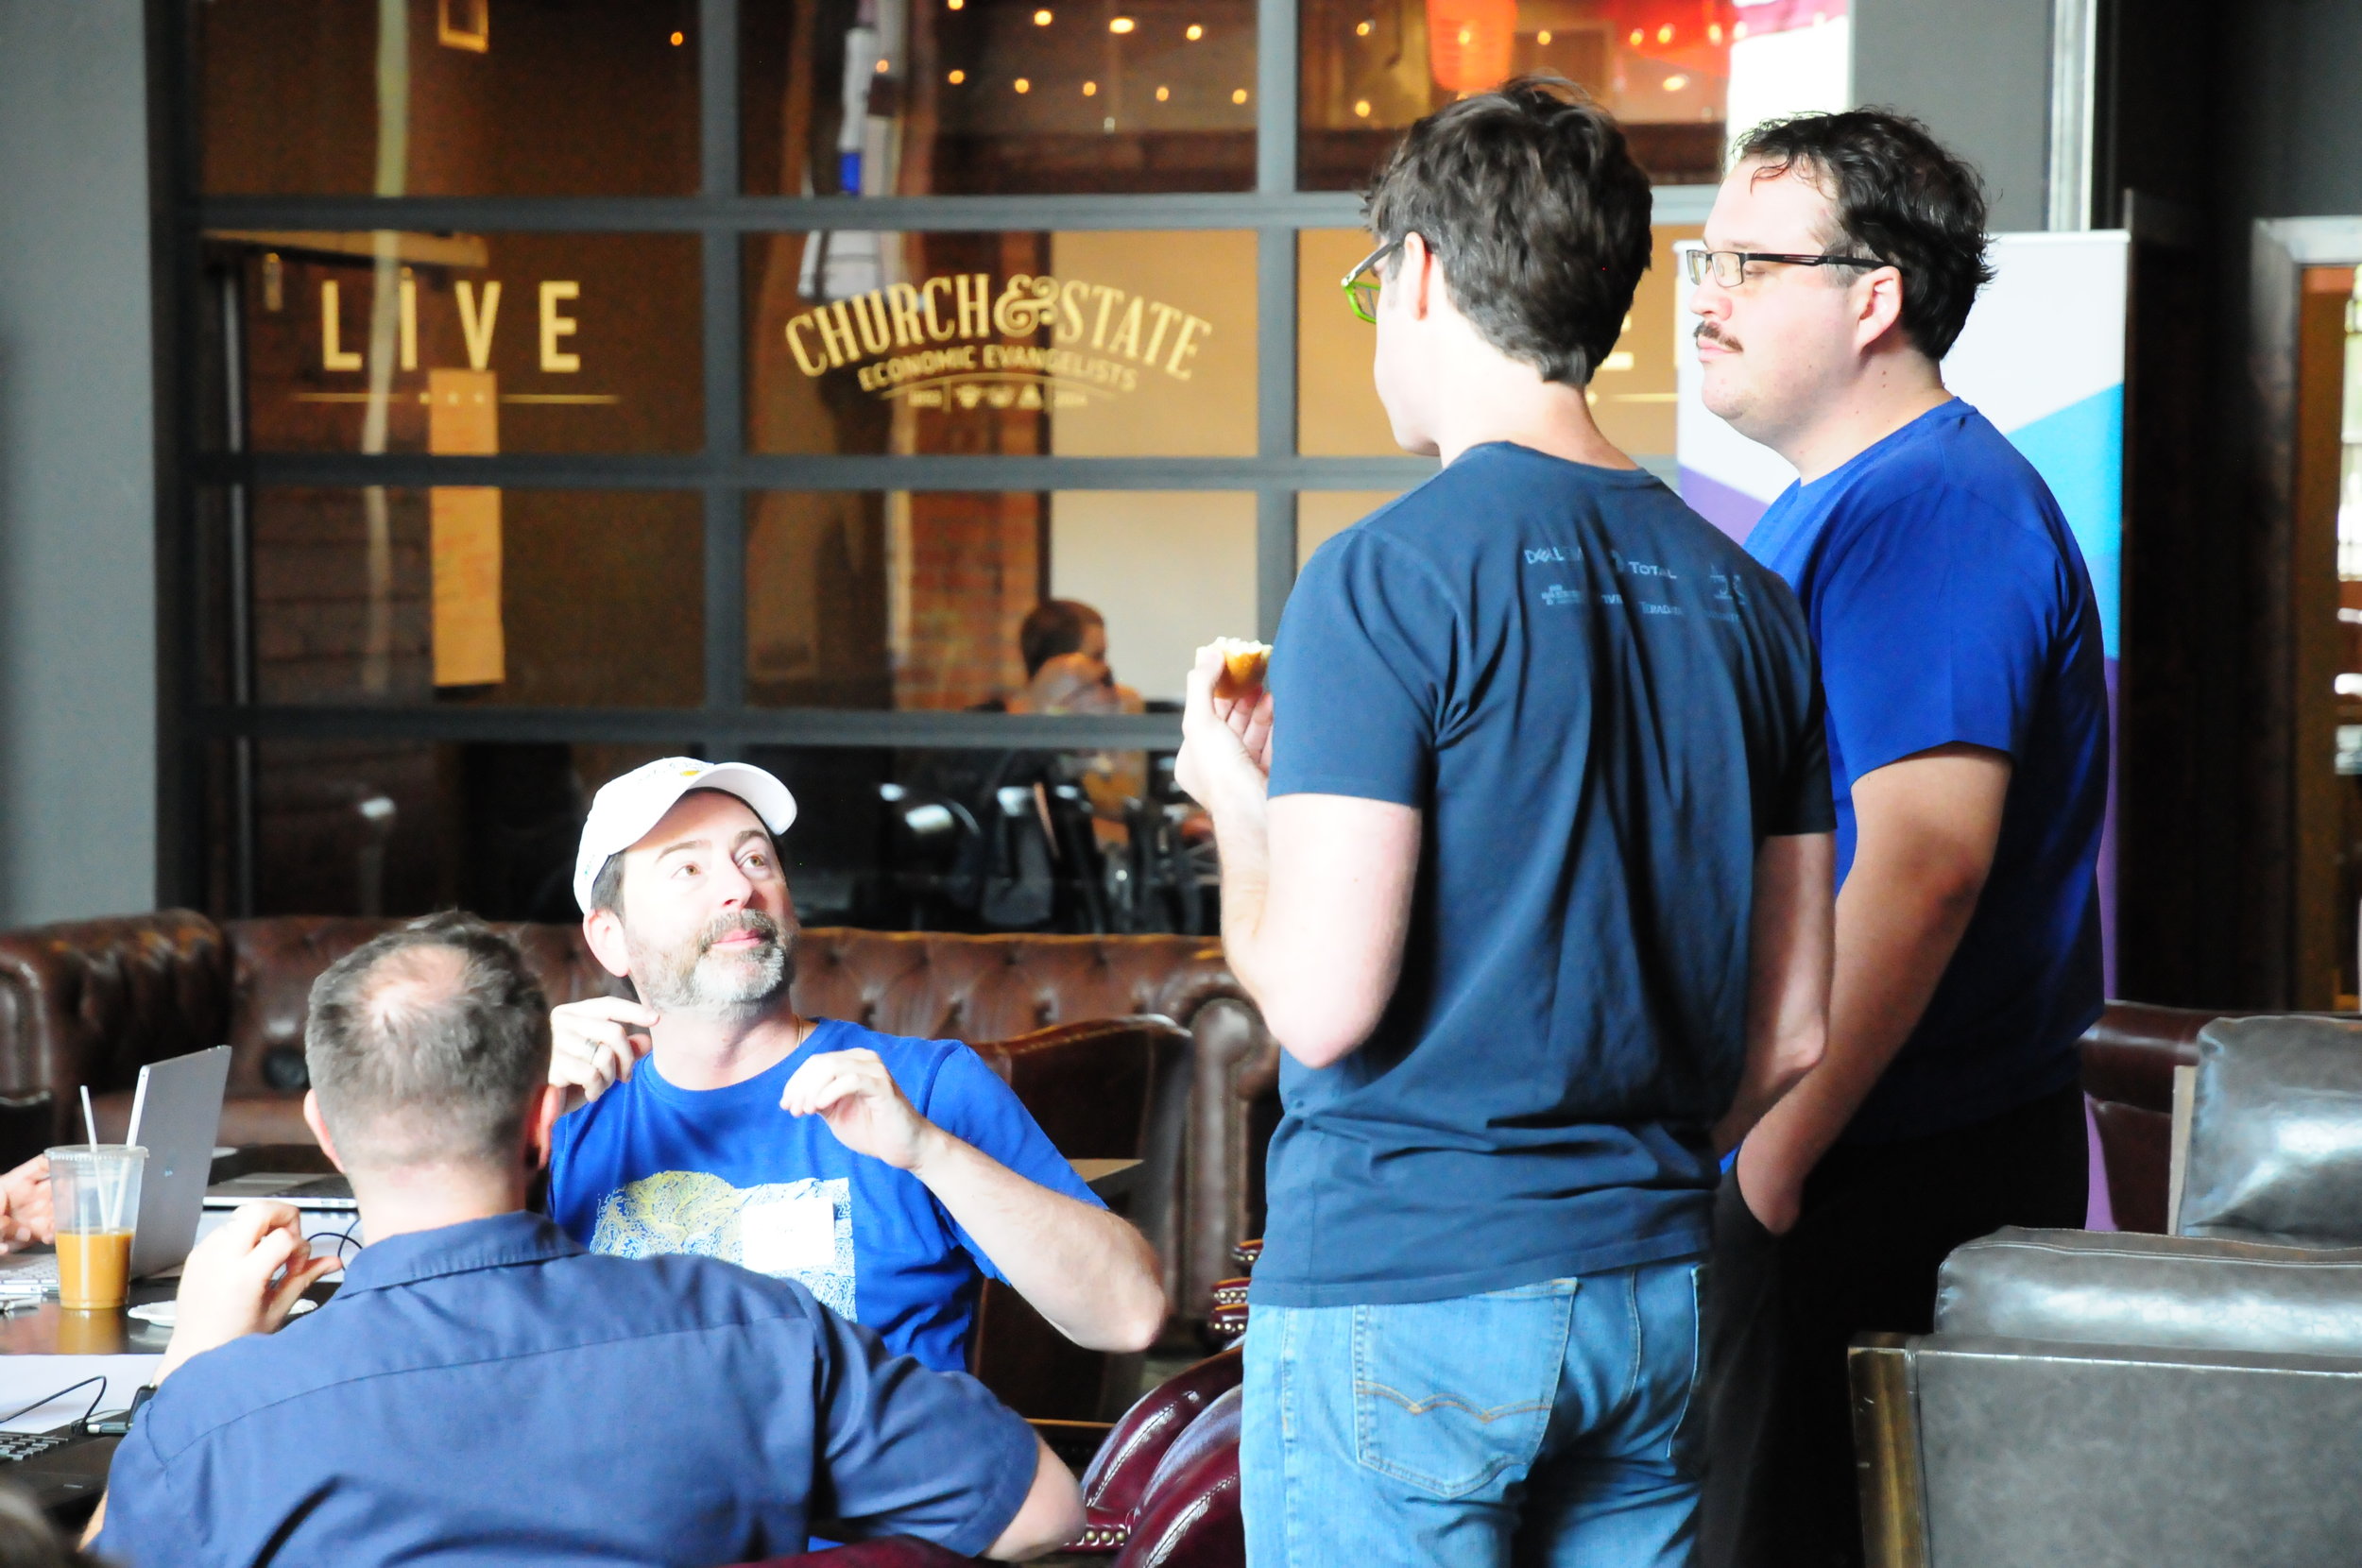
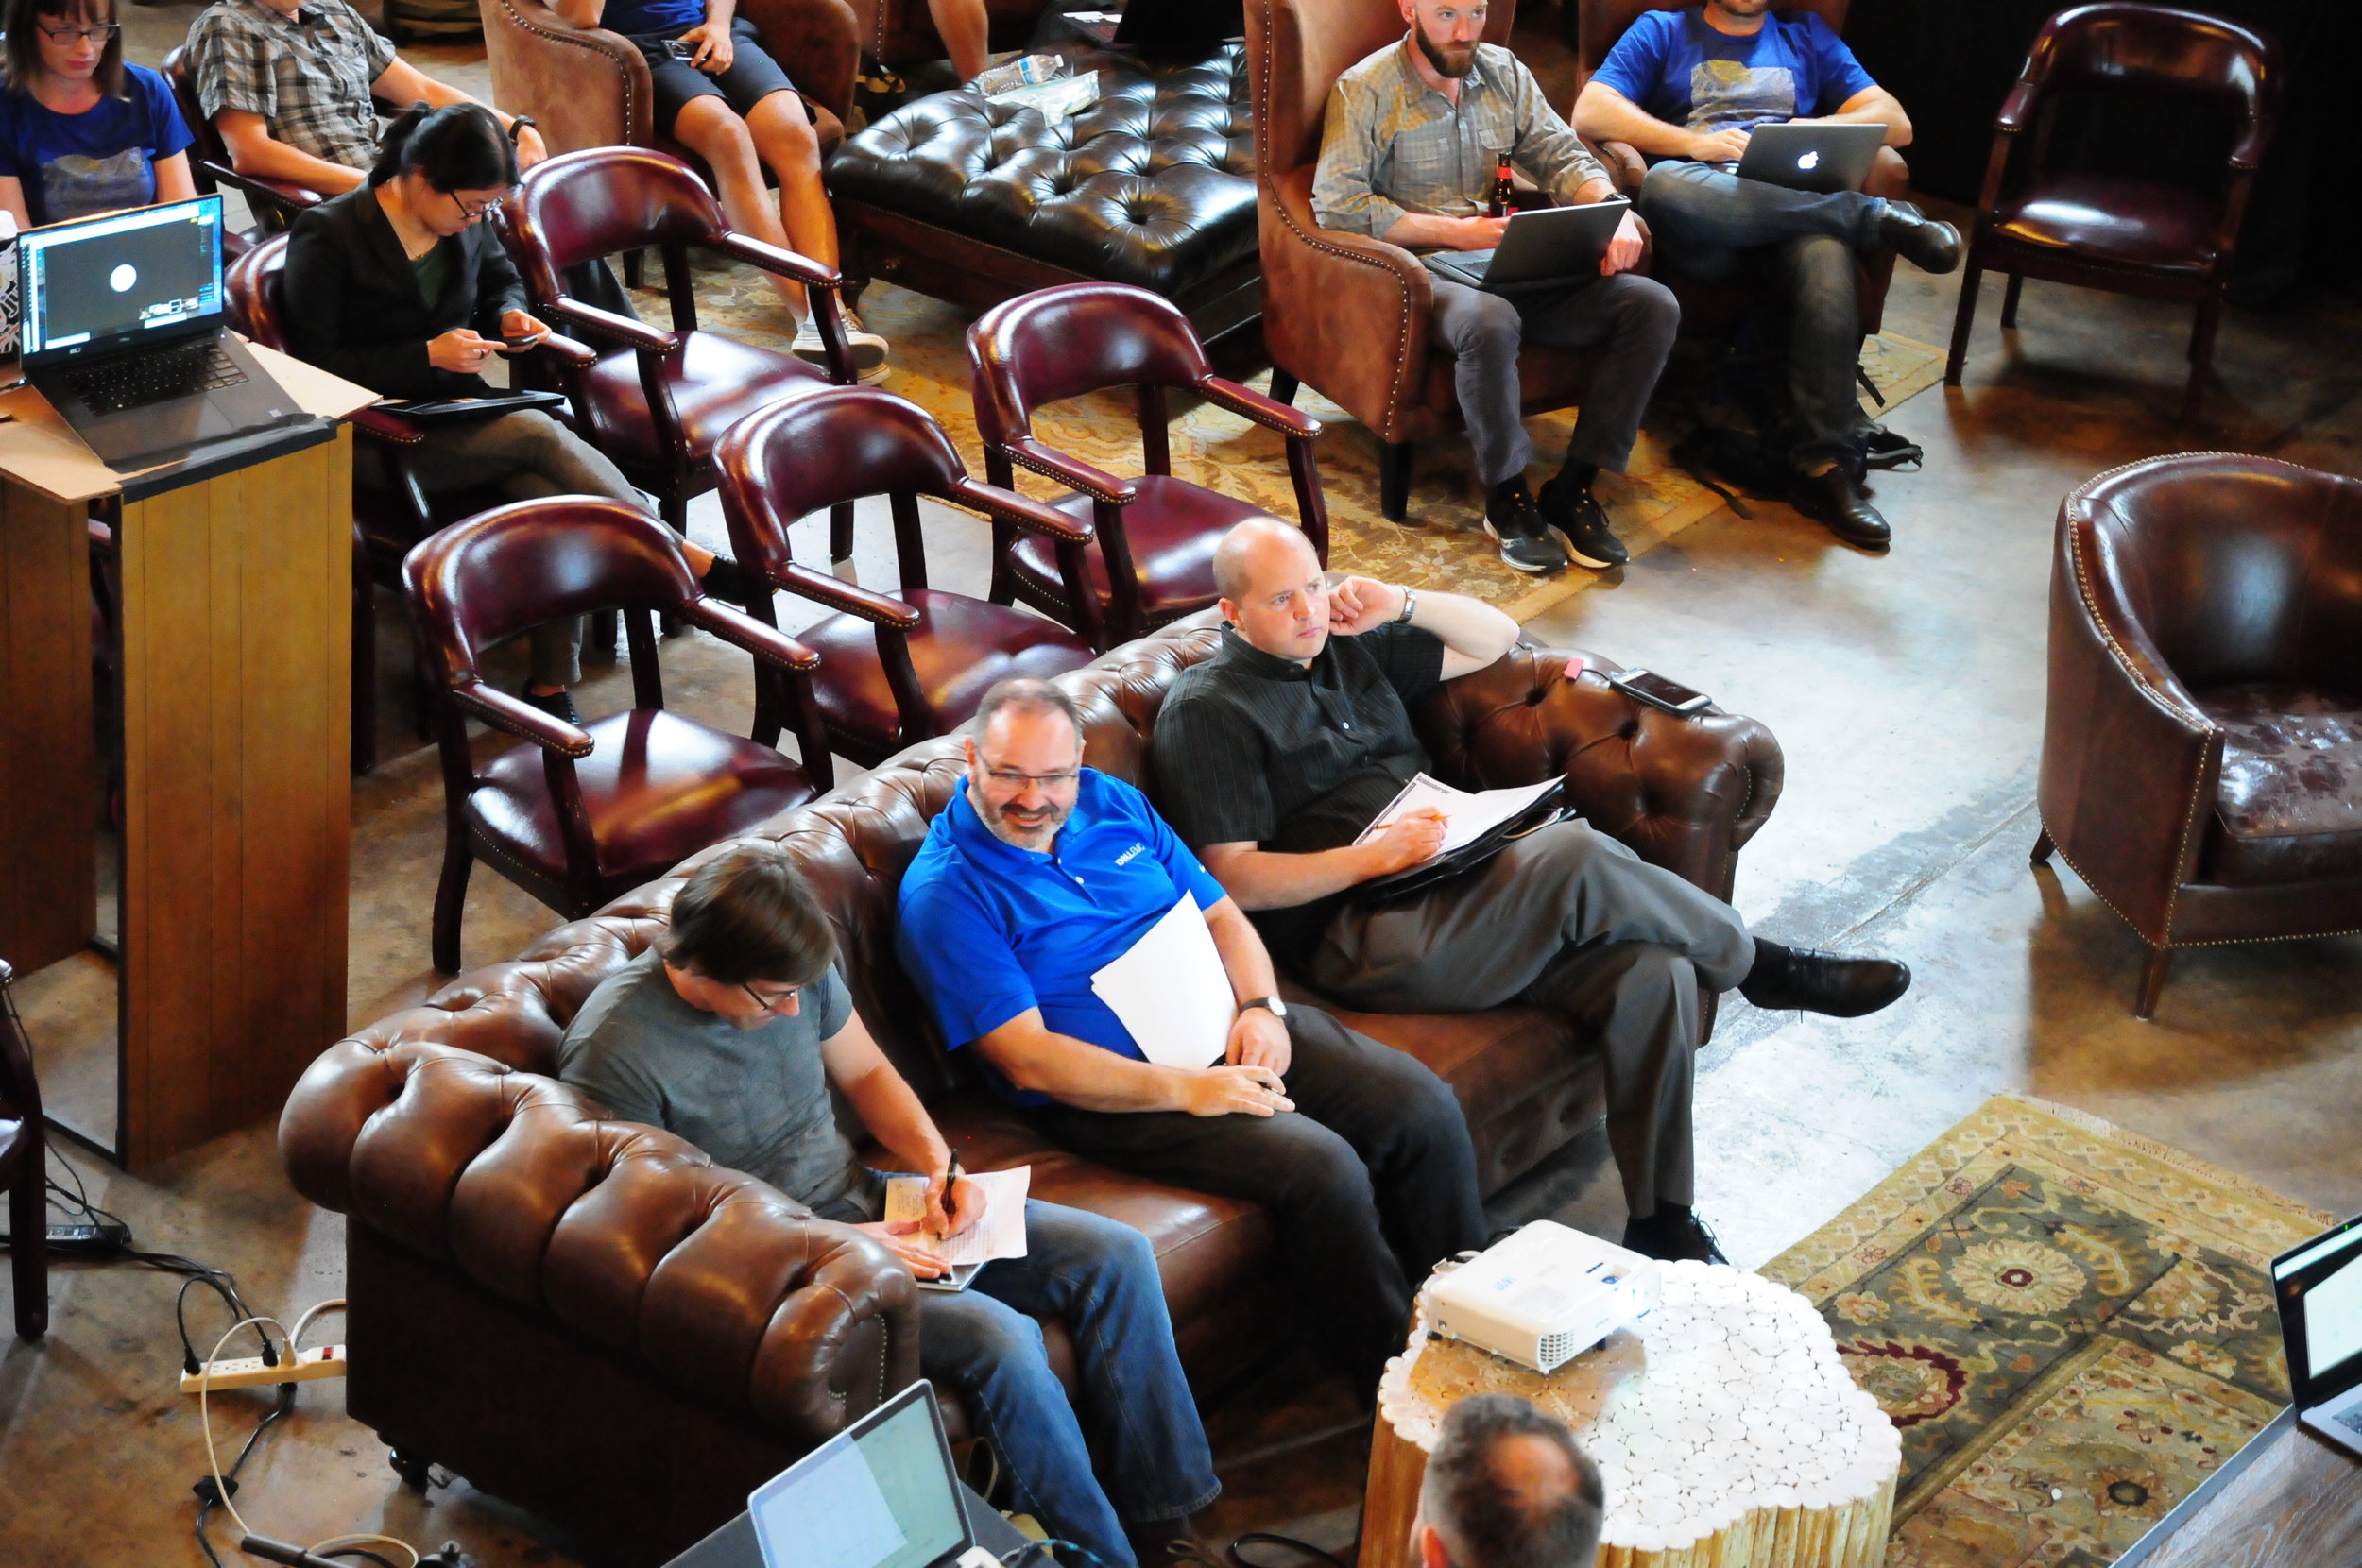
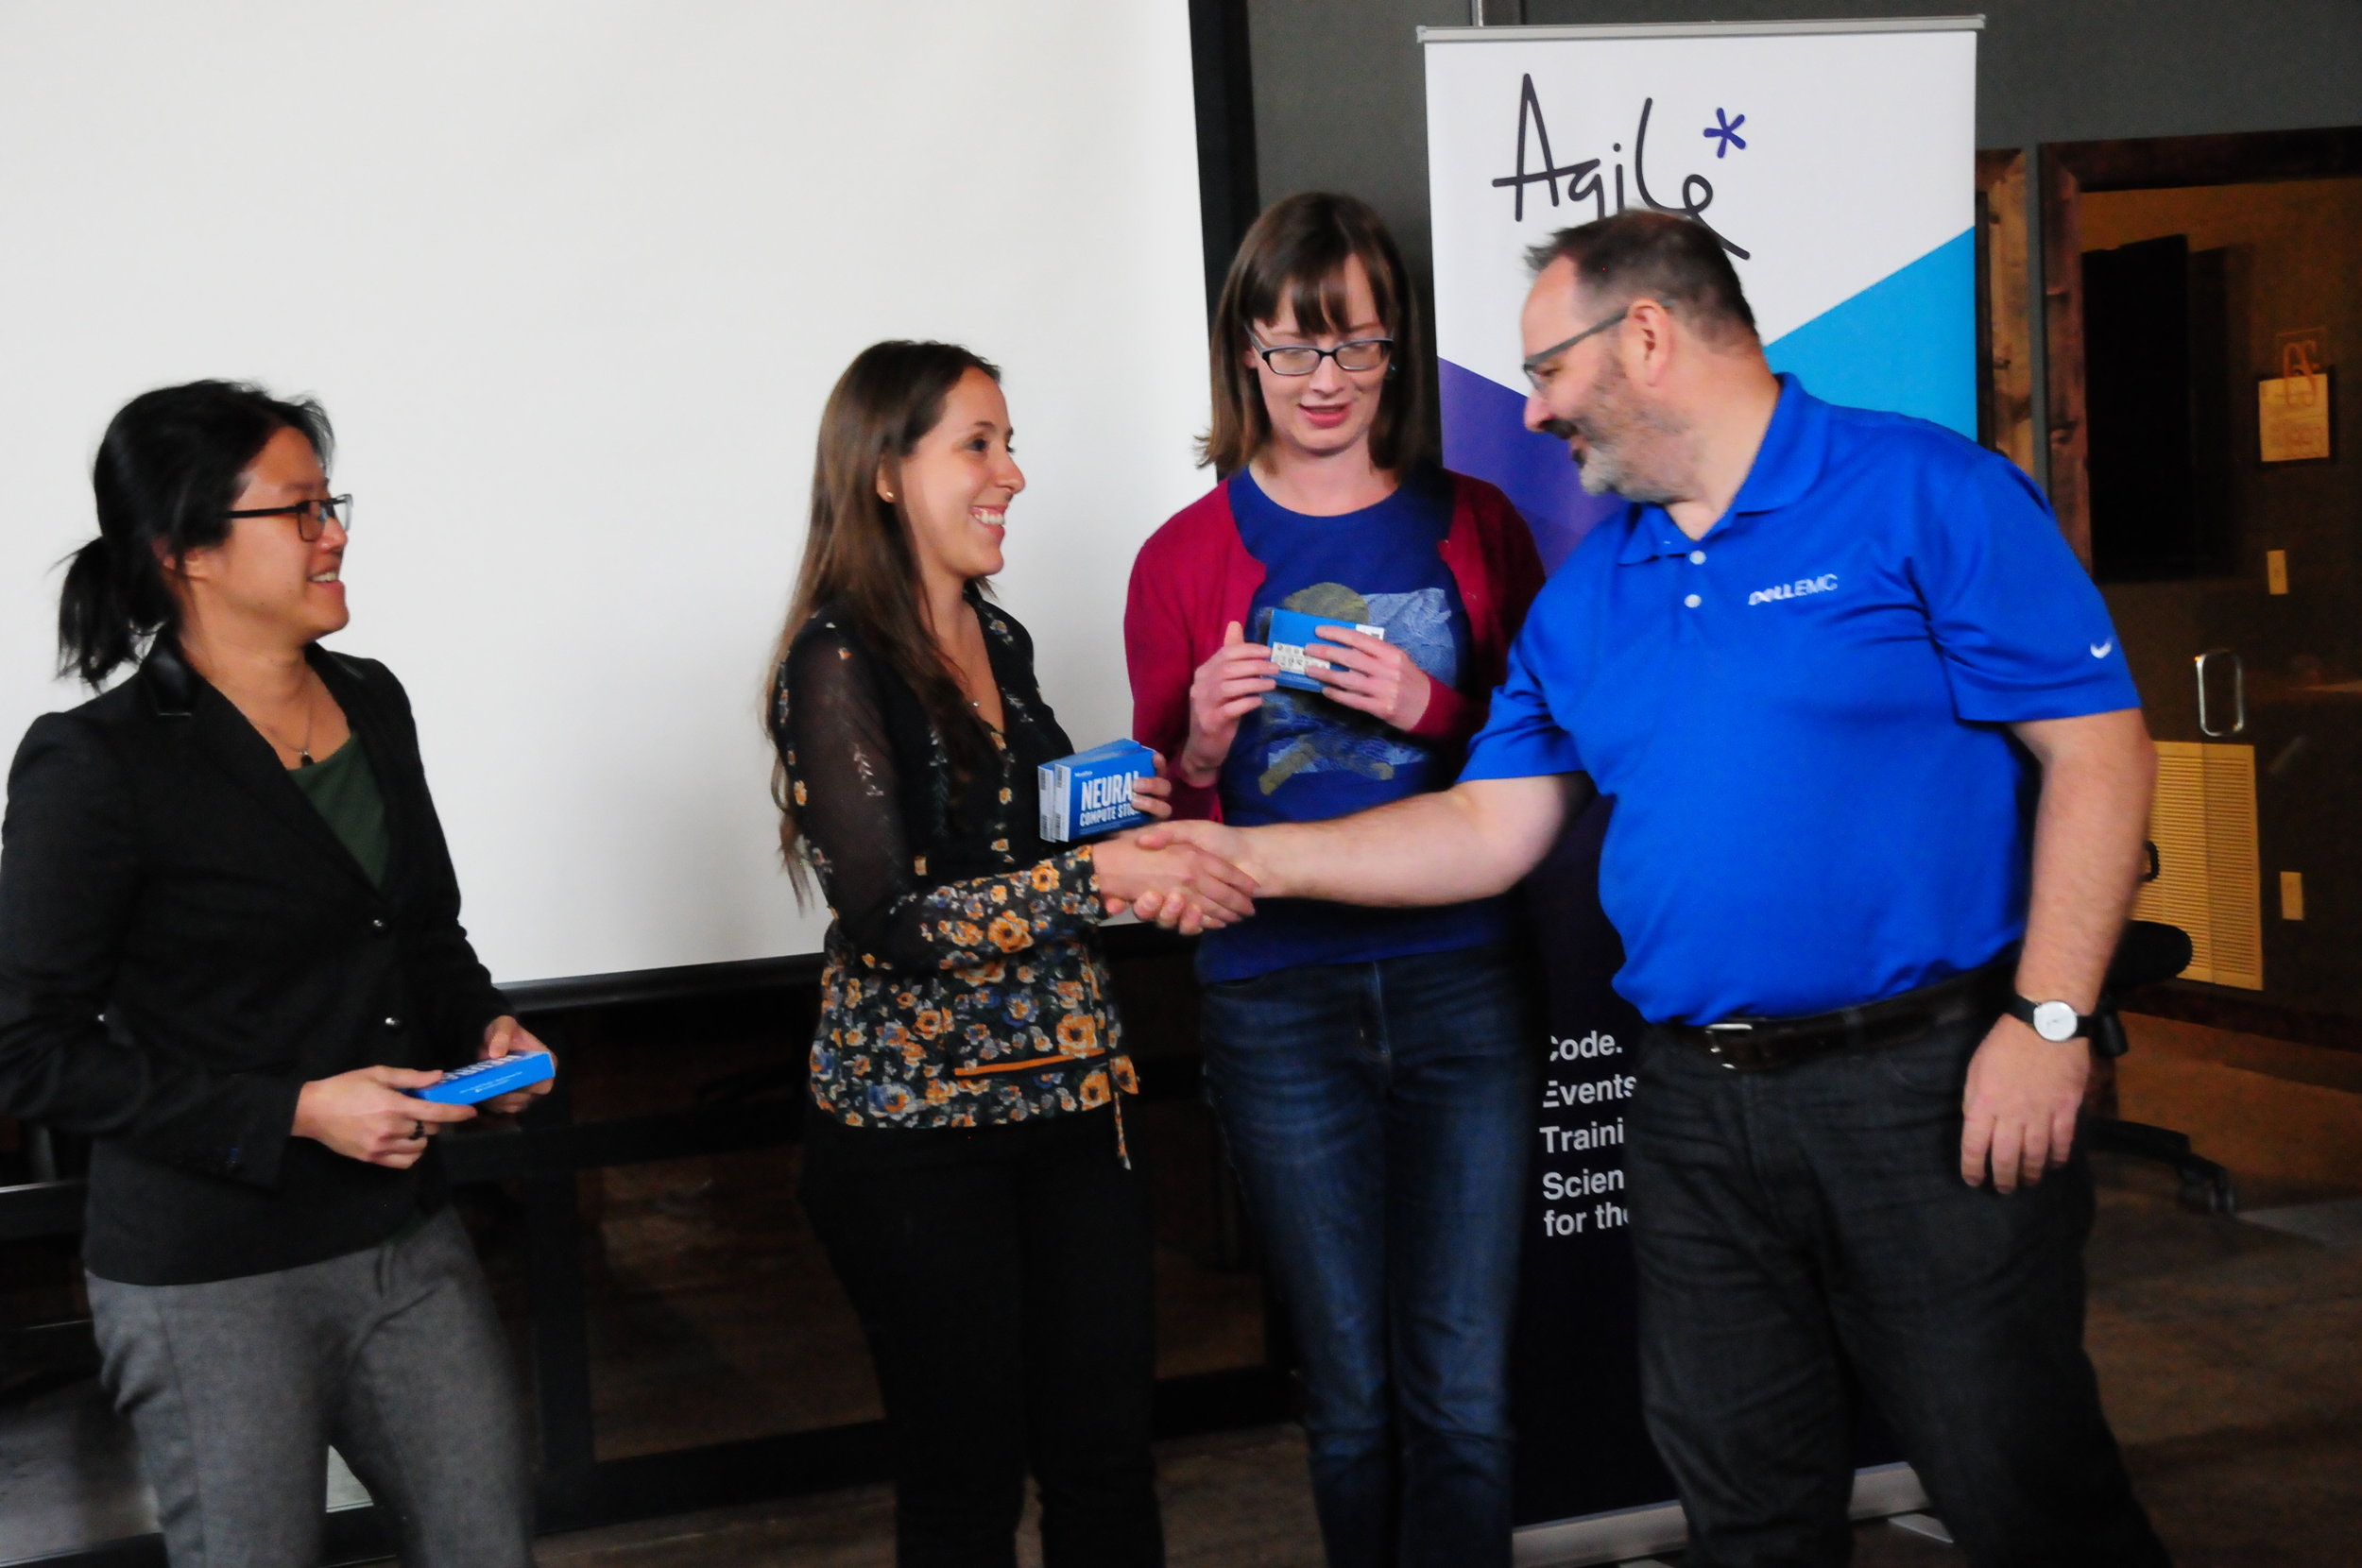
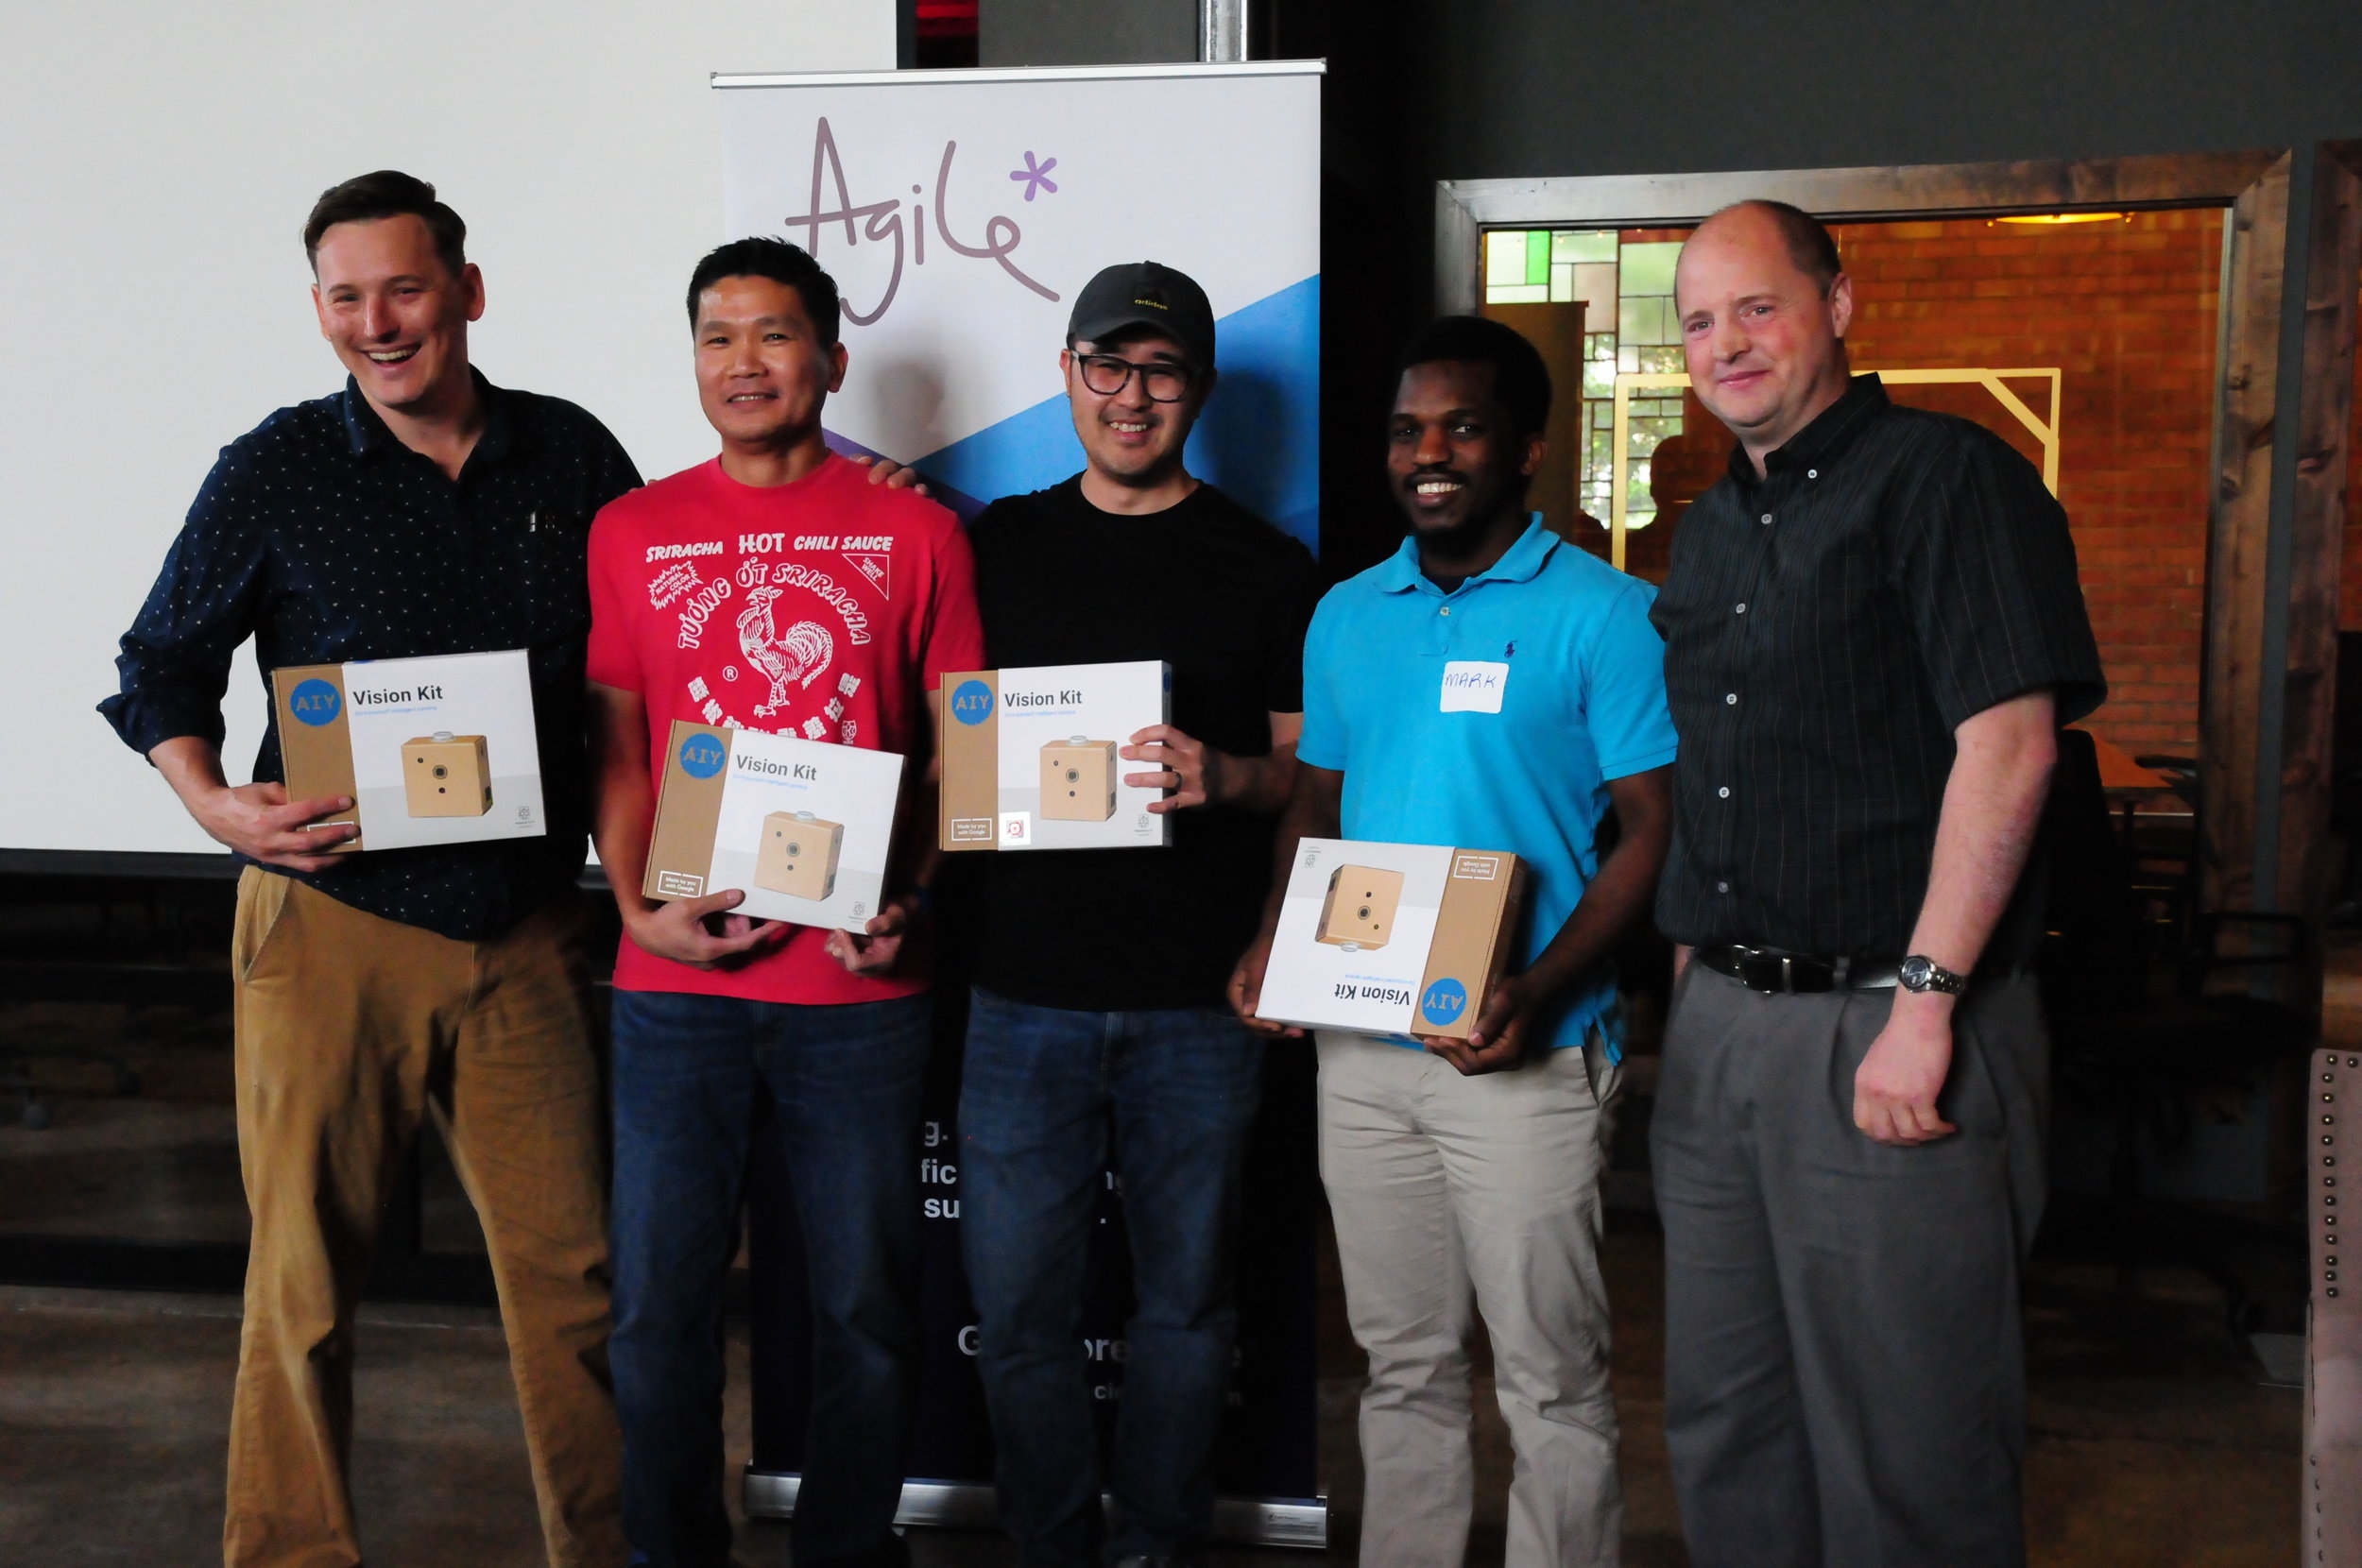
I'll do a run-down of the projects soon, but if you can't wait until then for my summary, you can watch the demos here; the first presentation starts at the 38 minute mark of the video. And you can check out some pictures from the event:

Pictures can say a lot but a few simple words, chosen at the right time, can speak volumes too. Shortly before we launched the demos, we asked the participants to choose words that best described how they were feeling. Here's what we got:

word_cloud_menti_SLC.png

Each participant was able to submit three responses, and although we aren't able to tell who said what, we were able to scrape the data and look at each person's chosen triplet of words. A couple of noteworthy ones were: educated, naptimeinspired and the expressive woo, yeah, perfect. But my personal favorite, by far, has to be the combination of: dead, defeated, inspired.

The creative process can be a rollercoaster of emotions. It's not easy. It's not always comfortable. Things don't always work out. But that's entirely ok. Indeed, facing up to this discomfort, as individuals and as organizations, is a necesary step in the path to digital transformation.

Enough Zen! To all the participants who put in the hard work this weekend, and to our wonderful sponsors who brought all kinds of support, I thank you and I salute you.

sponsors.png

A new blog, and a new course

There's a great new geoscience blog on the Internet — I urge you to add it to your blog-reading app or news reader or list of links or whatever it is you use to keep track of these things. It's called Geology and Python, and it contains exactly what you'd expect it to contain!

The author, Bruno Ruas de Pinho, has nine posts up so far, all excellent. The range of topics is quite broad:

In each post, Bruno takes some geoscience challenge — nothing too huge, but the problems aren't trivial either — and then methodically steps through solving the problem in Python. He's clearly got a good quantitative brain, having recently graduated in geological engineering from the Federal University of Pelotas, aka UFPel, Brazil, and he is now available for hire. (He seems to be pretty sharp, so if you're doing anything with computers and geoscience, you should snag him.)


A new course for Calgary

We've run lots of Introduction to Python courses before, usually with the name Creative Geocomputing. Now we're adding a new dimension, combining a crash introduction to Python with a crash introduction to machine learning. It's ambitious, for sure, but the idea is not to turn you into a programmer. We aim to:

  • Help you set up your computer to run Python, virtual environments, and Jupyter Notebooks.
  • Get you started with downloading and running other people's packages and notebooks.
  • Verse you in the basics of Python and machine learning so you can start to explore.
  • Set you off with ideas and things to figure out for that pet project you've always wanted to code up.
  • Introduce you to other Calgarians who love playing with code and rocks.

We do all this wielding geoscientific data — it's all well logs and maps and seismic data. There are no silly examples, and we don't shy away from so-called advanced things — what's the point in computers if you can't do some things that are really, really hard to do in your head?

Tickets are on sale now at Eventbrite, it's $750 for 2 days — including all the lunch and code you can eat.

In search of the Kennetcook Thrust

Behind every geologic map, is a much more complex geologic truth. Most of the time it's hidden under soil and vegetation, forcing geologists into a detective game in order to fill gaps between hopelessly sparse spatterings of evidence.

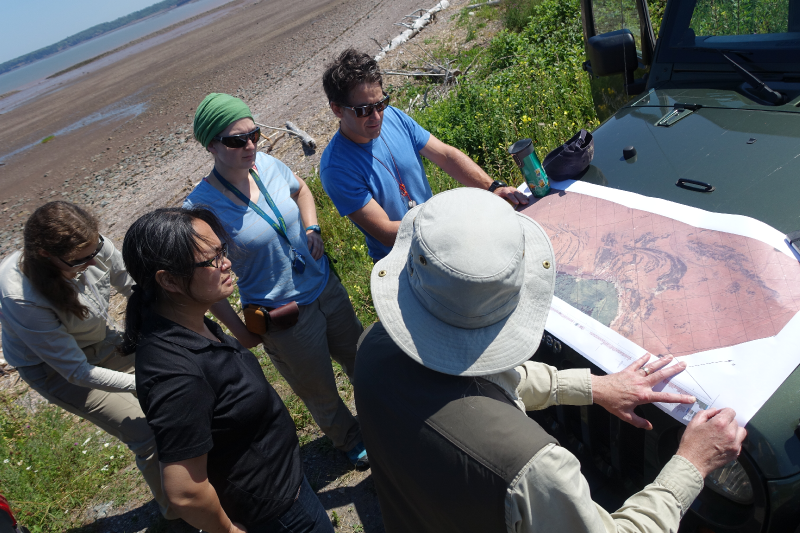
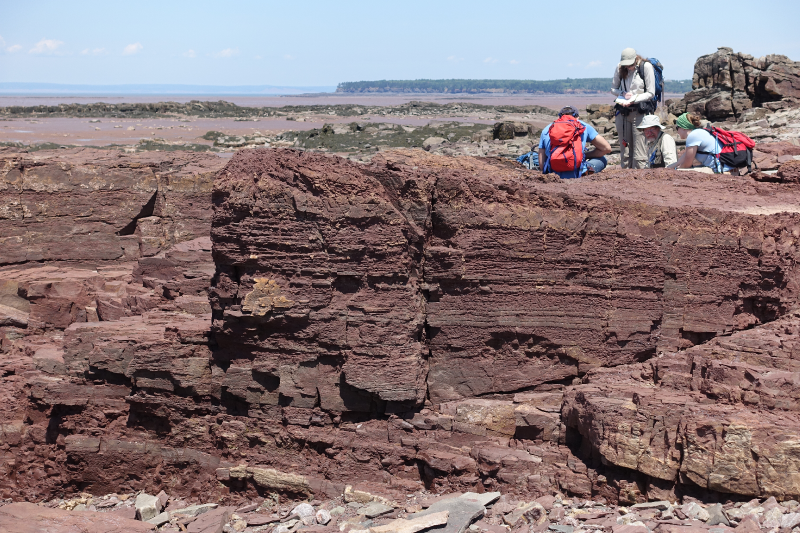
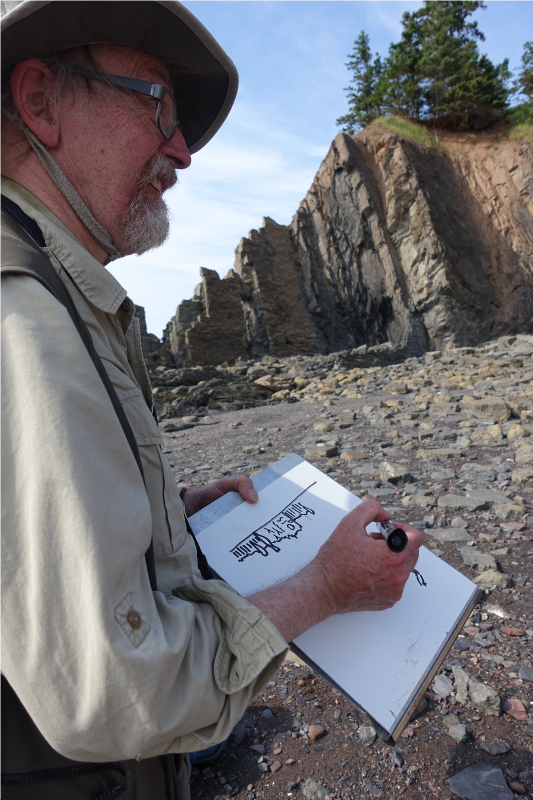
Two weeks ago, I joined up with an assortment of geologists on the side of the highway an hour north of Halifax for John Waldron to guide us along some spectacular stratigraphy exposed in the coastline cliffs on the southern side of the Minas Basin (below). John has visited these sites repeatedly over his career, and he's supervised more than a handful of graduate students probing a variety of geologic processes on display here. He's published numerous papers teasing out the complex evolution of the Windsor-Kennetcook Basin: one of three small basins onshore Nova Scotia with the potential to contain economic quantities of hydrocarbons.

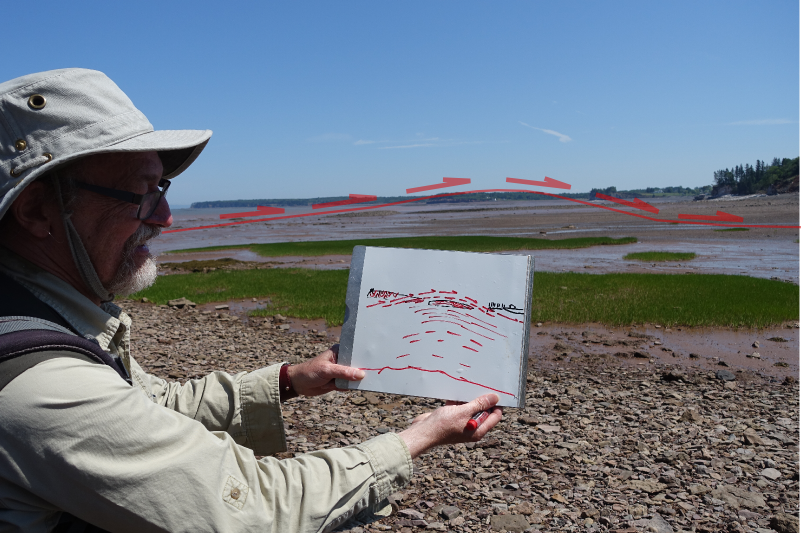
John retold the history of mappers past and present riddled by the massively deformed, often duplicated Carboniferous evaporites in the Windsor Group which are underlain by sub-horizontal seismic reflectors at depth. Local geologists agree that this relationship reflects thrusting of the near-surface package, but there is disagreement on where this thrust is located, and whether and where it intersects the surface. On this field trip, John showed us symptoms of this Kennetcook thrust system, at three sites. We started in the footwall. The second and third sites were long stretches spectacularly deformed exposures in the hangingwall.  

Footwall: Cheverie Point

SEE GALLERY BELOW FOR ENLARGEMENT

SEE GALLERY BELOW FOR ENLARGEMENT

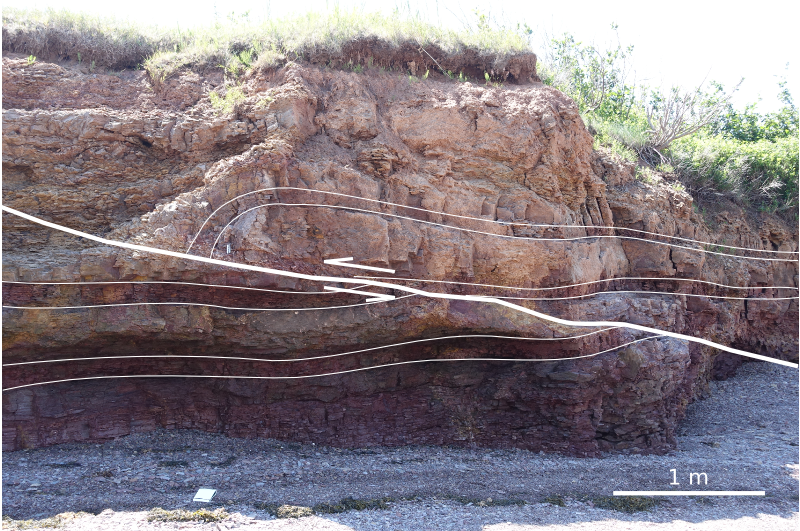
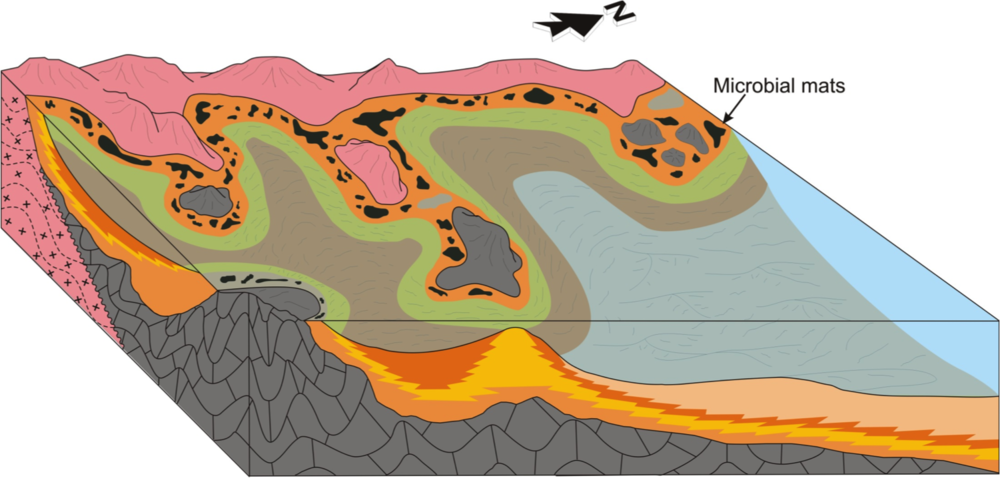
The first stop was Cheverie Point and is interpreted to be well in the footwall of the Kennetcook thrust. Small thrust faults (right) cut through the type section of the Macumber Formation and match the general direction of the main thrust system. The Macumber Formation is a shallow marine microbial limestone that would have fooled anyone as a mudstone, except it fizzed violently under a drop of HCl. Just to the right of this photo, we stood on the unconformity between the petroliferous and prospective Horton Group and the overlying Windsor Group. It's a pick that turns out to be one of the most reliably mappable seismic events on seismic sections so it was neat to stand on that interface.

Further down section we studied the Mississippian Cheverie Formation: stacked cycles of point-bar deposits ranging from accretionary lag conglomerates to caliche paleosols with upright tree trunks. Trees more than a metre or more in diameter were around from the mid Devonian, but Cheverie forests are still early and good examples of trees within point-bars and levees.  

Hangingwall: Red Head / Johnson Beach / Split Rock

SEE GALLERY BELOW FOR ENLARGEMENT

SEE GALLERY BELOW FOR ENLARGEMENT

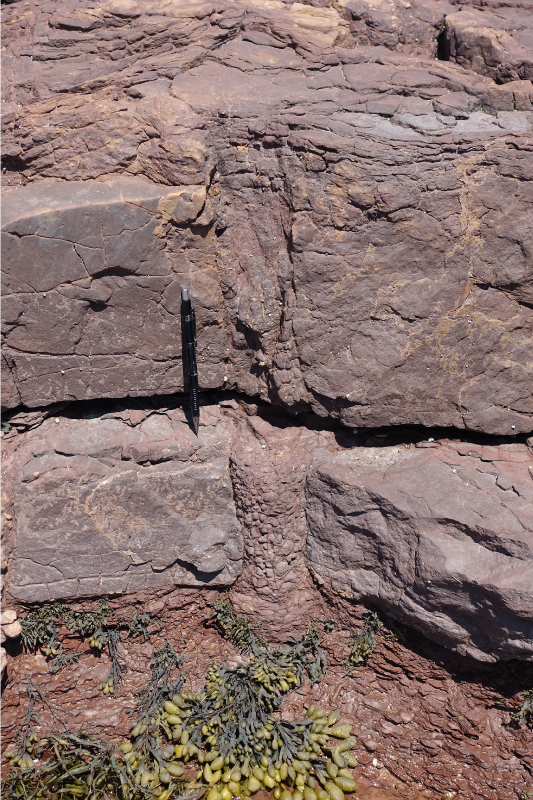
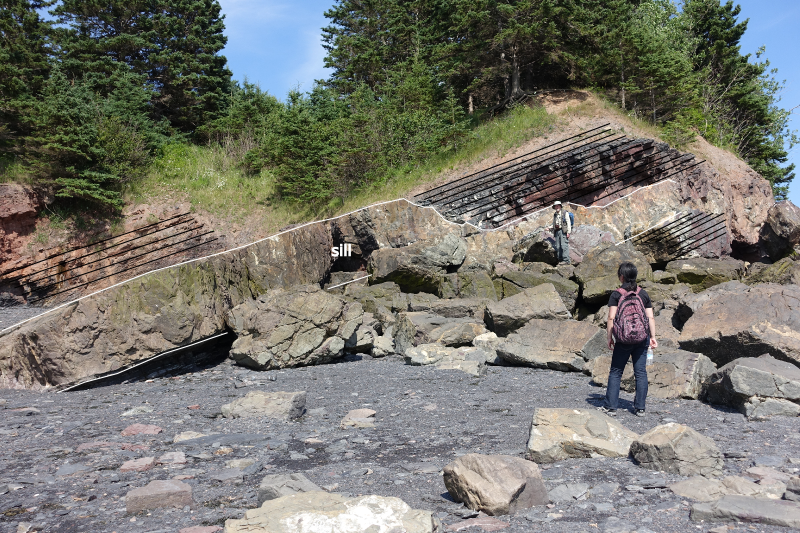
The second site featured some spectacularly folded black shales from the Horton Bluff Formation, as well as protruding sills up to two metres thick that occasionally jumped across bedding (right). We were clumsily contemplating the curious occurrence of these intrusions for quite some time until hard-rock guru Trevor McHattie halted the chatter, struck off a clean piece rock with a few blows of his hammer, wetted it with a slobbering lick, and inspected it with his hand lens. We all watched him in silence and waited for his description. I felt a little schooled. He could have said anything. It was my favourite part of the day.

Hangingwall continued: Rainy Cove

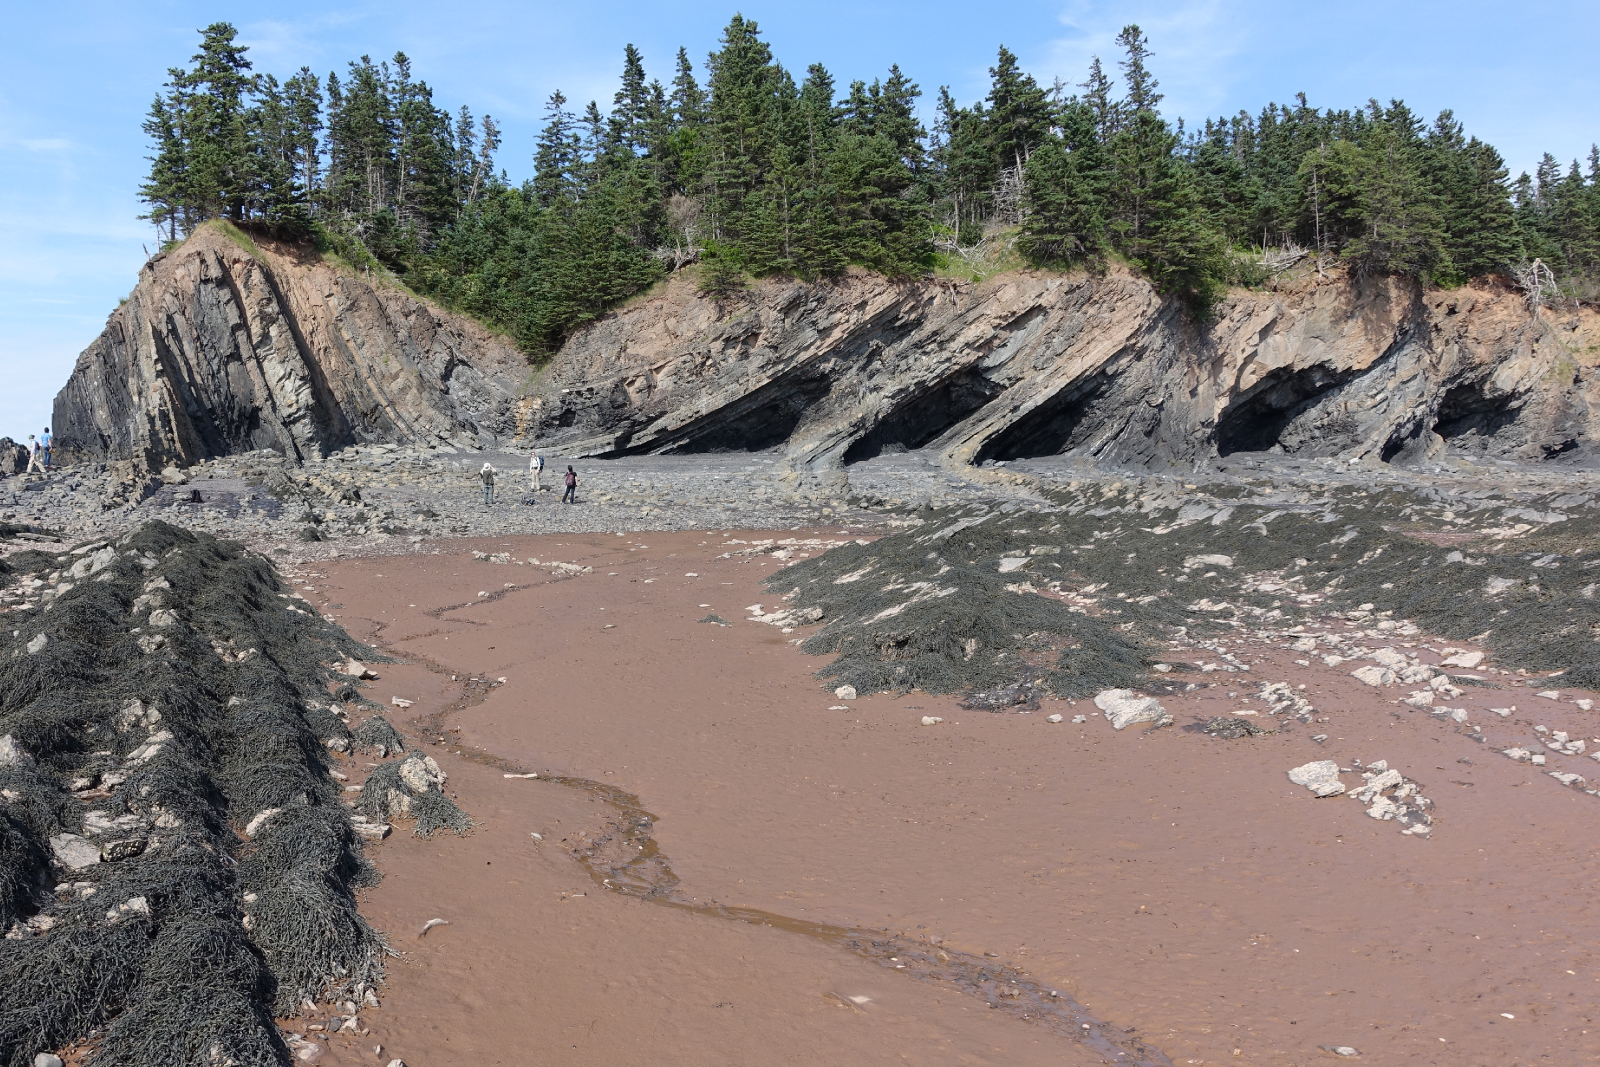
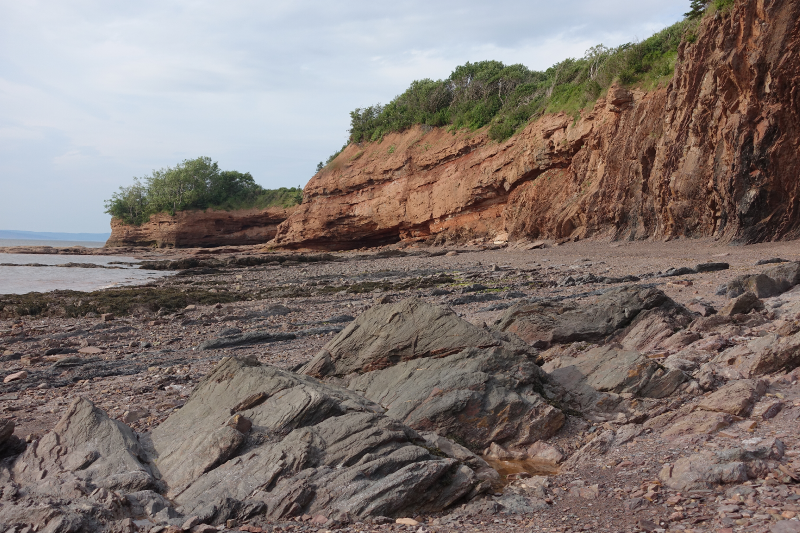
The patterns in the rocks at Rainy Cove are a wonderland for any structural geologist. It's a popular site for geology labs from Atlantic Universities, but it would be an absolute nightmare to try to actually measure the section here. 

SEE GALLERY BELOW FOR ENLARGEMENT

SEE GALLERY BELOW FOR ENLARGEMENT

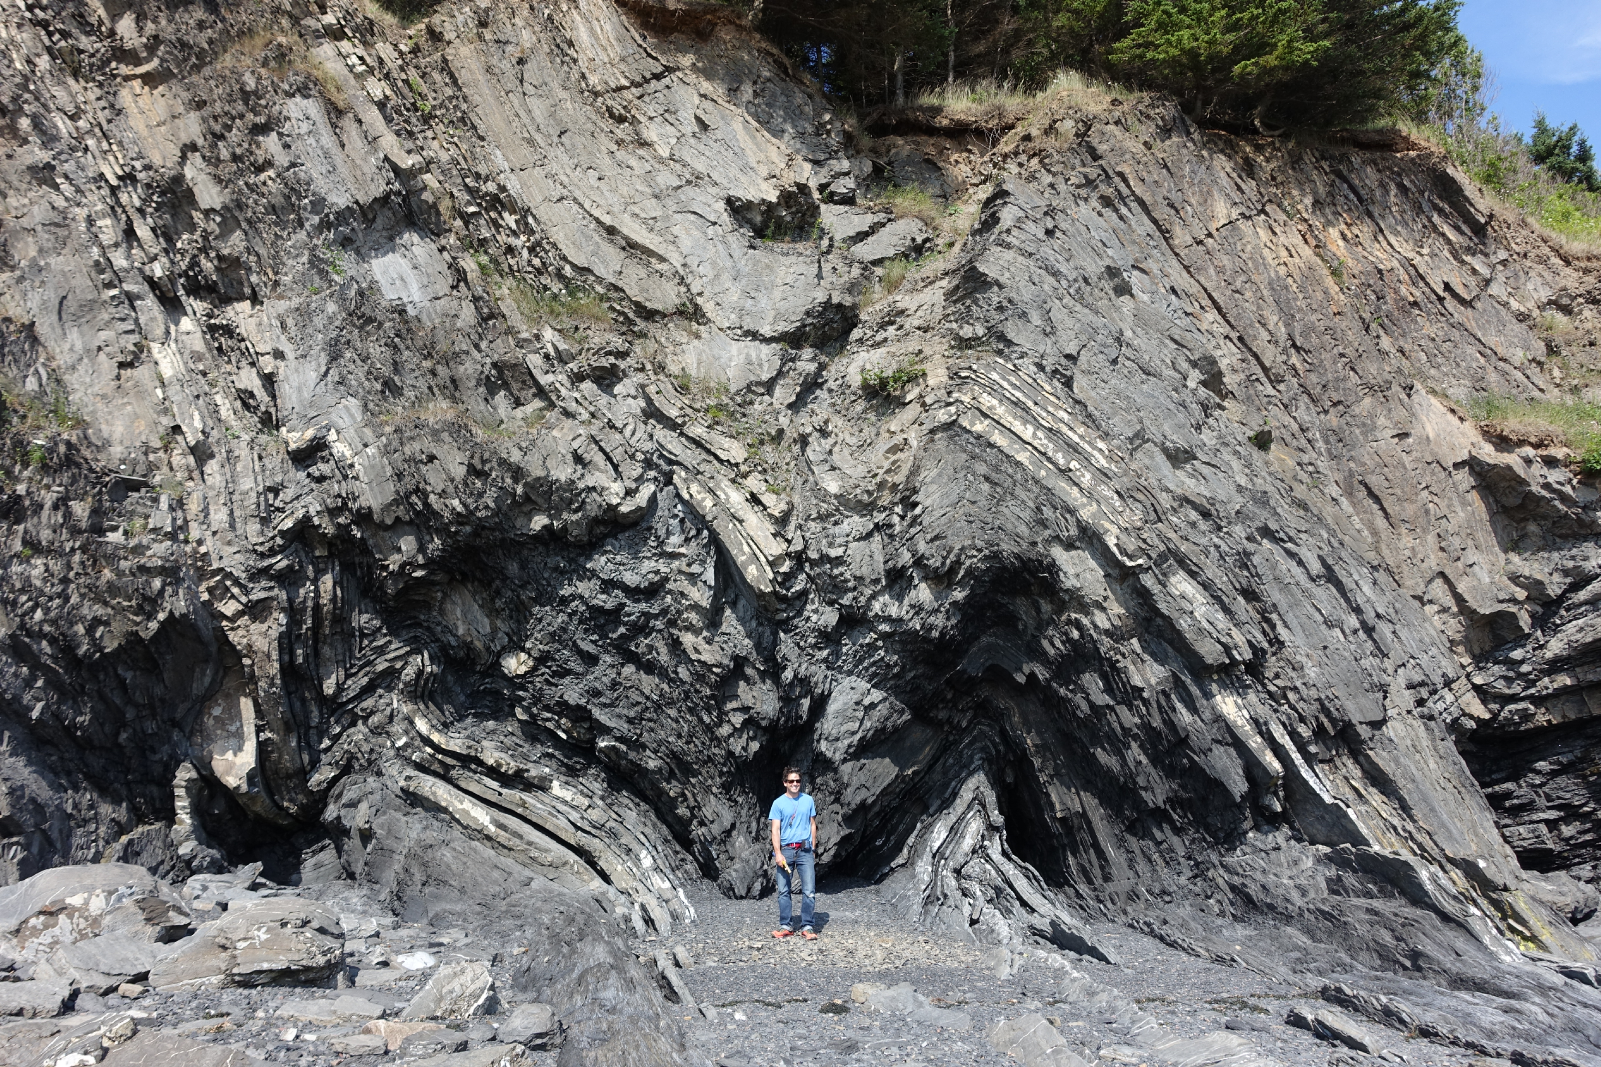
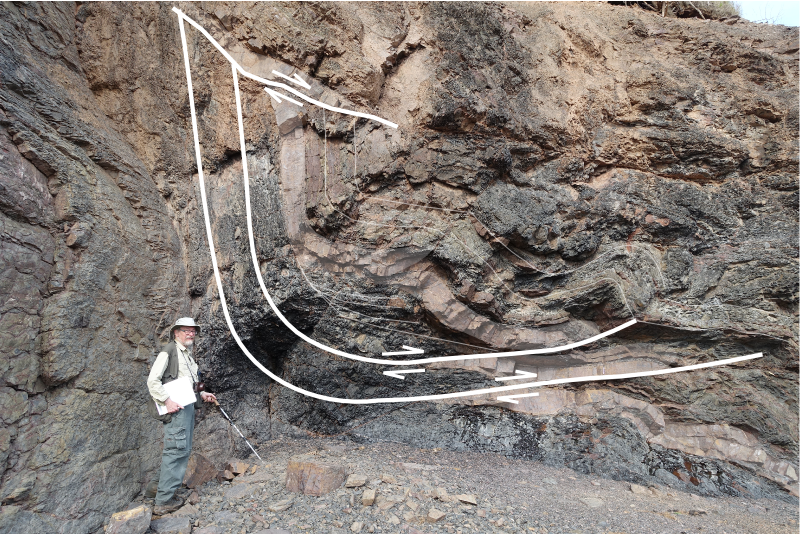
John stands next to a small system of duplicated thrusts in the main hangingwall that have been subsequently folded (left). I tried tracing out the fault planes by following the offsets in the red sandstone bed amidst black shales whose fabric has been deformed into an accordion effect. Your picks might very well be different from mine.

A short distance away we were pointed to an upside-down view of load structures in folded beds. "This antiform is a syncline", John paused while we processed. "This synform over here is an anticline". Features telling of such intense deformation are hard to fathom. Especially in plain sight.

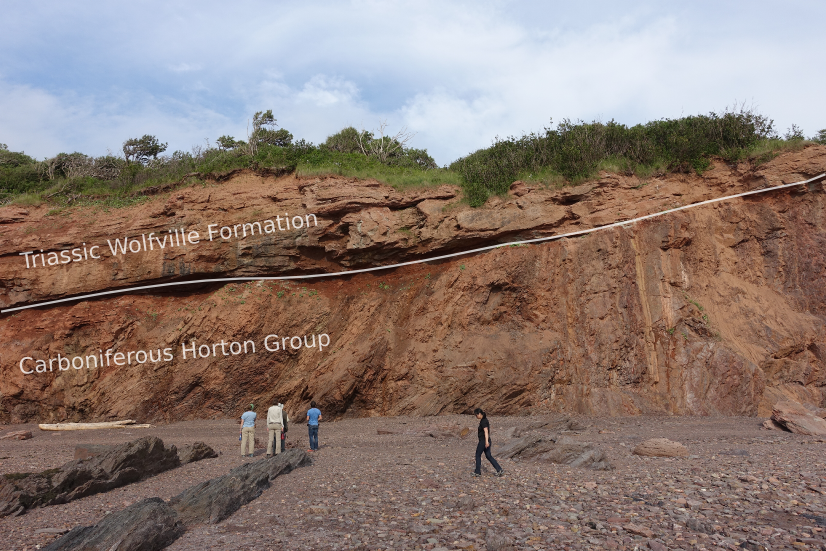
The rock lessons ended in the early evening at the far end of Rainy Cove where the Triassic Wolfville formation sits unconformably on top of ridiculously folded, sometimes doubly overturned Carboniferous Horton Rocks. John said it has to be one of the most spectacularly exposed unconformities in the world. 

I often take for granted the vast stretches of geology hiding beneath soil and vegetation, and the preciousness of finding quality outcrop. Check out the gallery below for pictures from our day.  

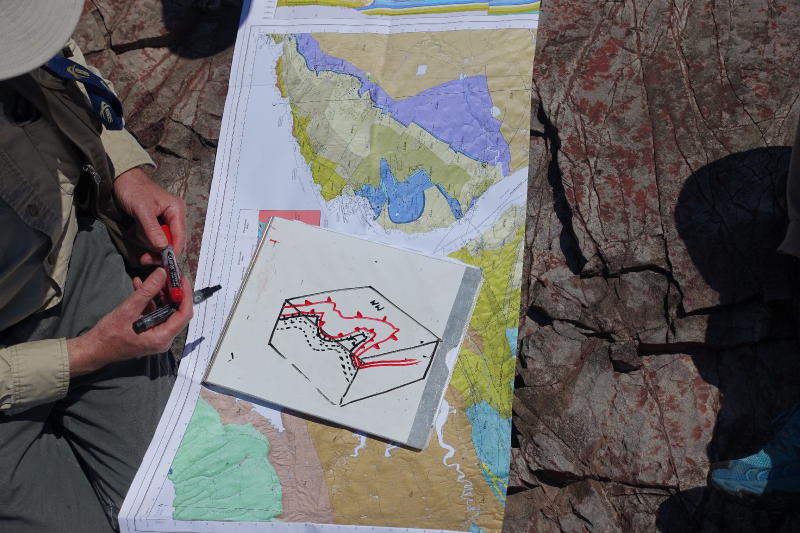
I was quite enamoured with John's format. His field trip technologies. The maps and sections: canvases for communication and works in progress. His white boarding, his map-folding techniques: a practised impresario.

What are some of the key elements from the best field trips you've been on? Let us know in the comments.

Introducing Striplog

Last week I mentioned we'd been working on a project called striplog. I told you it was "a new Python library for manipulating well data, especially irregularly sampled, interval-based, qualitative data like cuttings descriptions"... but that's all. I thought I'd tell you a bit more about it — why we built it, what it does, and how you can use it yourself.

The problem we were trying to solve

The project was conceived with the Nova Scotia Department of Energy, who had a lot of cuttings and core descriptions that they wanted to digitize, visualize, and archive. They also had some hand-drawn striplog images — similar to the one on the right — that needed to be digitized in the same way. So there were a few problems to solve:

  • Read a striplog image and a legend, turn the striplog into tops, bases, and 'descriptions', and finally save the data to an archive-friendly LAS file.
  • Parse natural language 'descriptions', converting them into structured data via an arbitrary lexicon. The lexicon determines how we interpret the words 'sandstone' or 'fine grained'.
  • Plot striplogs with minimal effort, and keep plotting parameters separate from data. It should be easy to globally change the appearance of a particular lithology.
  • Make all of this completely agnostic to the data type, so 'descriptions' might be almost anything you can think of: special core analyses, palaeontological datums, chronostratigraphic intervals...

The usual workaround, I mean solution, to this problem is to convert the descriptions into some sort of code, e.g. sandstone = 1, siltstone = 2, shale = 3, limestone = 4. Then you make a log, and plot it alongside your other curves or make your crossplots. But this is rather clunky, and if you lose the mapping, the log is useless. And we still have the other problems: reading images, parsing descriptions, plotting...

What we built

One of the project requirements was a Python library, so don't look for a pretty GUI or fancy web app. (This project took about 6 person-weeks; user interfaces take much longer to craft.) Our approach is always to try to cope with chaos, not fix it. So we tried to design something that would let the user bring whatever data they have: XLS, CSV, LAS, images.

The library has tools to, for example, read a bunch of cuttings descriptions (e.g. "Fine red sandstone with greenish shale flakes"), and convert them into Rocks — structured data with attributes like 'lithology' and 'colour', or whatever you like: 'species', 'sample number', 'seismic facies'. Then you can gather Rocks into Intervals (basically a list of one or more Rocks, with a top and base depth, height, or age). Then you can gather Intervals into a Striplog, which can, with the help of a Legend if you wish, plot itself or write itself to a CSV or LAS file.

The Striplog object has some useful features. For example, it's iterable in Python, so it's trivial to step over every unit and perform some query or analysis. Some tasks are built-in: Striplogs can summarize their own statistics, for example, and searching for 'sandstone' returns another Striplog object containing only those units matching the query.

  >>> striplog.find('sandstone')
  Striplog(4 Intervals, start=230.328820116, stop=255.435203095)

We can also do a reverse lookup, and see what's at some arbitrary depth:

  >>> striplog.depth(260).primary  # 'primary' gives the first component
  Rock("colour":"grey", "lithology":"siltstone")

You can read more in the documentation. And here's Striplog in a picture:

An attempt to represent striplog's objects, more or less arranged according to a workflow.

Where to get it

For the time being, the tool is only available as a Python library, for you to use on the command line, or in IPython Notebooks (follow along here). You can install striplog very easily:

  pip install striplog

Or you can clone the repo on GitHub. 

As a new project, it has some rough edges. In particular, the Well object is rather rough. The natural language processing could be much more sophisticated. The plotting could be cuter. If and when we unearth more use cases, we'll be hacking some more on it. In the meantime, we would welcome code or docs contributions of any kind, of course.

And if you think you have a use for it, give us a call. We'd love to help.


Postscript

I think it's awesome that the government reached out to a small, Nova Scotia-based company to do this work, keeping tax dollars in the province. But even more impressive is that they had the conviction not only to allow allow but even to encourage us to open source it. This is exactly how it should be. In contrast, I was contacted recently by a company that is building a commercial plug-in for Petrel. They had received funding from the federal government to do this. I find this... odd.

Dynamic geology at AAPG

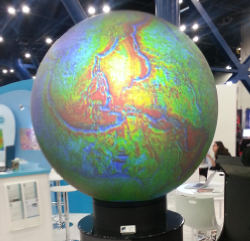
Brad Moorman stands next to his 48 inch (122 cm) Omni Globe spherical projection system on the AAPG exhibition floor, greeting passers by drawn in by its cycling animations of Getech's dynamic plate reconstructions. His map-lamp projects evolutionary visions of geologic processes like a beacon of inspiration for petroleum explorers.

I've attended several themed sessions over the first day and a half at AAPG and the ones that have stood out for me have had this same appeal.

Computational stratigraphy

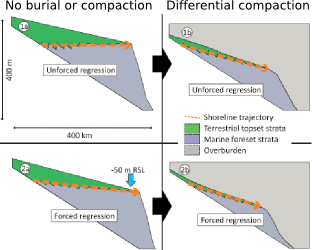
Processes such as accommodation rate and sedimentation rate can be difficult to unpeel from stratal geometries. Guy Prince's PhD Impact of non-uniqueness on sequence stratigraphy used a variety of input parameters and did numerical computations to make key stratigraphic surfaces with striking similarity. By forward modeling the depositional dynamics, he showed that there are at least two ways to make a maximum flooding surface, a sequence boundary, and top set aggradations. Non-uniqueness implies that there isn't just one model that fits the data, nor two, however Guy cleverly made simple comparisons to illustrate such ambiguities. The next step in this methodology, and it is a big step, is to express the entire model space: just how many solutions are there? 

If you were a farmer here, you lost your land

Henry Posamentier, seismic geomorphologist at Chevron, showed extremely high-resolution 3D sparker seismic imaging just beneath the seafloor in the Gulf of Thailand. Because this locale is more than 1000 km from the nearest continental shelf, it has been essentially unaffected by sea-level change, making it an ideal place to study pure fluvial depositional patterns. Such fluvial systems result in reservoirs in their accretionary point bars, but they are hard to predict.

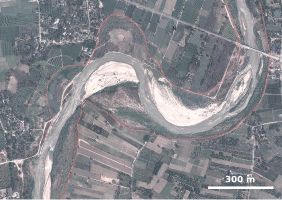
To make his point, Henry showed a satellite image of the Ping River from a few years ago in the north of Chiang Mai, where meander loops had shifted sporadically in response to one flood season: "If you were a farmer here, you lost your land."

Wells can tell about channel thickness, and seismic may resolve the channel width and the sinuosity, but only a dynamic model of the environment can suggest how well-connected is the sand.

The evolution of a single meandering channel belt

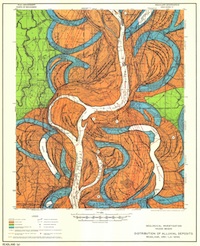
Ron Boyd from ConocoPhillips showed a four-step process investigating the evolution of a single channel belt in his talk, Tidal-Fluvial Sedimentology and Stratigraphy of the McMurray Formation.

  1. Start with a cartoon facies interpretation of channel evolution.
  2. Trace out the static geomorphological model on seismic time slices.
  3. Identify directions of fluvial migrations point by point, time step by time step.
  4. Distribute petrophysical properties within each channel element in chronological sequence.

Mapping the dynamics of a geologic scenario along a timeline gives you access to all the pieces of a single geologic puzzle. But what really matters is how that puzzle compares with the handful of pieces in your hand.

More tomorrow — stay tuned.

Google Earth imagery ©2014 DigitalGlobe, maps ©2014 Google

This post was modified on April 16, 2014, mentioning and giving redirects to Getech.

Looking forward to AAPG

Today we're en route to the AAPG Annual Convention & Exhibition (the ACE) in Houston. We have various things going on before it and after it too, so we're in Houston for 10 days of geoscience. Epic!

The appetizers

On Friday we're hosting a 'learning geoscience programming' bootcamp at START, our favourite Houston coworking space. Then we roll straight into our weekend programming workshop — Rock Hack — also at START. Everyone is welcome — programming newbies, established hackers. We want to build tools for working with well logs. You don't need any special skills, just ideas. Bring whatever you have! We'll be there from 8 am on Saturday. (Want more info?)

At least come for the breakfast tacos.

Conference highlight forecast

Regular readers will know that I'm a bit of a jaded conference-goer. But I haven't been to AAPG since Calgary in 2005, and I am committed to reporting the latest in geoscience goodness — so I promise to go to some talks and report back on this very blog. I'm really looking forward to it since Brian Romans whet my appetite with a round-up of his group's research offerings last week. 

I thought I'd share what else I'll be trying to get to. I can't find a way to link to the abstracts — you'll have to hunt them down in the Itinerary Planner... 

  • Monday am. Communicating our science. Jim Reilly, Iain Stewart, and others.
  • Monday pm. Case Studies of Geological and Geophysical Integration sounds okay, but might under-deliver. And there's a talk called 3-D Printing Artificial Reservoir Rocks to Test Their Petrophysical Properties, by Sergey Ishutov that should be worth checking out.
  • Tuesday am.  Petroleum Geochemistry and Source Rock Characterization, in honour of Wally Dow
  • Tuesday pm. Turbidites and Contourites, Room 360, is the place to be. Zane Jobe is your host.
  • Wednesday am. I'll probably end up in Seismic Visualization of Hydrocarbon Play Fairways.
  • Wednesday pm. Who can resist Space and Energy Frontiers? Not me.

That's about it. I'm teaching my geoscience writing course at a client's offices on Friday, then heading home. Evan will be hanging out and hacking some more I expect. Expect some updates to modelr.io!

If you're reading this, and you will be at AAPG — look out for us! We'll be the ones sitting on the floor near electrical outlets, frantically typing blog posts.

A long weekend of Atlantic geology

The Atlantic Geoscience Society Colloquium was hosted by Acadia University in Wolfville, Nova Scotia, this past weekend. It was the 50th Anniversay meeting, and attracted a crowd of about 175 geoscientists. A few members were able to reflect and tell stories first-hand of the first meeting in 1964.

It depends which way you slice it

Nova Scotia is one of the best places for John Waldron to study deformed sedimentary rocks of continental margins and orogenic belts. Being the anniversary, John traced the timeline of tectonic hypotheses over the last 50 years. From his kinematic measurements of Nova Scotia rocks, John showed the complexity of transtensional tectonics. It is easy to be fooled: you will see contraction features in one direction, and extension structures in another direction. It all depends which way you slice it. John is a leader in visualizing geometric complexity; just look at this animation of piecing together a coal mine in Stellarton. Oh, and he has a cut and fold exercise so that you can make your own Grand Canyon! 

The application of the Law of the Sea

In September 2012 the Bedford Institute of Oceanography acquired some multibeam bathymetric data and applied geomorphology equations to extend Canada's boundaries in the Atlantic Ocean. Calvin Campbell described the cruise as like puttering from Halifax to Victoria and back at 20 km per hour, sending a chirp out once a minute, each time waiting for it to go out 20 kilometres and come back.

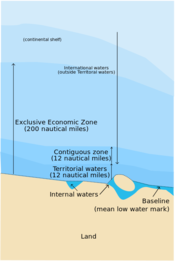
The United Nation's Convention on the Law of the Sea (UNCLOS) was established to define the rights and responsibilities of nations in their use of the world's oceans, establishing guidelines for businesses, the environment, and the management of marine natural resources. A country is automatically entitled to any natural resources found within a 200 nautical mile limit of its coastlines, but can claim a little bit more if they can prove they have sedimentary basins beyond that. 

Practicing the tools of the trade

Taylor Campbell, applied a post-stack seismic inversion workflow to the Penobscot 3D survey and wells. Compared to other software talks I have seen in industry, Taylor's was a quality piece of integrated technical work. This is even more commendable considering she is an undergraduate student at Dalhousie. My only criticism, which I shared with her after the talk was over, was that the work lacked a probing question. It would have served as an anchor for the work, and I think is one of the critical distinctions between scientific pursuits and engineering.

Image courtesy of Justin Drummond, 2014, personal communication, from his expanded abstract presented at GSA 2013.

Practicing rational inquiry

Justin Drummond's work, on the other hand, started with a nugget of curiosity: How did the biogeochemical cycling of phosphorite change during the Neoproterozoic? Justin's anchoring question came first, only then could he think about the methods, technologies and tools he needed to employ, applying sedimentology, sequence stratigraphy, and petrology to investigate phosphorite accumulation in the Sete Lagoas Formation. He won the award for Best Graduate Student presentation at the conference.

It is hard to know if he won because his work was so good, or if it was because of his impressive vocabulary. He put me in mind of what Rex Murphy would sound like if he were a geologist.

The UNCLOS illustration is licensed CC-BY-SA, by Wikipedia users historicair and MJSmit.

52 Things... About Geology

Welcome to the new book from Agile Libre! The newest, friendliest, awesomest book about petroleum geoscience. 

The book will be out later in November, pending review of the proof, but you can pre-order it now from Amazon.com at their crazy offer price of only $13.54. When it comes out, the book will hit Amazon.ca, Amazon.co.uk, and other online booksellers.

63 weeks to mature

It's truly a privilege to publish these essays. When an author hands over a manuscript, they are trusting the publisher and editors to do justice not just to the words, but to the thoughts inside. And since it's impossible to pay dozens of authors, they did it all for nothing. To recognize their contributions to the community, we're donating $2 from every book sale to the AAPG Foundation. Perhaps the students that benefit from the Foundation will go on to share what they know. 

This book took a little stamina, compared to 52 Things... Geophysics. We started inviting authors on 1 July 2012, and it took 442 days to get all the essays. As before, the first one came almost immediately; this time it was from George Pemberton, maintaining the tradition of amazing people being great champions for these projects. Indeed, Tony Doré — another star contributor — was a big reason the book got finished.

What's inside?

To whet your appetite, here are the first few chapters from the table of contents:

  • Advice for a prospective geologist — Mark Myers, 14th Director of the USGS
  • As easy as 1D, 2D, 3D — Nicholas Holgate, Aruna Mannie, and Chris Jackson
  • Computational geology — Mark Dahl, exploration geologist at ConocoPhillips
  • Coping with uncertainty — Duncan Irving at TeraData
  • Geochemical alchemy — Richard Hardman, exploration legend
  • Geological inversion — Evan Bianco of Agile
  • Get a helicopter not a hammer — Alex Cullum of Statoil

Even this short list samples some of the breadth of topics, and the range of experience of the contributors. Nichlas and Aruna are PhD students of Chris Jackson at Imperial College London, and Richard Hardman is a legend on the UK exploration scene, with over 50 years of experience. Between them, the 42 authors have notched up over 850 career-years — the book is a small window into this epic span of geological thinking.

We're checking the proofs right now. The book should be out in about 2 weeks, just in time for St Barbara's day!

Pre-order now from Amazon.com 
Save more than 25% off the cover price!

It's $13.54 today, but Amazon sets the final price... I don't know how long the offer will last. 

First appearance datum at Green Point

Armed with the Geologic Field Guide of Newfoundland, last week I ventured to one of the most intensely scrutinized outcrops in the world. Green Point in Gros Morne National Park provides continuous exposure to more than 30 million years of sediment accumulation in the Iapetus ocean. The rocks formed in deep water near the base of the ancient continental slope. It was awesome and humbling.

In January 2000, the International Union of Geological Sciences designated Green Point as a Global Stratotype Section and Point (GSSP). That's an official international reference point for the geologic time scale. I learned after the fact that there are only a handful of these in North America.

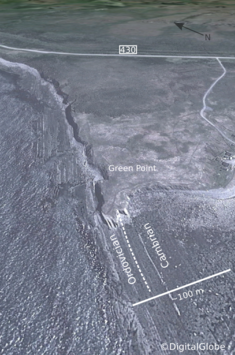
Researchers and students at Memorial University and elsewhere studied more than 10,000 fossils from Green Point, using tiny conodonts and delicate graptolites to locate the boundary between the Cambrian and Ordovician periods, 488 Ma in the past. They have narrowed it down to a single layer, Bed 23, that contains the first appearance of the conodant species, Iapetognathus fluctivagus.

To the best of my estimatation, I have indicated the location of Bed 23 with the white dashed line in the figure to the right, and with the pointing figure of my *ahem* geologic scale marker in the photograph below.

Snapshots from the Outcrop

Being the massive natural exhibition that it is, there are likely volumes of things to observe and measure at Green Point. I had no agenda whatsoever, but here are four observations that caught my interest:

  1. Cavities from core plugs at regularly spaced intervals. Each piece taken and studied as part of an international scientific experiment, aimed at accurately identifying major turning points in earth's history. 
  2. Small scale fault with some antithetic joints reminiscent of some artifacts I have seen on seismic.
  3. and 4. A faulted limestone conglomerate bed. Shown from two different points of view. I am increasingly curious about the nature of the aperture of deformation zones. Such formidable forces, such a narrow region of strain.

I left with a feeling that I am sure is felt by most geologists leaving a site of extreme interest. Did I make enough observations? Did I collect enough data? I wish I had a GigaPan, or maybe portable LiDAR station. I feel reconnected to the vastness of scales over which earth processes occur, and the heterogeneity caused by well-understood systems playing out over inconceivable expanses of time. 

I'd like to flip the outcrop 120° counterclockwise, and build another stupid seismic model. What could mathematicians, programmers, and geoscientists do at this outcrop? A digital playground for integration awaits.