The scales of geoscience
/ Helicopter at Mount St Helens in 2007. Image: USGS.Geoscientists' brains are necessarily helicoptery. They can quickly climb and descend, hover or fly. This ability to zoom in and out, changing scale and range, develops with experience. Thinking and talking about scales, especially those outside your usual realm of thought, are good ways to develop your aptitude and intuition. Intuition especially is bound to the realms of your experience: millimetres to kilometres, seconds to decades.
 Being helicoptery is important because processes can manifest themselves in different ways at different scales. Currents, for example, can result in sorting and rounding of grains, but you can often only see this with a hand-lens (unless the grains are automobiles). The same environment might produce ripples at the centimetre scale, dunes at the decametre scale, channels at the kilometre scale, and an entire fluvial basin at another couple of orders of magnitude beyond that. In moments of true clarity, a geologist might think across 10 or 15 orders of magnitude in one thought, perhaps even more.
A couple of years ago, the brilliant web comic artist xkcd drew a couple of beautiful infographics depicting scale. Entitled height and depth (left), they showed the entire universe in a logarithmic scale space. More recently, a couple of amazing visualizations have offered different visions of the same theme: the wonderful Scale of the Universe, which looks at spatial scale, and the utterly magic ChronoZoom, which does a similar thing with geologic time. Wonderful.
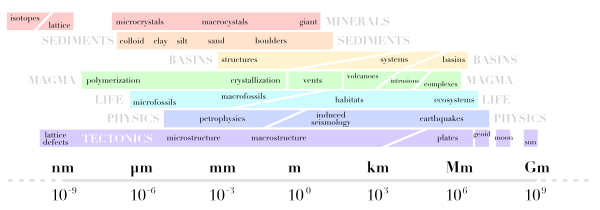
These creations inspired me to try to map geological disciplines onto scale space. You can see how I did below. I do like the idea but I am not very keen on my execution. I think I will add a time dimension and have another go, but I thought I'd share it at this stage. I might even try drawing the next one freehand, but I ain't no Randall Munroe.
I'd be very happy to receive any feedback about improving this, or please post your own attempts!
I have just finished a new version of this graphic, incorporating some comments from readers. I replaced the one in the original post, so please grab it from there if you want to see what I did.
If you like this post, you might also like the more recent one on the scales of relative sea-level change, and also this older one on the scales of various experiments in oil & gas geoscience.


 Except where noted, this content is licensed