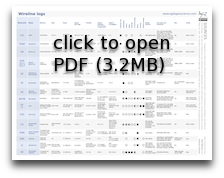
Petrophysics cheatsheet
/Geophysical logging is magic. After drilling, a set of high-tech sensors is lowered to the bottom of the hole on a cable, then slowly pulled up collecting data as it goes. A sort of geological endoscope, the tool string can measure manifold characteristics of the rocks the drillbit has penetrated: temperature, density, radioactivity, acoustic properties, electrical properties, fluid content, porosity, to name a few. The result is a set of well logs or wireline logs.
The trouble is there are a lot of different logs, each with its own idiosyncracies. The tools have different spatial resolutions, for example, and are used for different geological interpretations. Most exploration and production companies have specialists, called petrophysicists, to interpret logs. But these individuals are sometimes (usually, in my experience) thinly spread, and besides all geologists and geophysicists are sometimes faced with interpreting logs alone.
 We wanted to make something to help the non-specialist. Like our previous efforts, our new cheatsheet is a small contribution, but we hope that you will want to stick it into the back of your notebook. We have simplified things quite a bit: almost every single entry in this table needs a lengthy footnote. But we're confident we're giving you the 80% solution. Or 70% anyway.
Please let us know if and how you use this. We love hearing from our users, especially if you have enhancements or comments about usability. You can use the contact form, or leave a comment here.
Don't miss the follow-up to this post, from Wednesday 27 July, in which we explain why we thought we needed to build this cheatsheet.
And if you like this, please don't miss our other cheatsheets!


 Except where noted, this content is licensed