Build an app with Python

Do you have an idea for an app?

Or maybe a useful bit of code you want to share with others, but you’re not sure where to start?

Lots of people come to our Geocomputing class — which is for outright beginners — saying, "I want to build an app". Most of them are thinking of a mobile or desktop app, but most beginners don't know much about the alternatives. Getting useful software into other people’s hands doesn’t necessarily mean making a desktop application. Alternatives include programming libraries, command line tools, and web applications with or without public machine interfacecs (so-called APIs) — and it’s hard to discover and learn about things you don’t know exist.

Now, coming up with a streamlined set of questions to figure out which kind of tool might best match your goals for ‘an app’ is probably impossible. So I gave it a try:

There’s a lot of undocumented nuance in this flowchart. For example:

  • There are a lot of other ways to achieve all of the things I mention in the orange boxes. I picked on some examples, but you could also make a web app — with an API — with Flask or Django. You can make a library or CLI (command line interface) tool with modules from the standard library. There are lots of ways to build a desktop app with a GUI (none of them exactly easy). Indeed, you can run a web app on the desktop in various ways.

  • You might be wondering, “where is ‘Build a mobile app’?” It’s not there. I don’t think building native mobile apps is usually the best idea, especially for relative beginners to Python. Web apps are easier to make, they work on any platform, and are easier to maintain. It helps if you’re online of course, but it is possible to write web apps that work offline too.

  • The main idea is to make something. You want to build the easiest or fastest thing that solves the problem for a few important users and use cases. Because if you can make something they will at least test a few times, you can get some awesome feedback for the next iteration — which might be a completely different thing.

So, take it with a large grain of salt! I hope it’s a tiny bit useful, and at least gives you some things to Google the next time you’re thinking about building ‘an app’.


I tweeted about this flowchart. If you want to adapt it for your own purposes, the original is here.

Thank you to Software Undergrounders Rafael, Lukas, Leo, Kent, Rob, Martin and Evan for helping me improve it. I’m still responsible for its many flaws.

The machine learning algo zoo

One of the wonderful, but also baffling, things about machine learning is that there are so many ways to do it. At some very high level, most of them do something like this (highlighting some jargon):

  1. The human settles on a task (“Predict lithology”) and finds a bunch of data relevant to that task (say, some well logs A, B, and C). Then the human has to come up with some known instances or examples where these well log data go with those lithology labels.

  2. Stuff the logs into an equation. Not an equation like A + B + C, because there’s nothing to tweak in that equation. The equation needs parameters or coefficients, like \(\alpha A + \beta B + \gamma C\). The machine can tweak those Greek letters to change the output. At first, they’ll be random guesses.

  3. See how the output of that equation, which is the machine’s prediction, compares to the known labels. Come up with another equation whose output is a good measure of how far away the predictions are from the known labels. This distance is called the cost, and the equation to compute it the cost function.

  4. Now that the machine has something to guess (the Greek parameters) and a way to know how well its doing (the cost function), it just needs a way to minimize the cost, or to put it another way, optimize the parameters. This optimization process is called learning.

Together, these steps constitute a learning algorithm. An algorithm with a set of optimized weights is usually referred to simply as a model.

All the algorithms

Every piece of this story is worth a whole blog post on its own, but for today let’s stay high-level.

The problem is that the algorithm zoo can be overwhelming. My post last week was an attempt to compare a lot of regression algorithms, in terms of how they make sense of three synthetic datasets.

Today I’m sharing a Big Giant Spreadsheet™ that attempts to compare some of the most popular ‘shallow’ learning algorithms in terms of their most important characteristics. For example, can they predict probabilities? Are they deterministic? What are the key hyperparameters? And so on.

Here’s a small version of the table (see the links below for other versions):

There’s a PDF version here — and here’s the original spreadsheet.

Eventually, I’m visualizing a poster for the wall. I think it would be nice to have some equations on here. Maybe the plots from the various comparisons too (see last weeks post!). And even more advice, like which ones break when you have too many features. What else would you like to see on there?

Petroleum cheatsheet

I have just finished teaching one semester of Petroleum Geoscience at Dalhousie University. It's not quite over: I am still marking, marking, marking. The experience was all of the following, mostly simultaneously:

  • scarily exposing
  • surprisngly eye-opening
  • deeply exhausting
  • personally motivating
  • professionally educational
  • ultimately satisying
  • predominantly fun

Lucrative? No, but I did get paid. Regrettable? No, I'm very happy that I did it. I'm not certain I'd do it again... perhaps if it was the very same course, now that I have some material to build on. 

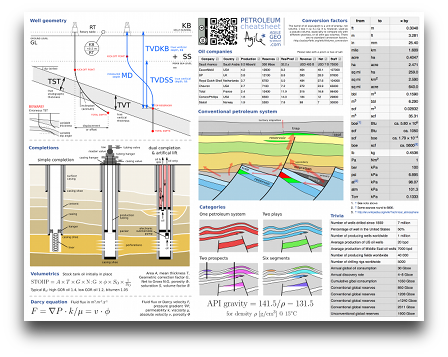
One of the things I made for my students was a cheatsheet. I'd meant to release it into the wild long ago, but I'm pleased to say that today I have tweaked and polished and extended it and it's ready. There will doubtless be updates as our cheatsheet faithful expose my schoolboy errors (please do!), but version 1.0 is here, still warm from the Inkscape oven.

This is the fifth cheatsheet in our collection. If you find a broken link, do let us know, as I have moved them into a new folder today. Enjoy!

Why petrophysics is hard

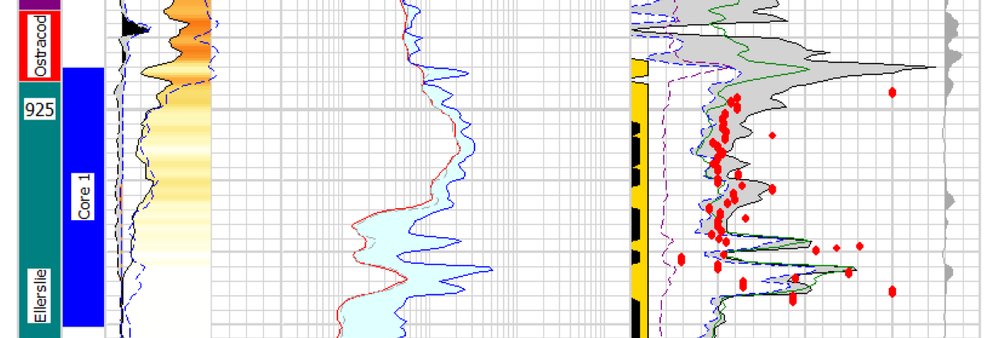
Earlier this week we published our fourth cheatsheet, this time for well log analysis or petrophysics. (Have you seen our other cheatsheets?) Why did we think this was a subject tricky enough to need a cheatsheet in the back of your notebook? I think there are at least three things which make the interpretation of log data difficult:

Most of the tools do not directly measure properties we are interested in. For example, the radioactivity of the rocks is not important to us, but it does make a reliable clay and organic matter proxy, because these substances tend to have more uranium and other radioactive elements in them. Almost all of the logs are just proxies for the data we really need. 

We only see the rocks through the filter of the method. Even if we could perfectly derive apparent reservoir properties from the logs, there are lots of reasons why they might be less than accurate. For example, the drilling fluid (usually some sort of brine- or oil-based suspension of mud) tends to invade the rocks, especially the more permeable formations, the very ones we are interested in. The drilling fluid can also interfere with some tools, depending on its composition: barite absorbs gamma-rays, for example. 

The field is infested with jargon and historical baggage. Since Conrad and Marcel Schlumberger invented the technique almost 100 years ago, thousands of new tools and new methods have been invented. Every tool and log has its own name, method (usually proprietary these days) and idiosyncracies, making for a bewildering, intimidating even, menagerie. Worse still, lots of modern tools collect multi-dimensional data: for example, sonic spectra on multiple axes, magnetic resonance T2 distributions, dynamically-scaled image logs. 

We drew from several sources to build our cheatsheet. We drew partly from our own experience, but also relied on input from some petrophysical specialists: Neil Watson of Atlantic Petrophysics, Andrea Creemer of Corridor Resources, and Ross Crain of Spectrum 2000. We also consulted the following references, synthesizing liberally where they disagreed (quite often, given the range of vintages of these works).

Despite referring to some of the best sources in the industry, we hereby assert that all errors are attributable to us, not our sources. If you find errors, please let us know. Get in touch on Twitter, use the contact form, or leave a comment.

Part of Viking's Provost A4-23 in 36-6, in Alberta, Canada.

Petrophysics cheatsheet

Geophysical logging is magic. After drilling, a set of high-tech sensors is lowered to the bottom of the hole on a cable, then slowly pulled up collecting data as it goes. A sort of geological endoscope, the tool string can measure manifold characteristics of the rocks the drillbit has penetrated: temperature, density, radioactivity, acoustic properties, electrical properties, fluid content, porosity, to name a few. The result is a set of well logs or wireline logs.

The trouble is there are a lot of different logs, each with its own idiosyncracies. The tools have different spatial resolutions, for example, and are used for different geological interpretations. Most exploration and production companies have specialists, called petrophysicists, to interpret logs. But these individuals are sometimes (usually, in my experience) thinly spread, and besides all geologists and geophysicists are sometimes faced with interpreting logs alone.

We wanted to make something to help the non-specialist. Like our previous efforts, our new cheatsheet is a small contribution, but we hope that you will want to stick it into the back of your notebook. We have simplified things quite a bit: almost every single entry in this table needs a lengthy footnote. But we're confident we're giving you the 80% solution. Or 70% anyway. 

Please let us know if and how you use this. We love hearing from our users, especially if you have enhancements or comments about usability. You can use the contact form, or leave a comment here

How to cheat

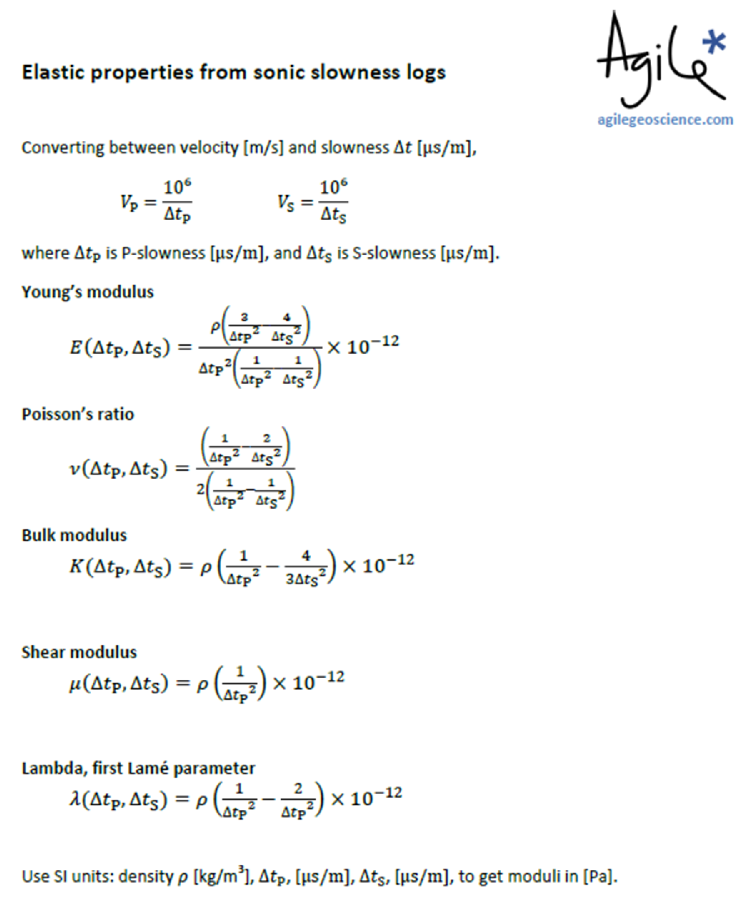
Yesterday I posted the rock physics cheatsheet, which is a condensed version of useful seismic reservoir characterization and rock mechanics concepts. It's cheat as in simplify, not cheat as in swindle. 

As Matt discussed on Friday, heuristics can be shortcuts to hone your intuition. Our minds search to use rules of thumb to visualise the invisible and to solve sticky problems. That's where the cheat sheet comes in. You might not find rock physics that intuitive, but let's take a look at the table to see how it reveals some deeper patterns.

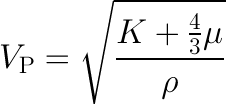
The table of elastic parameters is setup based on the fundamental notion that, if you have any two elastic properties previously defined, you can compute all the others. This is a consequence of one of the oldest laws in classical mechanics: Newton's second law, F=ma. In particular one thing I find profound about seismic velocity is that it is wholly determined by a ratio of competing tensional (elastic) forces to inertial (density) forces. To me, it is not immediately obvious that speed, with units of m/s, results from the ratio of pressure to density. 

This simple little equation has had a profound impact on the utility of seismology to the oil and gas industry. It links extrinsic dynamic properties (VP) to intrinsic rock properties (K, μ, ρ). The goal of course, is not just to investigate elastic properties for the sake of it, but to link elastic properties to reservoir and petrophysical properties. This is traditionally done using a rock physics template. The one I find easiest to understand is the VP/VS vs P-impedance template, an example of which is shown on the cheatsheet. You will see others in use, for instance Bill Goodway has pioneered the λρ vs μρ (LMR) template.

In an upcoming post we'll look to deepen the connection between Newtonian mechanics and reservoir characterization. 

Rock physics cheatsheet

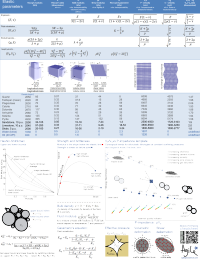
Today, I introduce to you the rock physics cheatsheet. It contains useful information for people working on problems in seismic rock physics, inversion, and the mechanical properties of rocks. Admittedly, there are several equations, but I hope they are laid out in a simple and systematic way. This cheatsheet is the third instalment, following up from the geophysics cheatsheet and basic cheatsheet we posted earlier. 

To me, rock physics is the crucial link between earth science and engineering applications, and between reservoir properties and seismic signals. Rocks are, in fact, a lot like springs. Their intrinsic elastic parameters are what control the extrinsic seismic attributes that we collect using seismic waves. With this cheatsheet in hand you will be able to model fluid depletion in a time-lapse sense, and be able to explain to somebody that Young's modulus and brittleness are not the same thing.

So now with 3 cheatsheets at your fingertips, and only two spaces on the inside covers of you notebooks, you've got some rearranging to do! It's impossible to fit the world of seismic rock physics on a single page, so if you feel something is missing or want to discuss anything on this sheet, please leave a comment.

Click to download the PDF (1.5MB)

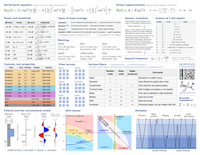
Geophysics cheatsheet

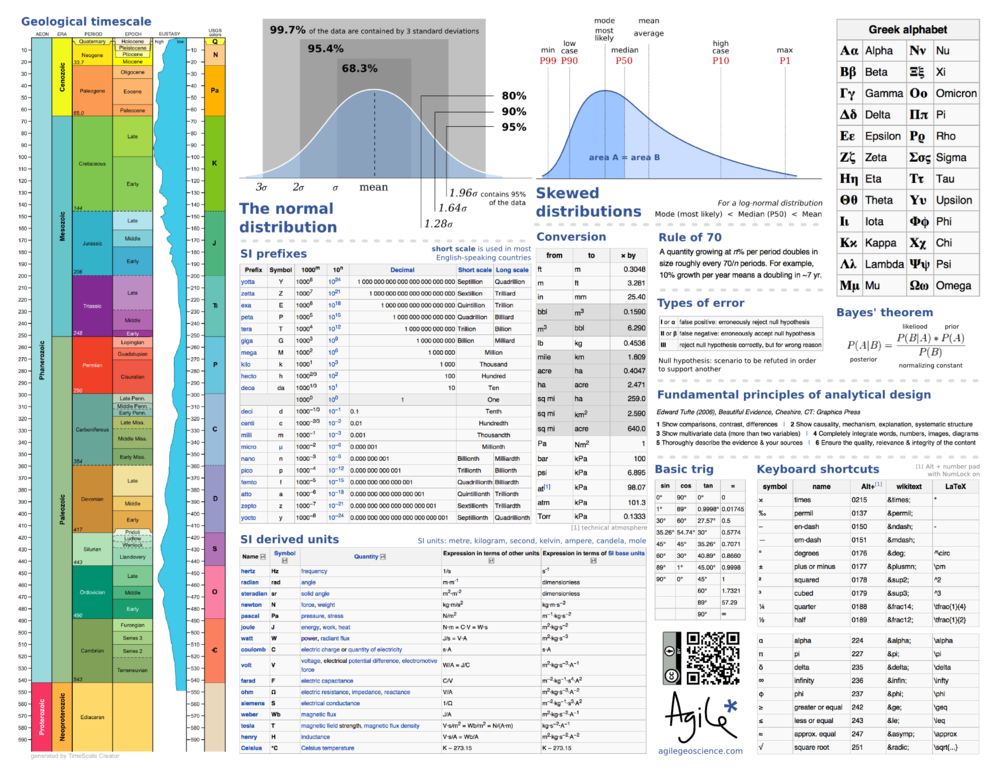
A couple of weeks ago I posted the first cheatsheet, with some basic science tables and reminders. The idea is that you print it out, stick it in the back of your notebook, and look like a genius and/or smart alec next time you're in a meeting and someone asks, "How long was the Palaeogene?" (21 Ma) or "Is the P50 the same as the Most Likely? I can never remember," (no, it's not).

Today I present the next instalment: a geophysics cheatsheet. It contains mostly basic stuff, and is aimed at the interpreter rather than the weathered processor or number-crunching seismic analyst. I have included Shuey's linear approximation of the Zoeppritz equations; it forms the basis for many simple amplitude versus offset (AVO) analyses. But there's also the Aki–Richards equation, which is often used in more advanced pre-stack AVO analysis. There are some reminders of typical rock properties, modes of seismic multiples, and seismic polarity. 

As before, if there's anything you think I've messed up, or wrongly omitted, please leave a comment. We will be doing more of these, on topics like rock physics, core description, and log analysis. Further suggestions are welcome!

Click to download the PDF (1.6MB)

Basic cheatsheet

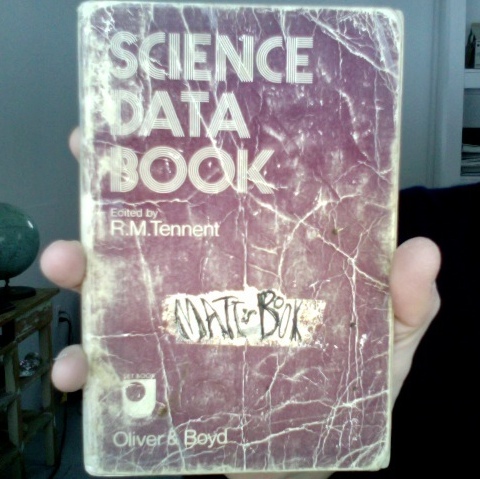
When I was a spotty schoolboy my favourite book was the Science Data Book. This amazing little book, which fit in my jacket pocket (we wore suits to school), went everywhere with me. Everywhere at school, I mean, I'm not that much of a nerd.

It contains some really handy stuff: the Greek alphabet, SI unit definitions, the periodic table, the fundamental constants, handy formulae like the Maclaurin series, (remember that?), and even a very nice table of isotopes (did you know that the half-life of vanadium-50 is 400 trillion years?).

Amazingly, there are some used copies of that little book on Amazon

You might think that in these days of smartphones and WiFi everywhere there's no need for such things. But have you never sat in a meeting or lecture and just couldn't remember how many acres in a hectare (2.47), or when the Silurian was (417 Ma BP)? Usually it's too much hassle to pull out my phone, then find Wikipedia and the one piece of data I need. Especially when tapping away on a cell phone looks like you're texting someone 'So bored, please get me out of this meeting, call me in 5 mins?'.

So, I give you the first in a series of cheatsheets. This one has mostly basic stuff on it; future editions will have more geoscience-related content. Print it out and stick in your notebook, or maybe on your wall, right next to Signs & Symbols.

If you use it, please let me know what you like or dislike, so I can improve it. Have I missed anything you're always looking up?

← Click on the image for the PDF