
The spectrum of the spectrum
/A few weeks ago, I wrote about the notches we see in the spectrums of thin beds, and how they lead to the mysterious quefrency domain. Today I want to delve a bit deeper, borrowing from an article I wrote in 2006.
Why the funny name?
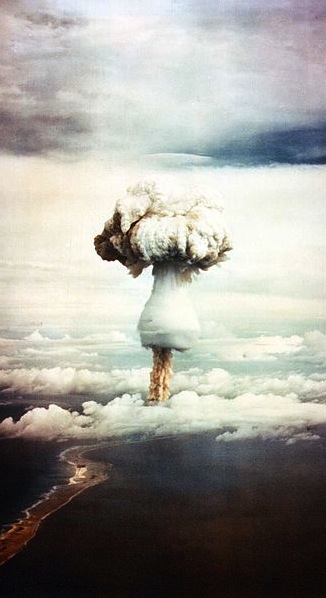 During the Cold War, the United States government was quite concerned with knowing when and where nuclear tests were happening. One method they used was seismic monitoring. To discriminate between detonations and earthquakes, a group of mathematicians from Bell Labs proposed detecting and timing echoes in the seismic recordings. These echoes gave rise to periodic but cryptic notches in the spectrum, the spacing of which was inversely proportional to the timing of the echoes. This is exactly analogous to the seismic response of a thin-bed.
To measure notch spacing, Bogert, Healy and Tukey (1963) invented the cepstrum (an anagram of spectrum and therefore usually pronounced kepstrum). The cepstrum is defined as the Fourier transform of the natural logarithm of the Fourier transform of the signal: in essence, the spectrum of the spectrum. To distinguish this new domain from time, to which is it dimensionally equivalent, they coined several new terms. For example, frequency is transformed to quefrency, phase to saphe, filtering to liftering, even analysis to alanysis.
Today, cepstral analysis is employed extensively in linguistic analysis, especially in connection with voice synthesis. This is because, as I wrote about last time, voiced human speech (consisting of vowel-type sounds that use the vocal chords) has a very different time–frequency signature from unvoiced speech; the difference is easy to quantify with the cepstrum.
What is the cepstrum?
To describe the key properties of the cepstrum, we must look at two fundamental consequences of Fourier theory:
- convolution in time is equivalent to multiplication in frequency
- the spectrum of an echo contains periodic peaks and notches
Let us look at these in turn. A noise-free seismic trace s can be represented in the time t domain by the convolution of a wavelet w and reflectivity series r thus
Then, in the frequency f domain
In other words, convolution in time becomes multiplication in frequency. The cepstrum is defined as the Fourier transform of the log of the spectrum. Thus, taking logs of the complex moduli
Since the Fourier transform F is a linear operation, the cepstrum is
We can see that the spectrums of the wavelet and reflectivity series are additively combined in the cepstrum. I have tried to show this relationship graphically below. The rows are domains. The columns are the components w, r, and s. Clearly, these thin beds are resolved by this wavelet, but they might not be in the presence of low frequencies and noise. Spectral and cepstral analysis—and alanysis—can help us cut through the seismic and get at the geology.
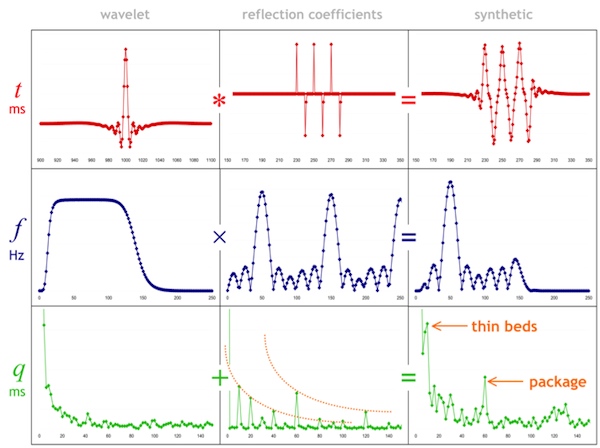
Time series (top), spectra (middle), and cepstra (bottom) for a wavelet (left), a reflectivity series containing three 10-ms thin-beds (middle), and the corresponding synthetic trace (right). The band-limited wavelet has a featureless cepstrum, whereas the reflectivity series clearly shows two sets of harmonic peaks, corresponding to the thin- beds (each 10 ms thick) and the thicker composite package.
References
Bogert, B, Healy, M and Tukey, J (1963). The quefrency alanysis of time series for echoes: cepstrum, pseudo-autocovariance, cross- cepstrum, and saphe-cracking. Proceedings of the Symposium on Time Series Analysis, Wiley, 1963.
Hall, M (2006). Predicting stratigraphy with cepstral decomposition. The Leading Edge 25 (2), February 2006 (Special issue on spectral decomposition). doi:10.1190/1.2172313
Greenhouse George image is public domain.


 Except where noted, this content is licensed