
Fabric attributes
/The catch-all term seismic interpretation, often used to refer to the labour of digitizing horizons and faults, is almost always spatially constrained. Picking seismic line-by-line means collapsing complex 3D patterns and volumes onto 2D maps and surfaces. It hurts me to think about what we are discarding. Take a second and imagine looking at a photograph one row of pixels at a time. So much is lost in the simplification.
Attributes, on the other hand, can either quantify the nature of a horizon, probe between horizons, or characterize an entire 3D space. Single-trace attributes can tell us about waveform shape and magnitude which allegedly responds to true physical impedance contrasts. Multi-trace attributes (coherency, curvature, etc.) pull information from neighbouring traces.
The fabric test model
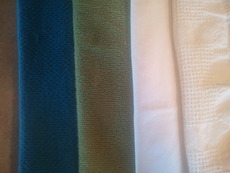 In a spirited act of geeky indulgence, I went to my linen closest, grabbed some tea towels, pulled out my phone (obviously), and captured this scene. A set of four folded tea towels overlapping and spread across my counter top—reverse engineering what I thought to be a suitable analogy for training my seismic inutition. The left (blue) tea towel is a honeycomb texture, the second (green) is speckled like a wash cloth, the third is a high thread-count linen, and the fourth has a grid of alternating cross-hatches and plain print. Don't laugh! It turns out to be quite difficult to verbally describe the patterns in these fabrics. Certainly, you will describe them differently to me, and that is the problem.
Perhaps image processing can transcend our linguistic limitations. In seismic, as in image processing in general, there are attributes that work on each sample (or trace) independently, and there are attributes that use an ensemble of neighbouring samples in their computation. See if you can think a seismic analogy in the for each of these image attributes.
- Spectral decomposition shows the component of the RGB color spectrum at each sample location. I subsequently clipped and enhanced the red panel to show curves, wrinkles and boundaries caused by the interplay of light, shadows, and morphology.
- Spectral filtering extracts or removes hues. In this instance, I have selected all the color triplets that make up the blue tea towel. You could also select a range to say, show where the shadows are.
- Edge detection, after smoothing, shows sharp edges in white and yellow, soft edges in purple and blue. The wrinkles and subtle folds on the right most fabric have also been detected.
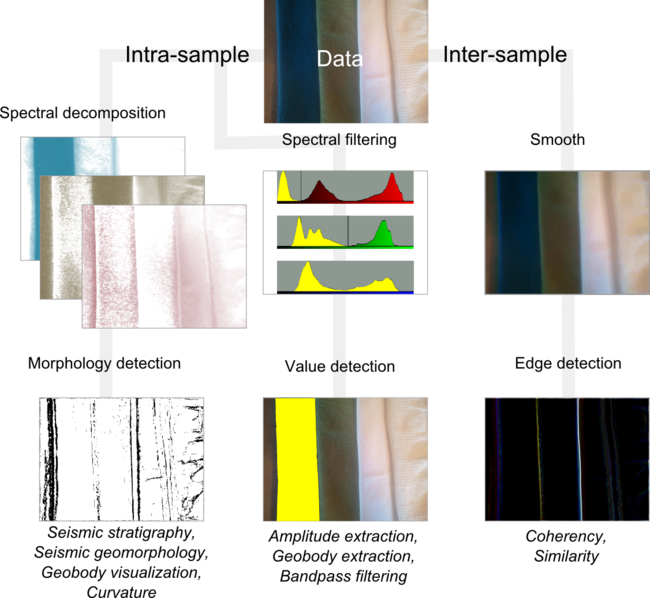
My question: can you manually draw the morphology, or the blues, or the edges and discontinuities? Manual interpretation is time consuming, prone to error, seldom reproducible, and that makes it flawed. Furthermore, none of these attributes actually tell us about the nature of the textures in the fabric. Indeed, we don't know if any of them are relevant at all. Colour happens to be one proxy for texture in this case, but it fails in delineating the two whitish fabrics.
Artistically and computationally speaking, I submit to you that seismic data are nothing but images. In the next post I will extend this fabric-photograph model to explore the utility of textural attributes.
Theses images were made using the open source FIJI and the illustrations were done in Inkscape. The attributes were computed in MATLAB and FIJI.


 Except where noted, this content is licensed