Coding to tell stories
/Last week, I was in Calgary on family business, but I took an afternoon to host a 'private beta' for a short course that I am creating for geoscience computing. I invited about twelve familiar faces who would be provide gentle and constuctive feedback. In the end, thirteen geophysicists turned up, seven of whom I hadn't met before. So much for familiarity.
I spent about two and half hours stepping through the basics of the Python programming language, which I consider essential material — getting set up with Python via Enthought Canopy, basic syntax, and so on. In the last hour of the afternoon, I steamed through a number of geoscientific examples to showcase exercises for this would-be course.
Here are three that went over well. Next week, I'll reveal the code for making these images. I might even have a go at converting some of my teaching materials from IPython Notebook to HTML:
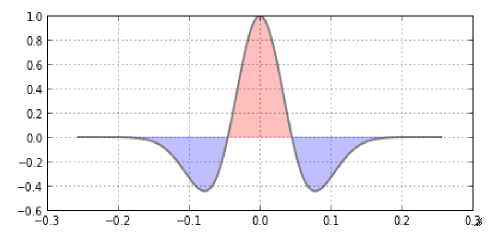
 To plot a wavelet
The Ricker wavelet is a simple analytic function that is used throughout seismology. This curvaceous waveform is easily described by a single variable, the dominant frequency of its many contituents frequencies. Every geophysicist and their cat should know how to plot one:
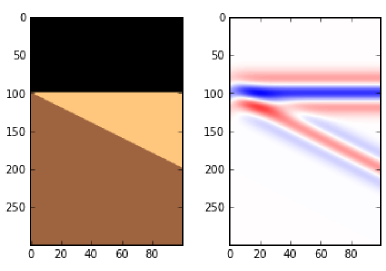
To make a wedge

Once you can build a wavelet, the next step is to make that wavelet interact with the earth. The convolution of the wavelet with this 3-layer impedance model yields a synthetic seismogram suitable for calibrating seismic signals to subtle stratigraphic geometries. Every interpreter should know how to build a wedge, with site-specific estimates of wavelet shape and impedance contrasts. Wedge models are important in all instances of dipping and truncated layers at or below the limit of seismic resolution. So basically they are useful all of the time.
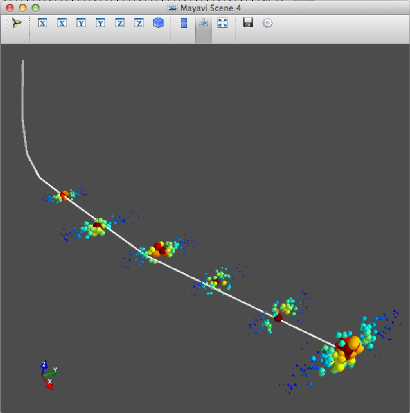
To make a 3D viewer

The capacity of Python to create stunning graphical displays with merely a few (thoughtful) lines of code seemed to resonate with people. But make no mistake, it is not easy to wade through the hundreds of function arguments to access this power and richness. It takes practice. It appears to me that practicing and training to search for and then read documentation, is the bridge that carries people from the mundane to the empowered.
This dry-run suggested to me that there are at least two markets for training here. One is a place for showing what's possible — "Here's what we can do, now let’s go and build it". The other, more arduous path is the coaching, support, and resources to motivate students through the hard graft that follows. The former is centered on problem solving, the latter is on problem finding, where the work and creativity and sweat is.
Would you take this course? What would you want to learn? What problem would you bring to solve?
Update: the first follow-up post in this series is a code-based tutorial on how to plot a wavelet, and has an announcement about two 1-day events I will be holding in Calgary in the new year (January 10, and January 13, 2014).


 Except where noted, this content is licensed