Getting started with Modelr
/Let's take a closer look at modelr.io, our new modeling tool. Just like real seismic experiments, there are four components:
- Make a framework. Define the geometries of rock layers.
- Make an earth. Assign a set of rock properties to each layer.
- Make a kernel. Define the seismic survey.
- Make a plot. Set the output parameters.
Modelr takes care of the physics of wave propagation and reflection, so you don't have to stick with normal incidence acoustic impedance models if you don't want to. You can explore the full range of possibilities.
 3 ways to slice a wedge
To the uninitiated, the classic 3-layer wedge model may seem ridiculously trivial. Surely the earth looks more complicated than that! But we can leverage such geometric simplicity to systematically study how seismic waveforms change across spatial and non-spatial dimensions.
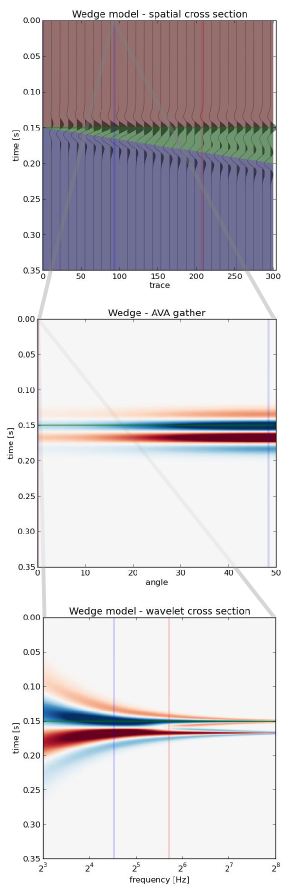
Spatial domain. In cross-section (right), a seismic wedge model lets you analyse the resolving power of a given wavelet. In this display the onset of tuning is marked by the vertical red line, and the thickness at which maximum tuning occurs is shown in blue. Reflection profiles can be shown for any incidence angle, or range of incidence angles (offset stack).
Amplitude versus angle (AVA) domain. Maybe you are working on a seismic inversion problem so you might want to see what a CDP angle gather looks like above and below tuning thickness. Will a tuned AVA response change your quantitative analysis? This 3-layer model looks like a two-layer AVA gather except our original wavelet looks like it has undergone a 90 degree phase rotation. Looks can be deceiving.
Amplitude versus frequency domain. If you are trying to design a seismic source for your next survey, and you want to ensure you've got sufficient bandwidth to resolve a thin bed, you can compute a frequency gather — right, bottom — and explore a swath of wavelets with regard to critical thickness in your prospect. The tuning frequency (blue) and resolving frequency (red) are revealed in this domain as well.
Wedges are tools for seismic waveform classification. We aren't just interested in digitizing peaks and troughs, but the subtle interplay of amplitude tuning, and apparent phase rotation variations across the range of angles and bandwidths in the seismic experiment. We need to know what we can expect from the data, from our supposed geology.
In a nutshell, all seismic models are about illustrating the band-limited nature of seismic data on specific geologic scenarios. They help us calibrate our intuition when bandwidth causes ambiguity in interpretation. Which is nearly all of the time.


 Except where noted, this content is licensed