
Images as data
/
I was at the Atlantic Geoscience Society's annual meeting on Friday and Saturday, held this year in a cold and windy Truro, Nova Scotia. The AGS is a fairly small meeting — maybe a couple of hundred geoscientists make the trip — but usually good value, especially if you're working in the area.
A few talks and posters caught my attention, as they were all around a similar theme: getting data from images. Not in an interpretive way, though — these papers were about treating images fairly literally. More like extracting impedance from seismic than, say, making a horizon map.
Drone to stereonet
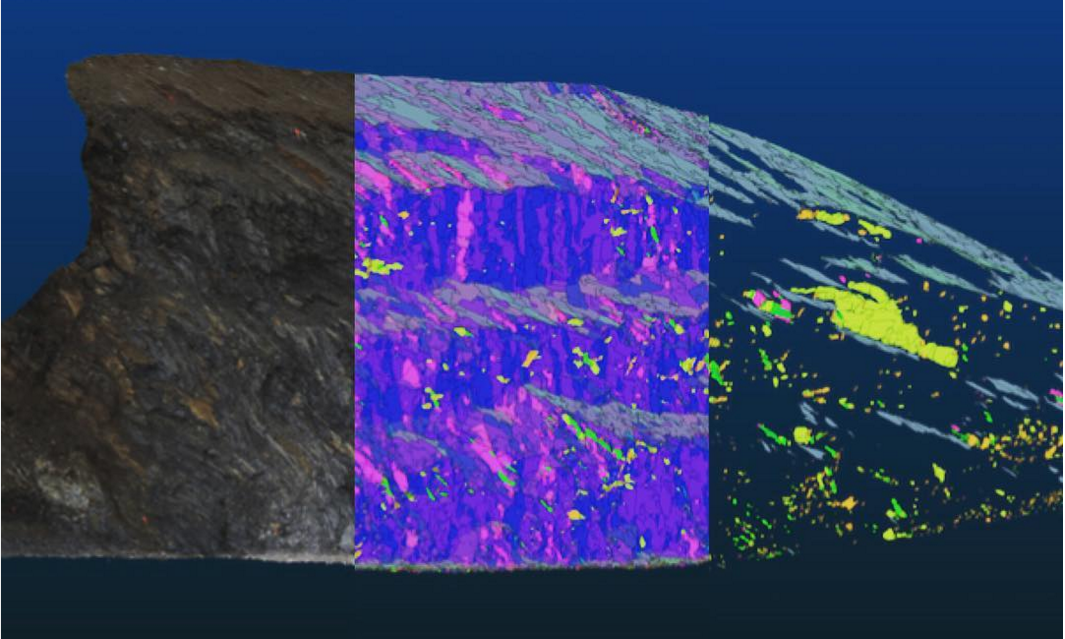
Amazing 3D images generated from a large number of 2D images of outcrop. LEft: the natural colour image. Middle: all facets generated by point cloud analysis. Right: the final set of human-filtered facets. © Joseph Cormier 2016
Probably the most eye-catching poster was that of Joseph Cormier (UNB), who is experimenting with computer-assisted structural interpretation. Using dozens of high-res photographs collected by a UAV, Joseph combines them to create reconstruct the 3D scene of the outcrop — just from photographs, no lidar or other ranging technology. The resulting point cloud reveals the orientations of the outcrop's faces, as well as fractures, exposed faults, and so on. A human interpreter can then apply her judgment to filter these facets to groups of tectonically significant sets, at which point they can be plotted on a stereonet. Beats crawling around with a Brunton or Suunto for days!
Hyperspectral imaging
There was another interesting poster by a local mining firm that I can't find in the abstract volume. They had some fine images from CoreScan, a hyperspectral imaging and analysis company operating in the mining industry. The technology, which can discern dozens of rock-forming minerals from their near infrared and shortwave infrared absorption characteristics, seems especially well-suited to mining, where mineralogical composition is usually more important than texture and sedimentological interpretation.
Isabel Chavez (SMU) didn't need a commercial imaging service. To help correlate Laurasian shales on either side of the Atlantic, she presented results from using a handheld Konica-Minolta spectrophotometer on core. She found that CIE L* and a* colour parameters correlated with certain element ratios from ICP-MS analysis. Like many of the students at AGS, Isabel was presenting her undergraduate thesis — a real achievement.
Interesting aside: one of the chief applications of colour meters is measuring the colour of chips. Fascinating.
The hacker spirit is alive and well

The full spectrum (top), and the CCD responses with IR filter, Red filter, green filter, and blue filter (bottom). All of the filters admitted some infrared light, causing problems for calibration. © Robert McEwan 2016.
After seeing those images, and wishing I had a hyperspectral imaging camera, Rob McEwan (Dalhousie) showed how to build one! In a wonderfully hackerish talk, he showed how he's building a $100 mineralogical analysis tool. He started by removing the IR filter from a second-hand Nikon D90, then — using a home-made grating spectrometer — measured the CCD's responses in the red, green, blue, and IR bands. After correcting the responses, Rob will use the USGS spectral library (Clark et al. 2007) to predict the contributions of various minerals to the image. He hopes to analyse field and lab photos at many scales.
Once you have all this data, you also have to be able to process it. Joshua Wright (UNB) showed how he has built a suite of VisualBasic Macros to segment photomicrographs into regions representing grains using FIJI, then post-process the image data as giant arrays in an Excel spreadsheet (really!). I can see how a workflow like this might initially be more accessible to someone new to computer programming, but I felt like he may have passed Excel's sweetspot. The workflow would be much smoother in Python with scikit-image, or MATLAB with the Image Processing Toolbox. Maybe that's where he's heading. You can check out his impressive piece of work in a series of videos; here's the first:
Looking forward to 2016
All in all, the meeting was a good kick off to the geoscience year — a chance to catch up with some local geoscientists, and meet some new ones. I also had the chance to update the group on striplog, which generated a bit of interest. Now I'm back in Mahone Bay, enjoying the latest winter storm, enjoying the feeling of having something positive to blog about!
Please be aware that, unlike the images I usually include in posts, the images in this post are not open access and remain the copyright of their respective authors.
References
Isabel Chavez, David Piper, Georgia Pe-Piper, Yuanyuan Zhang, St Mary's University (2016). Black shale Selli Level recorded in Cretaceous Naskapi Member cores in the Scotian Basin. Oral presentation, AGS Colloquium, Truro NS, Canada.
Clark, R.N., Swayze, G.A., Wise, R., Livo, E., Hoefen, T., Kokaly, R., Sutley, S.J., 2007, USGS digital spectral library splib06a: U.S. Geological Survey, Digital Data Series 231
Joseph Cormier, Stefan Cruse, Tony Gilman, University of New Brunswick (2016). An optimized method of unmanned aerial vehicle surveying for rock slope analysis, 3D modeling, and structural feature extraction. Poster, AGS Colloquium, Truro NS, Canada.
Robert McEwan, Dalhousie University (2016). Detecting compositional variation in granites – a method for remotely sensed platform. Oral presentation, AGS Colloquium, Truro NS, Canada.
Joshua Wright, University of New Brunswick (2016). Using macros and advanced functions in Microsoft ExcelTM to work effectively and accurately with large data sets: An example using sulfide ore characterizatio. Oral presentation, AGS Colloquium, Truro NS, Canada.


 Except where noted, this content is licensed