In search of the Kennetcook Thrust

Behind every geologic map, is a much more complex geologic truth. Most of the time it's hidden under soil and vegetation, forcing geologists into a detective game in order to fill gaps between hopelessly sparse spatterings of evidence.

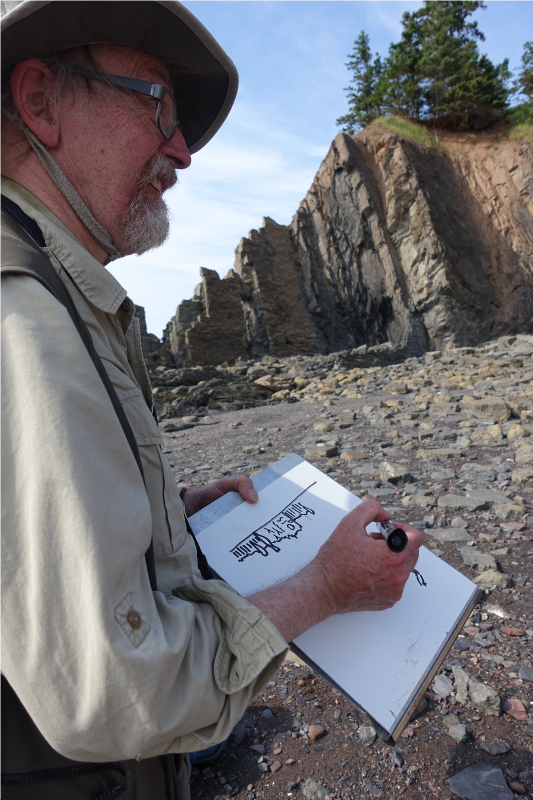
Two weeks ago, I joined up with an assortment of geologists on the side of the highway an hour north of Halifax for John Waldron to guide us along some spectacular stratigraphy exposed in the coastline cliffs on the southern side of the Minas Basin (below). John has visited these sites repeatedly over his career, and he's supervised more than a handful of graduate students probing a variety of geologic processes on display here. He's published numerous papers teasing out the complex evolution of the Windsor-Kennetcook Basin: one of three small basins onshore Nova Scotia with the potential to contain economic quantities of hydrocarbons.

John retold the history of mappers past and present riddled by the massively deformed, often duplicated Carboniferous evaporites in the Windsor Group which are underlain by sub-horizontal seismic reflectors at depth. Local geologists agree that this relationship reflects thrusting of the near-surface package, but there is disagreement on where this thrust is located, and whether and where it intersects the surface. On this field trip, John showed us symptoms of this Kennetcook thrust system, at three sites. We started in the footwall. The second and third sites were long stretches spectacularly deformed exposures in the hangingwall.  

Footwall: Cheverie Point

SEE GALLERY BELOW FOR ENLARGEMENT

SEE GALLERY BELOW FOR ENLARGEMENT

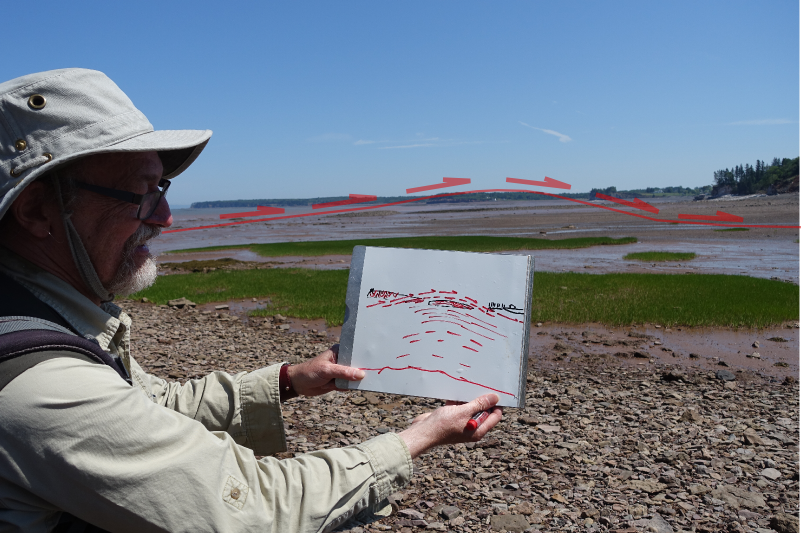
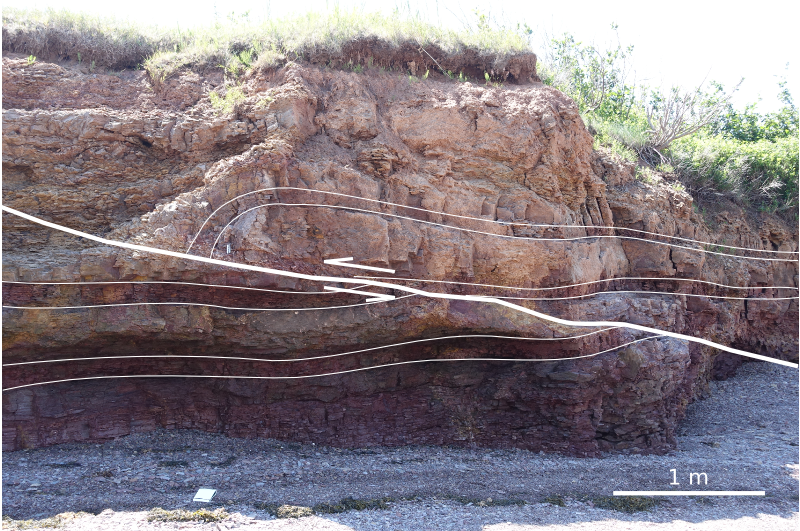
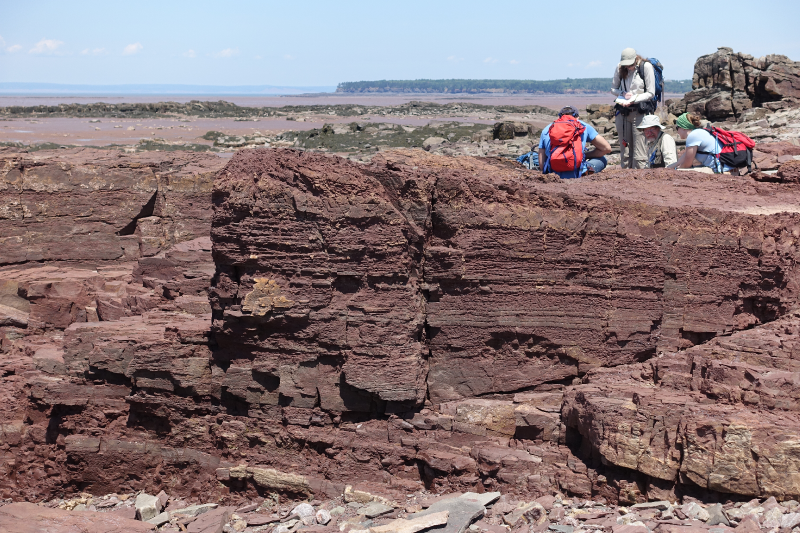
The first stop was Cheverie Point and is interpreted to be well in the footwall of the Kennetcook thrust. Small thrust faults (right) cut through the type section of the Macumber Formation and match the general direction of the main thrust system. The Macumber Formation is a shallow marine microbial limestone that would have fooled anyone as a mudstone, except it fizzed violently under a drop of HCl. Just to the right of this photo, we stood on the unconformity between the petroliferous and prospective Horton Group and the overlying Windsor Group. It's a pick that turns out to be one of the most reliably mappable seismic events on seismic sections so it was neat to stand on that interface.

Further down section we studied the Mississippian Cheverie Formation: stacked cycles of point-bar deposits ranging from accretionary lag conglomerates to caliche paleosols with upright tree trunks. Trees more than a metre or more in diameter were around from the mid Devonian, but Cheverie forests are still early and good examples of trees within point-bars and levees.  

Hangingwall: Red Head / Johnson Beach / Split Rock

SEE GALLERY BELOW FOR ENLARGEMENT

SEE GALLERY BELOW FOR ENLARGEMENT

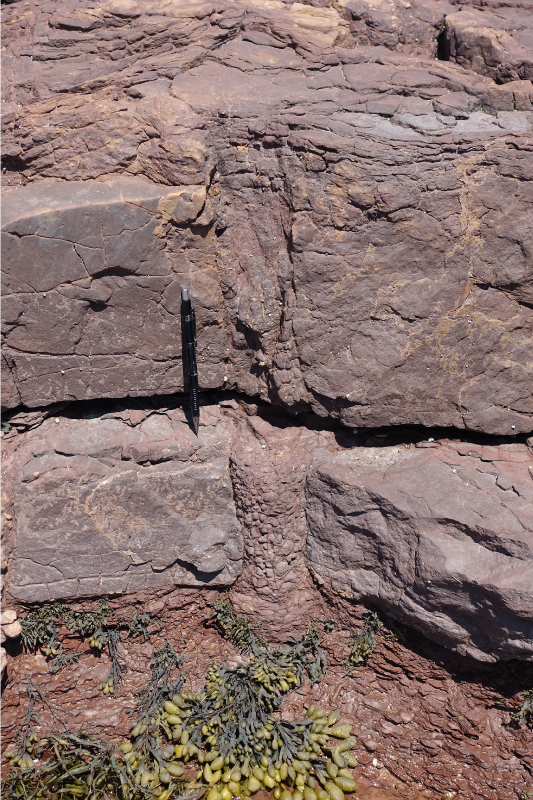
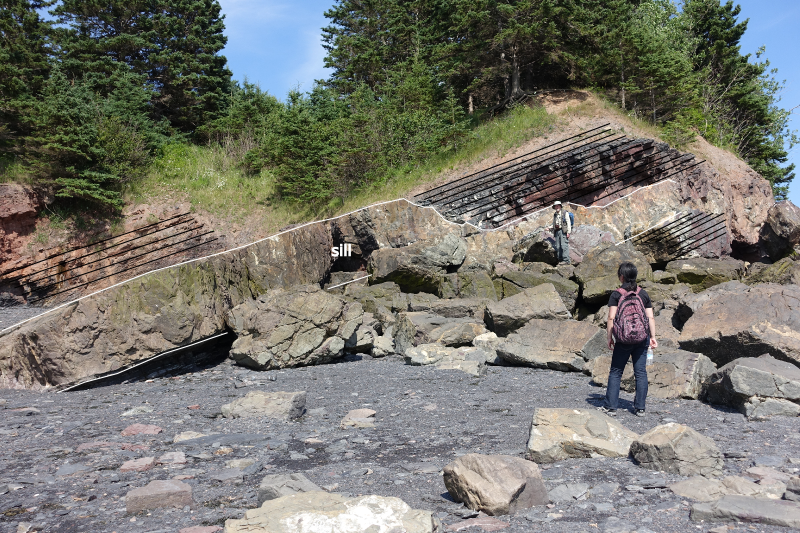
The second site featured some spectacularly folded black shales from the Horton Bluff Formation, as well as protruding sills up to two metres thick that occasionally jumped across bedding (right). We were clumsily contemplating the curious occurrence of these intrusions for quite some time until hard-rock guru Trevor McHattie halted the chatter, struck off a clean piece rock with a few blows of his hammer, wetted it with a slobbering lick, and inspected it with his hand lens. We all watched him in silence and waited for his description. I felt a little schooled. He could have said anything. It was my favourite part of the day.

Hangingwall continued: Rainy Cove

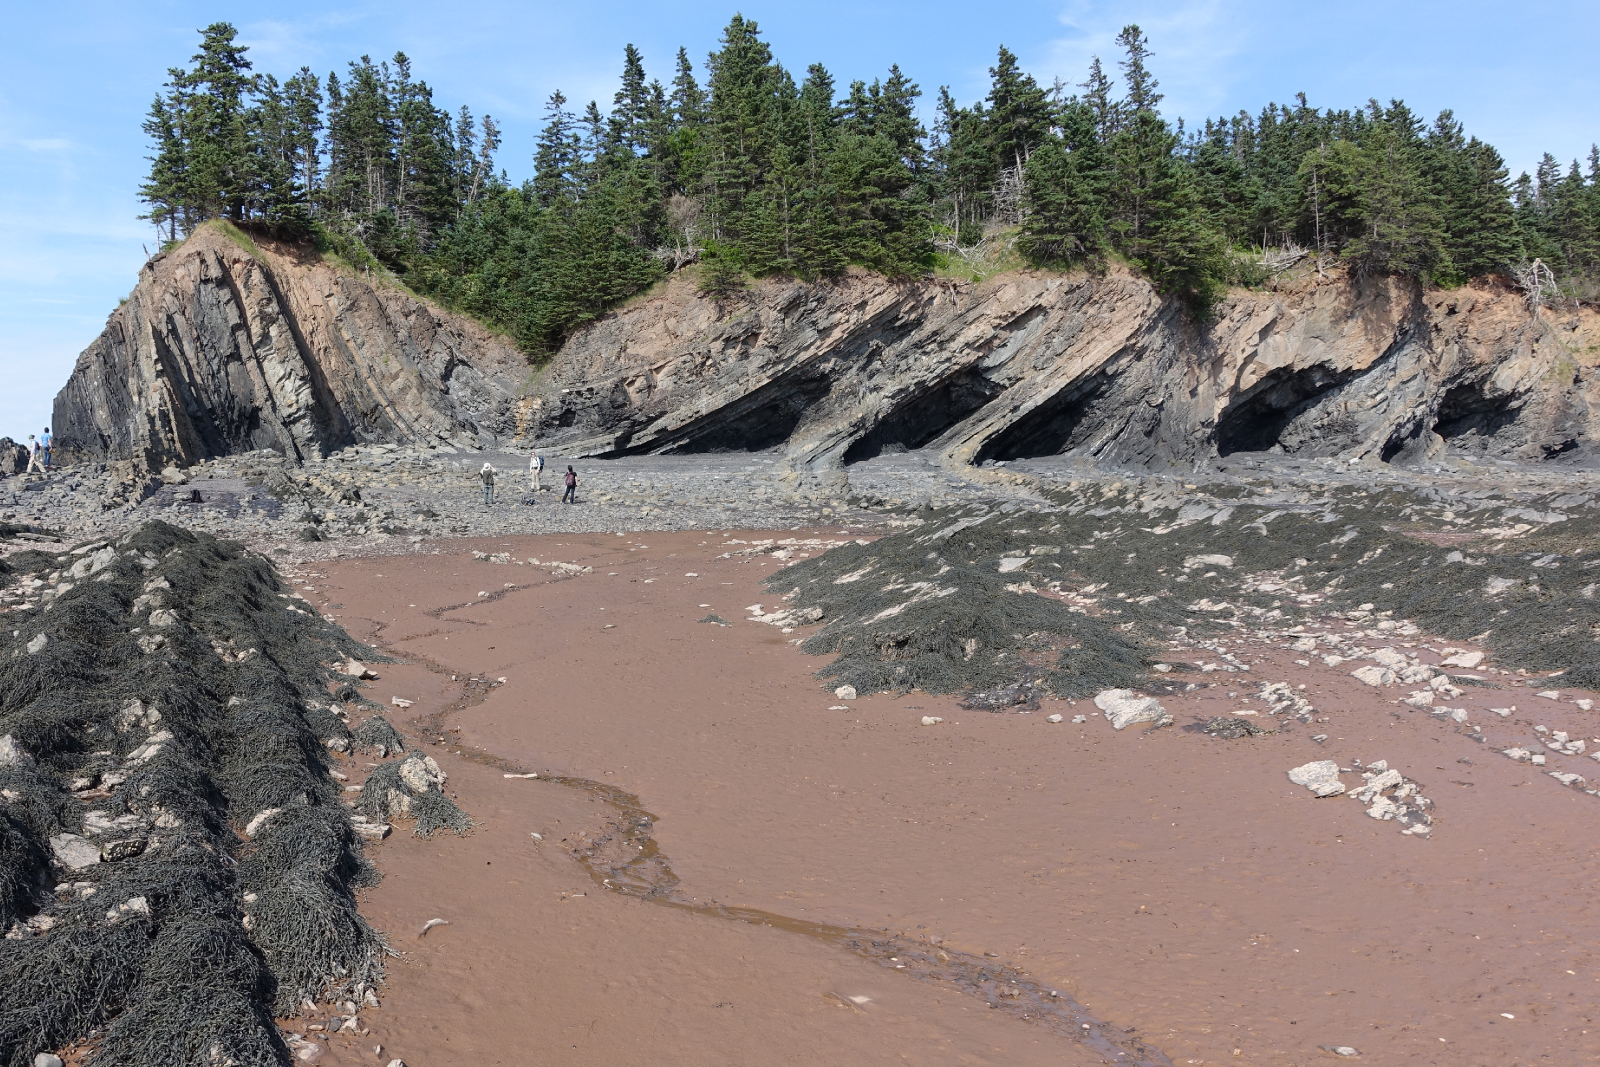
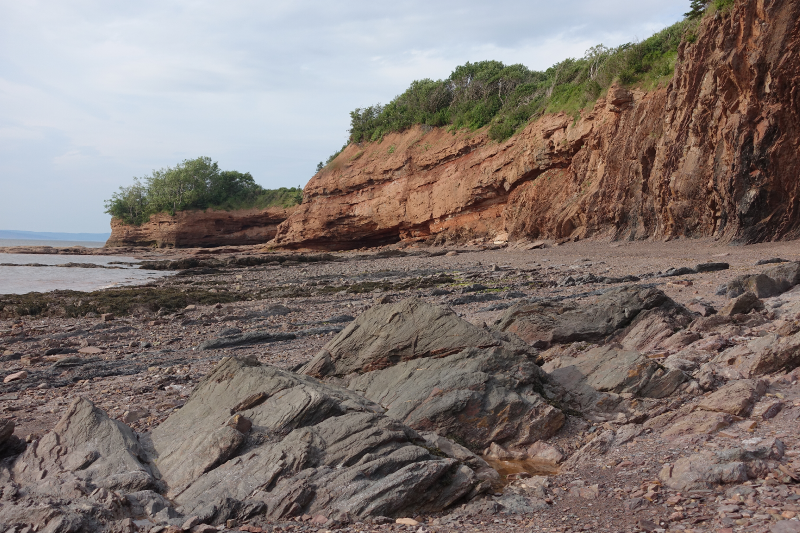
The patterns in the rocks at Rainy Cove are a wonderland for any structural geologist. It's a popular site for geology labs from Atlantic Universities, but it would be an absolute nightmare to try to actually measure the section here. 

SEE GALLERY BELOW FOR ENLARGEMENT

SEE GALLERY BELOW FOR ENLARGEMENT

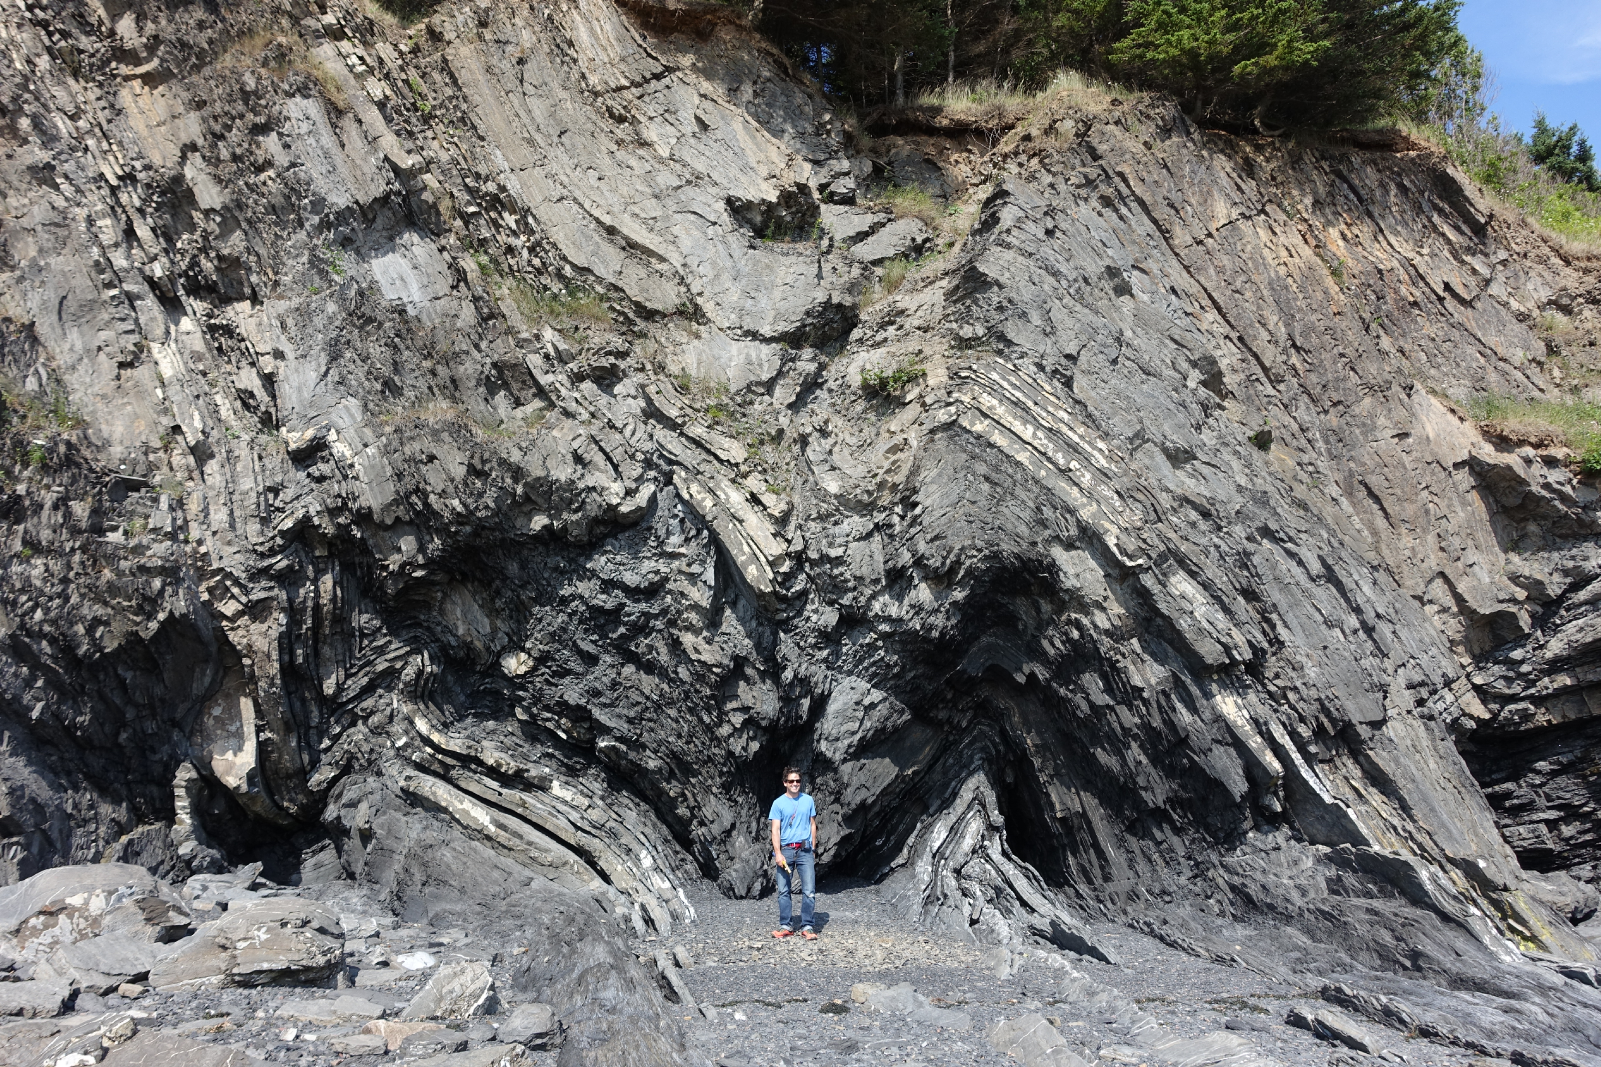
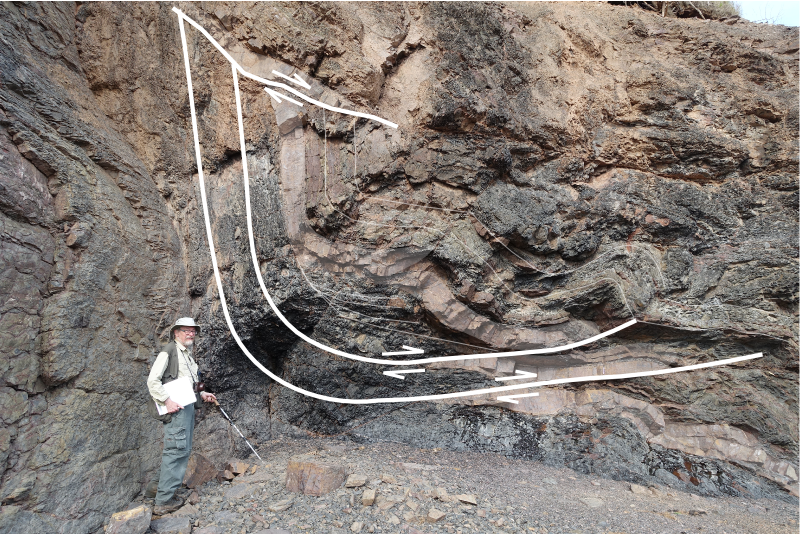
John stands next to a small system of duplicated thrusts in the main hangingwall that have been subsequently folded (left). I tried tracing out the fault planes by following the offsets in the red sandstone bed amidst black shales whose fabric has been deformed into an accordion effect. Your picks might very well be different from mine.

A short distance away we were pointed to an upside-down view of load structures in folded beds. "This antiform is a syncline", John paused while we processed. "This synform over here is an anticline". Features telling of such intense deformation are hard to fathom. Especially in plain sight.

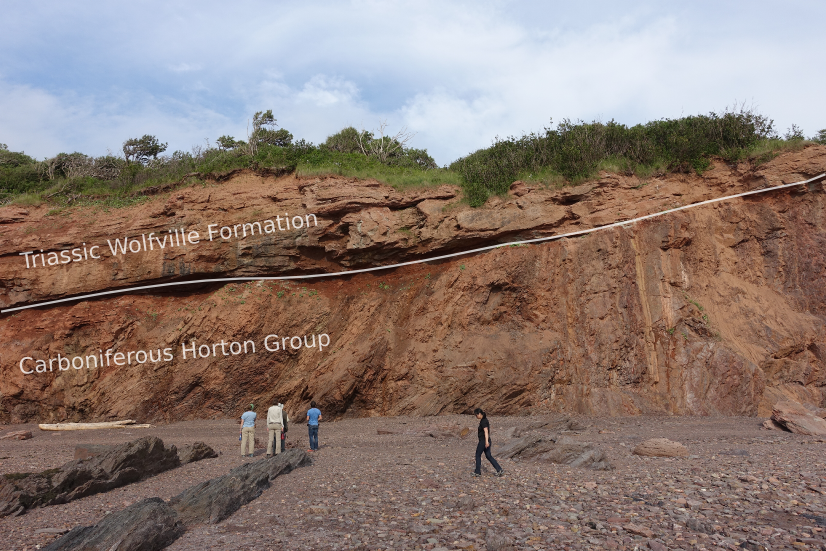
The rock lessons ended in the early evening at the far end of Rainy Cove where the Triassic Wolfville formation sits unconformably on top of ridiculously folded, sometimes doubly overturned Carboniferous Horton Rocks. John said it has to be one of the most spectacularly exposed unconformities in the world. 

I often take for granted the vast stretches of geology hiding beneath soil and vegetation, and the preciousness of finding quality outcrop. Check out the gallery below for pictures from our day.  
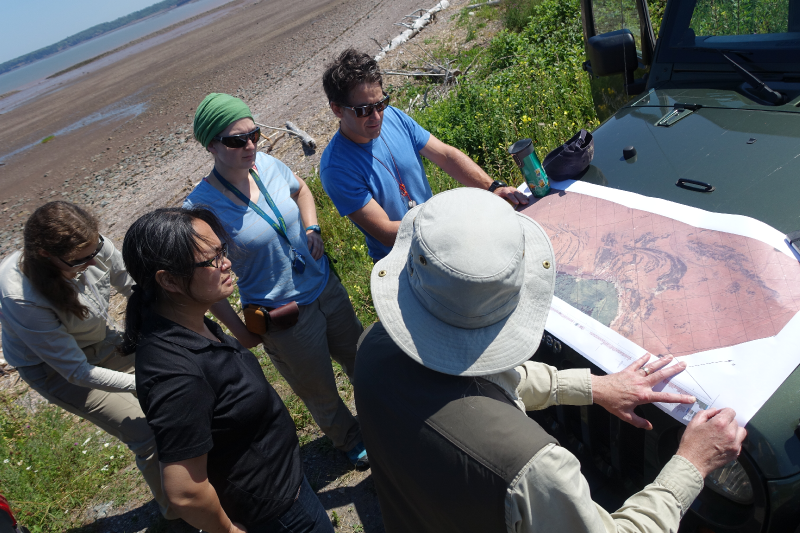
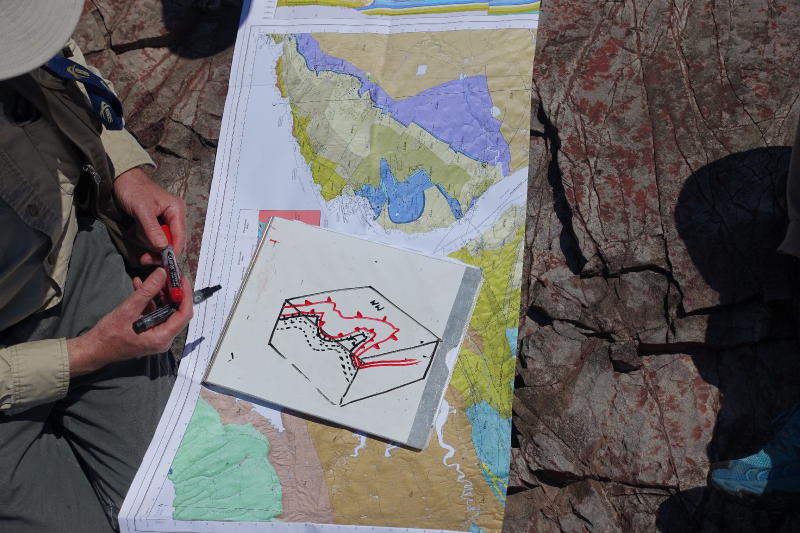
I was quite enamoured with John's format. His field trip technologies. The maps and sections: canvases for communication and works in progress. His white boarding, his map-folding techniques: a practised impresario.

What are some of the key elements from the best field trips you've been on? Let us know in the comments.

Images as data

I was at the Atlantic Geoscience Society's annual meeting on Friday and Saturday, held this year in a cold and windy Truro, Nova Scotia. The AGS is a fairly small meeting — maybe a couple of hundred geoscientists make the trip — but usually good value, especially if you're working in the area. 

A few talks and posters caught my attention, as they were all around a similar theme: getting data from images. Not in an interpretive way, though — these papers were about treating images fairly literally. More like extracting impedance from seismic than, say, making a horizon map.

Drone to stereonet

Amazing 3D images generated from a large number of 2D images of outcrop. LEft: the natural colour image. Middle: all facets generated by point cloud analysis. Right: the final set of human-filtered facets. © Joseph Cormier 2016

Amazing 3D images generated from a large number of 2D images of outcrop. LEft: the natural colour image. Middle: all facets generated by point cloud analysis. Right: the final set of human-filtered facets. © Joseph Cormier 2016

Probably the most eye-catching poster was that of Joseph Cormier (UNB), who is experimenting with computer-assisted structural interpretation. Using dozens of high-res photographs collected by a UAV, Joseph combines them to create reconstruct the 3D scene of the outcrop — just from photographs, no lidar or other ranging technology. The resulting point cloud reveals the orientations of the outcrop's faces, as well as fractures, exposed faults, and so on. A human interpreter can then apply her judgment to filter these facets to groups of tectonically significant sets, at which point they can be plotted on a stereonet. Beats crawling around with a Brunton or Suunto for days!

Hyperspectral imaging

There was another interesting poster by a local mining firm that I can't find in the abstract volume. They had some fine images from CoreScan, a hyperspectral imaging and analysis company operating in the mining industry. The technology, which can discern dozens of rock-forming minerals from their near infrared and shortwave infrared absorption characteristics, seems especially well-suited to mining, where mineralogical composition is usually more important than texture and sedimentological interpretation. 

Isabel Chavez (SMU) didn't need a commercial imaging service. To help correlate Laurasian shales on either side of the Atlantic, she presented results from using a handheld Konica-Minolta spectrophotometer on core. She found that CIE L* and a* colour parameters correlated with certain element ratios from ICP-MS analysis. Like many of the students at AGS, Isabel was presenting her undergraduate thesis — a real achievement.

Interesting aside: one of the chief applications of colour meters is measuring the colour of chips. Fascinating.

The hacker spirit is alive and well

The full spectrum (top), and the CCD responses with IR filter, Red filter, green filter, and blue filter (bottom). All of the filters admitted some infrared light, causing problems for calibration. © Robert McEwan 2016.

The full spectrum (top), and the CCD responses with IR filter, Red filter, green filter, and blue filter (bottom). All of the filters admitted some infrared light, causing problems for calibration. © Robert McEwan 2016.

After seeing those images, and wishing I had a hyperspectral imaging camera, Rob McEwan (Dalhousie) showed how to build one! In a wonderfully hackerish talk, he showed how he's building a $100 mineralogical analysis tool. He started by removing the IR filter from a second-hand Nikon D90, then — using a home-made grating spectrometer — measured the CCD's responses in the red, green, blue, and IR bands. After correcting the responses, Rob will use the USGS spectral library (Clark et al. 2007) to predict the contributions of various minerals to the image. He hopes to analyse field and lab photos at many scales. 

Once you have all this data, you also have to be able to process it. Joshua Wright (UNB) showed how he has built a suite of VisualBasic Macros to segment photomicrographs into regions representing grains using FIJI, then post-process the image data as giant arrays in an Excel spreadsheet (really!). I can see how a workflow like this might initially be more accessible to someone new to computer programming, but I felt like he may have passed Excel's sweetspot. The workflow would be much smoother in Python with scikit-image, or MATLAB with the Image Processing Toolbox. Maybe that's where he's heading. You can check out his impressive piece of work in a series of videos; here's the first:

Looking forward to 2016

All in all, the meeting was a good kick off to the geoscience year — a chance to catch up with some local geoscientists, and meet some new ones. I also had the chance to update the group on striplog, which generated a bit of interest. Now I'm back in Mahone Bay, enjoying the latest winter storm, enjoying the feeling of having something positive to blog about!

Please be aware that, unlike the images I usually include in posts, the images in this post are not open access and remain the copyright of their respective authors.


References

Isabel Chavez, David Piper, Georgia Pe-Piper, Yuanyuan Zhang, St Mary's University (2016). Black shale Selli Level recorded in Cretaceous Naskapi Member cores in the Scotian Basin. Oral presentation, AGS Colloquium, Truro NS, Canada.

Clark, R.N., Swayze, G.A., Wise, R., Livo, E., Hoefen, T., Kokaly, R., Sutley, S.J., 2007, USGS digital spectral library splib06a: U.S. Geological Survey, Digital Data Series 231

Joseph Cormier, Stefan Cruse, Tony Gilman, University of New Brunswick (2016). An optimized method of unmanned aerial vehicle surveying for rock slope analysis, 3D modeling, and structural feature extraction. Poster, AGS Colloquium, Truro NS, Canada.

Robert McEwan, Dalhousie University (2016). Detecting compositional variation in granites – a method for remotely sensed platform. Oral presentation, AGS Colloquium, Truro NS, Canada.

Joshua Wright, University of New Brunswick (2016). Using macros and advanced functions in Microsoft ExcelTM to work effectively and accurately with large data sets: An example using sulfide ore characterizatio. Oral presentation, AGS Colloquium, Truro NS, Canada.

News of the month

News from the interface between the infinite istropic half-spaces of geoscience and technology. Got tips? 

Matt was at the SEG Annual Meeting in Las Vegas at the beginning of the month. If you didn't make the trip, and even if you did, Don't miss his highlights posts.

Webapp for wells

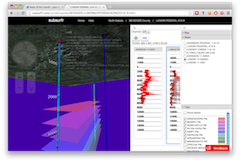
This is exciting. Subsurfr could be the start of a much-needed and long-overdue wave of rapid web innovation for petrotechnical tools. Much kudos to tiny Wellstorm Development for the bold initiative; it makes you wonder what on earth Halliburton and Schlumberger are up to. Right from your browser, you can fly around the subsurface of North Dakota, see logs, add picks, build surface segments, and provide the creators with feedback. Try it out!

OpendTect gets even awesomer 

OpendTect goes from strength to strength, having passed 100 000 downloads on about 11 November. If you haven't tried it yet, you really should. It's like all those other integrated volume interpretation tools, with the small difference that it's open source-you can read the code. Oh, and it's free. There is that.

Paul de Groot, one of the founders of dGB, told me at SEG that he's been tinkering with code again. He's implemented GLCM-based texture attributes, and it will be in the open source base package soon. Nice.

The next big thing

Landmark's PowerCalculator was good. Geocraft was awesome. Now there's Canopy - Enthought's attempt to bring Python coding to the rest of us. The idea is to provide a MATLAB-like environment for the galaxy of mathematical and scientific computing packs for Python (numpy, scipy, matplotlib, to name a few). It's in beta right now — why not ask for an invite? Even more exiciting for geophysicists — Enthought is developing a set of geoscience plugins, allowing you to load SEGY data, display seismic, and perform other nifty tricks. Can't wait.

More Nova Scotia exploration

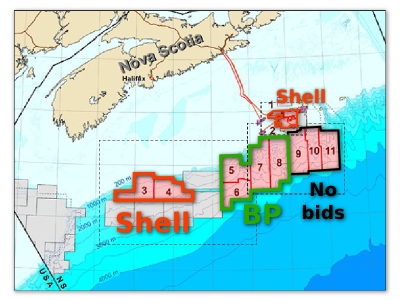
BP won licenses in the latest offshore exploration round (NS12–1), in exchange for a $1.05 billion work bid on 4 deep water parcels. This is in line with Shell's winning bid last January of $970 million, and they also added to their acreage — it seems there's an exploration renaissance happening in Nova Scotia. After the award, there were lots of questions about BP's safety record, but the licensing rules only allow for the highest bidder to win — there's no scrutiny of suitability at this stage. Awarding the license and later denying the right to drill seems a bit disingenuous, however. Water depth: up to about 3500 m!

This regular news feature is for information only. We aren't connected with any of these organizations, and don't necessarily endorse their products or services. Except OpendTect and Canopy, because they are awesome and we use them almost every day.

Opening data in Nova Scotia

When it comes to data, open doesn't mean part of the public relations campaign. Open must be put to work. And making open data work can take a lot of work, by a number of contributors across organizations.

Also, open data should be accesible by more than the privileged few in the right location at the right time, or with the right connections. The better way to connect is by digital data stewardship.

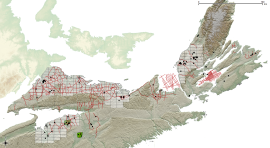
I will be speaking about the state of the onshore Nova Scotia petroleum database Nova Scotia Energy R&D Forum in Halifax on 16 & 17 May, and the direction this might head for the collective benefit of regulators, researchers, explorationists, and the general public. Here's the abstract for the talk:

Read More