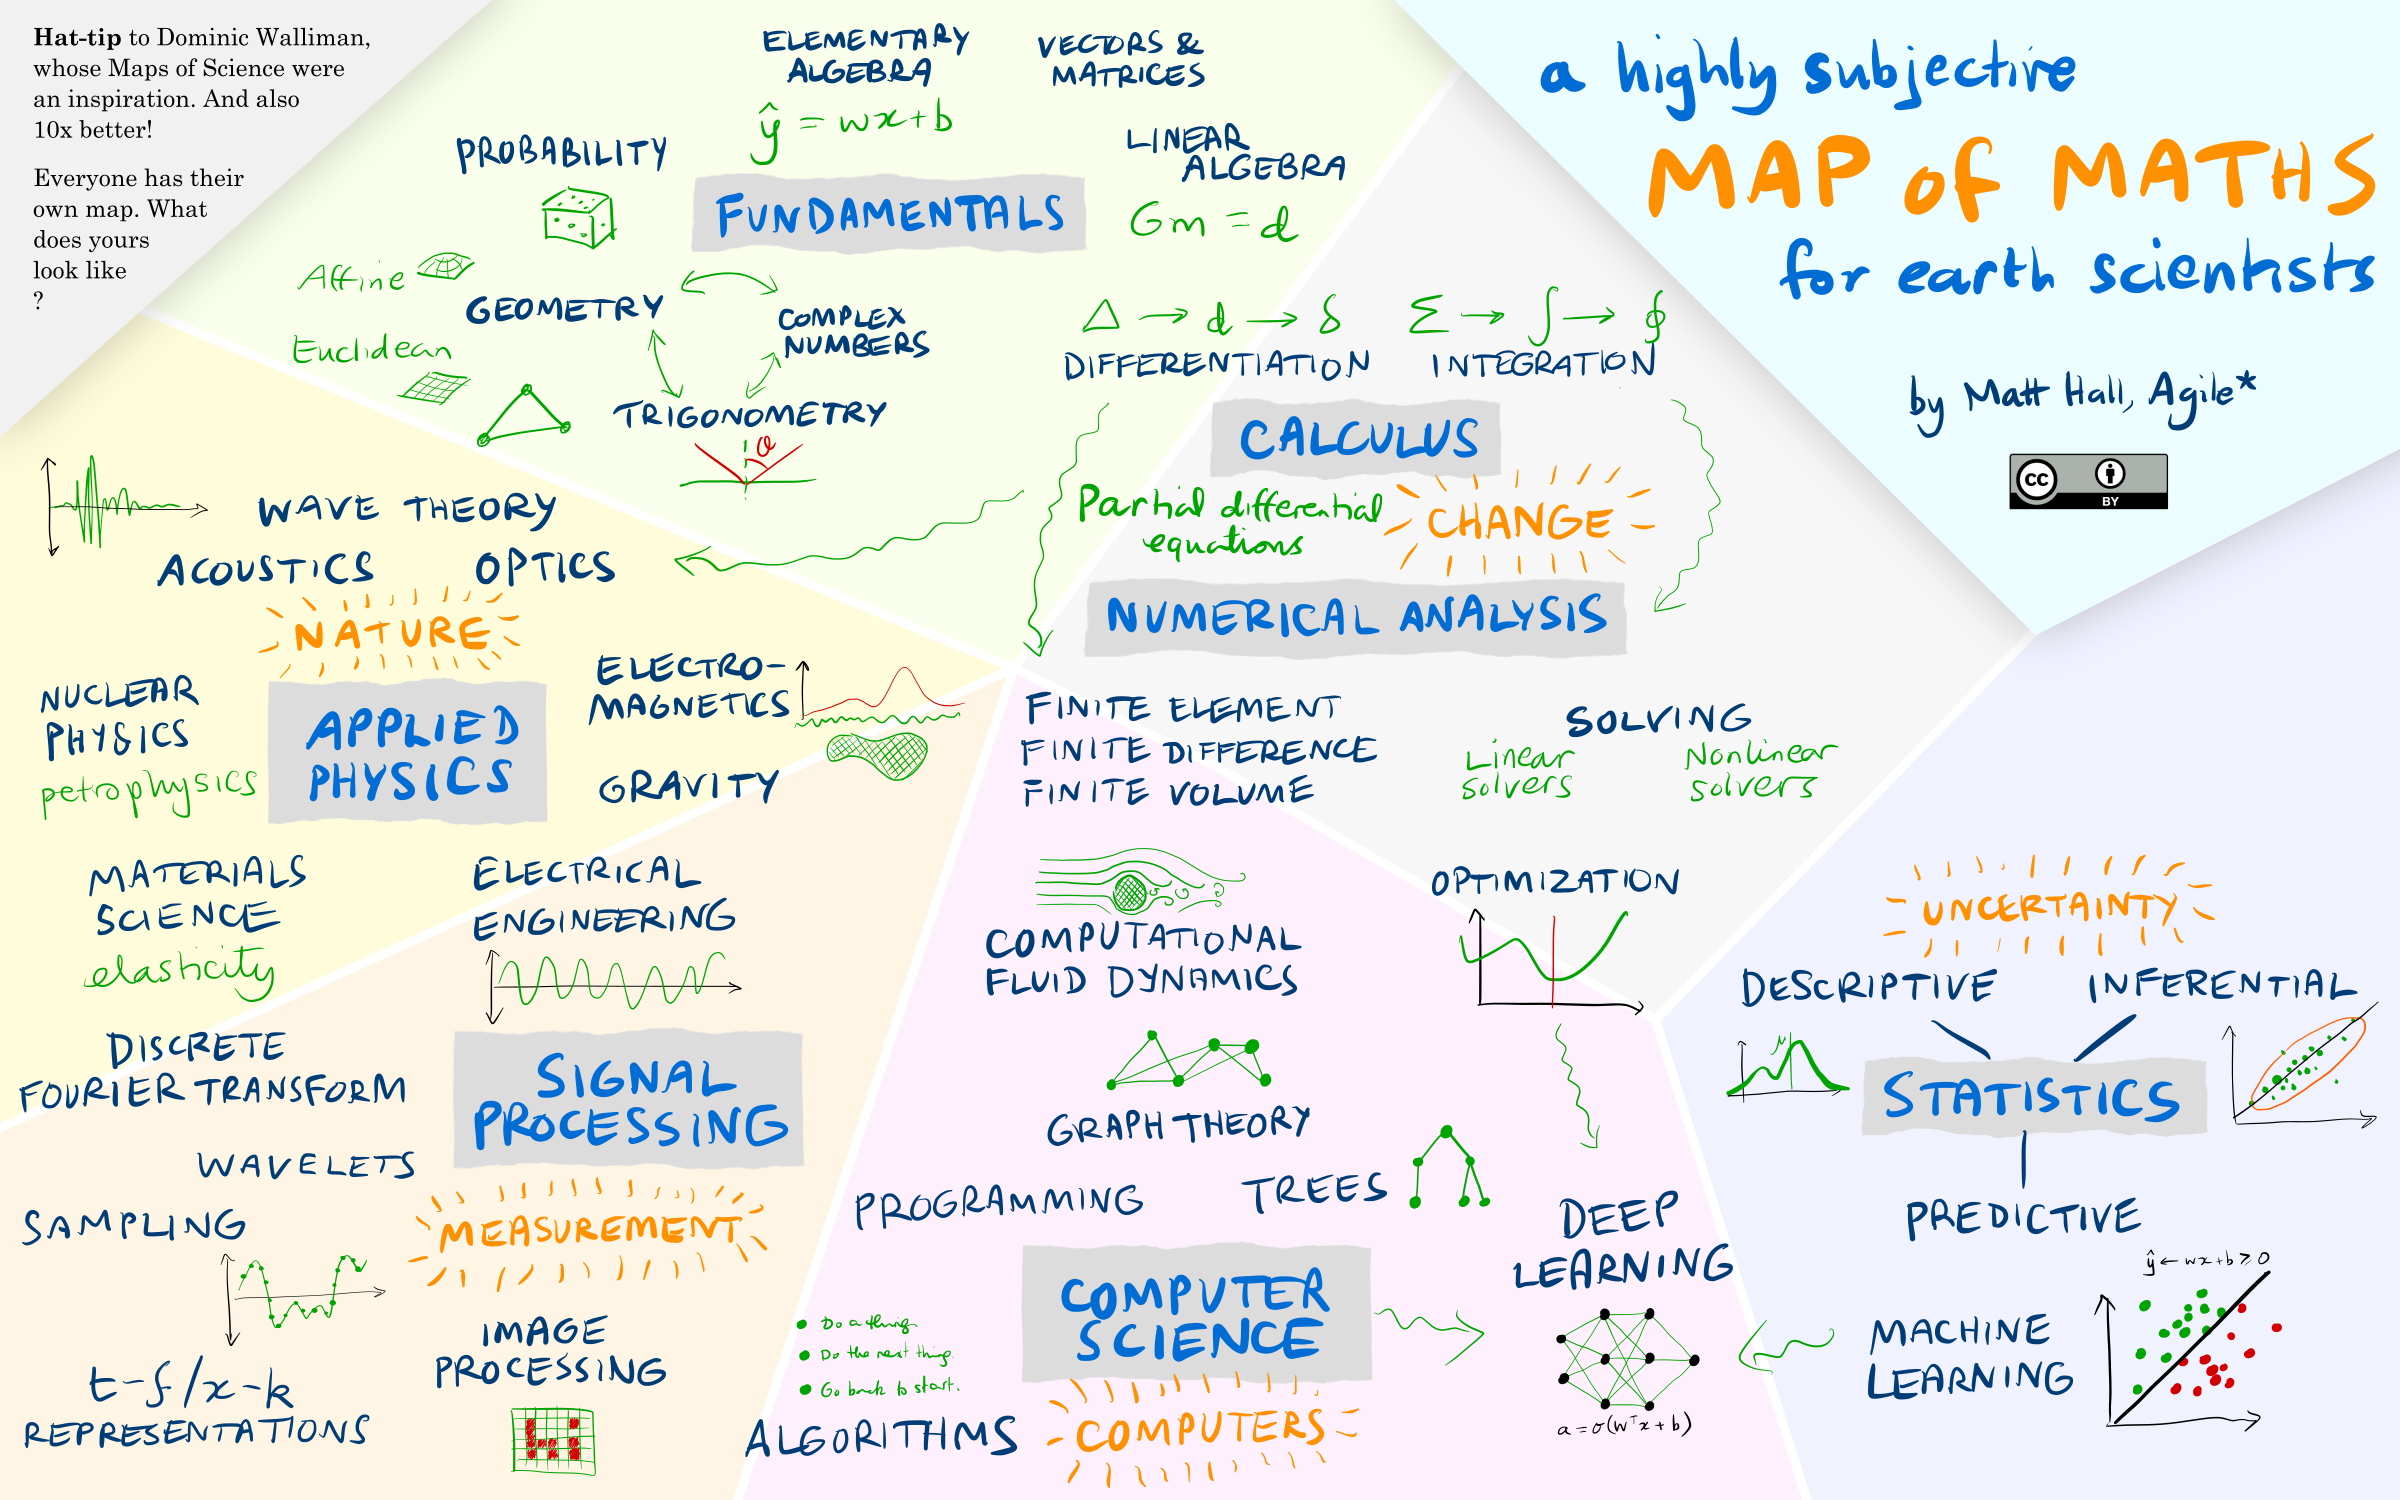
A (useless) map of geo-mathematics
/Most scientific problems involve at least a bit of maths, even if it’s just adding things up or finding averages.
But some problems require quite a bit of maths, like solving an equation, or throwing vectors around, or even a Fourier transform or two. A lot of people switch off at this point.
Yet other problems require a lot of maths. Maybe we need a finite difference model, a volume integral, or a deep neural network. Most of us back away from the problem at this point and look for a collaborator with a lot of equations on their whiteboard.
But it’s pretty hard to find new collaborators right now. And what if you run into these problems a lot? Maybe you need to be the one with the equationy whiteboard!
What then? Where do you start? We need a map!
A roadmap for learning…
…is what I set out to draw. I failed. Possibly there exists a map, with START HERE in one corner and a whiteboard full of equations in the other. But I doubt it.
I ended up drawing this:
It was fun to draw, but I highly doubt that it’s any practical use. The conclusion I came to is: there is no path. In fact, this artificially flattened projection of the n-dimensional mathiverse — no doubt reflecting my own weak grasp on half of these topics — is probably a unique, personal perspective. It reflects my interests and my nonlinear journey from A-level calculus (which I loved) to undergraduate maths (which I found very hard) to… whatever half-truths I know today.
But I want to learn, where do I start?
So if there is no path, what can you do to improve? Where should you start? How can you learn? Easy: follow your nose. Start with a project — something that interests you, something you’ll stick with. Maybe it’s a spreadsheet you have, or a plot you want to make. When you get to the maths, as you inevitably will, dig in. Read around. Google things. Get a whiteboard.
As an example, when I worked on the tricky (and unsolved!) task of recovering data from pseudocolour images, my maths journey looked something like this:
Images ➡ clustering ➡ RGB vectors ➡ distance metrics ➡ k-d trees ➡ graphs ➡ Hamiltonian paths ➡ TSP solvers
Admittedly, there’s some computer science in there too, but hey, this is applied maths.
As I described recently in Illuminated equations, there are several ways to serve, and consume, mathematical ideas: words, pictures, plots, symbols, annotations, and code (and probably some others). Seek out sources that give you three or more of these things. For me, being able to run some code makes a huge difference. Indeed, learning Python has directly led to me reading entire books on graph theory, linear algebra, deep learning, Fourier transforms, and all sorts of other things.
Well, learning Python and watching Numberphile.
I think it’s a myth that you have to be good at maths to learn to code. Instead, I think learning to code can — if you want — help make you good, or at least better, at maths. By giving you a way to try things without fully knowing what you are doing (after all, np.fft.fft(x) is pretty easy to type!), code gives you a way to peek at the answer. If you do it often enough, and follow up with some reading, understanding follows eventually.


 Except where noted, this content is licensed