
Visualization in Copenhagen, part 2
/In Part 1, I wrote about six of the projects teams contributed at the Subsurface Hackathon in Copenhagen in June. Today I want to tell you about the rest of them.
A data exploration tool
Team GeoClusterFu...n: Dan Stanton (University of Leeds), Filippo Broggini (ETH Zürich), Francois Bonneau (Nancy), Danny Javier Tapiero Luna (Equinor), Sabyasachi Dash (Cairn India), Nnanna Ijioma (geophysicist).
Tech: Plotly Dash. GitHub repo.
Project: The team set out to build an interactive web app — a totally new thing for all of them — to make interactive plots from data in a CSV. They ended up with the basis of a useful tool for exploring geoscience data. Project page.
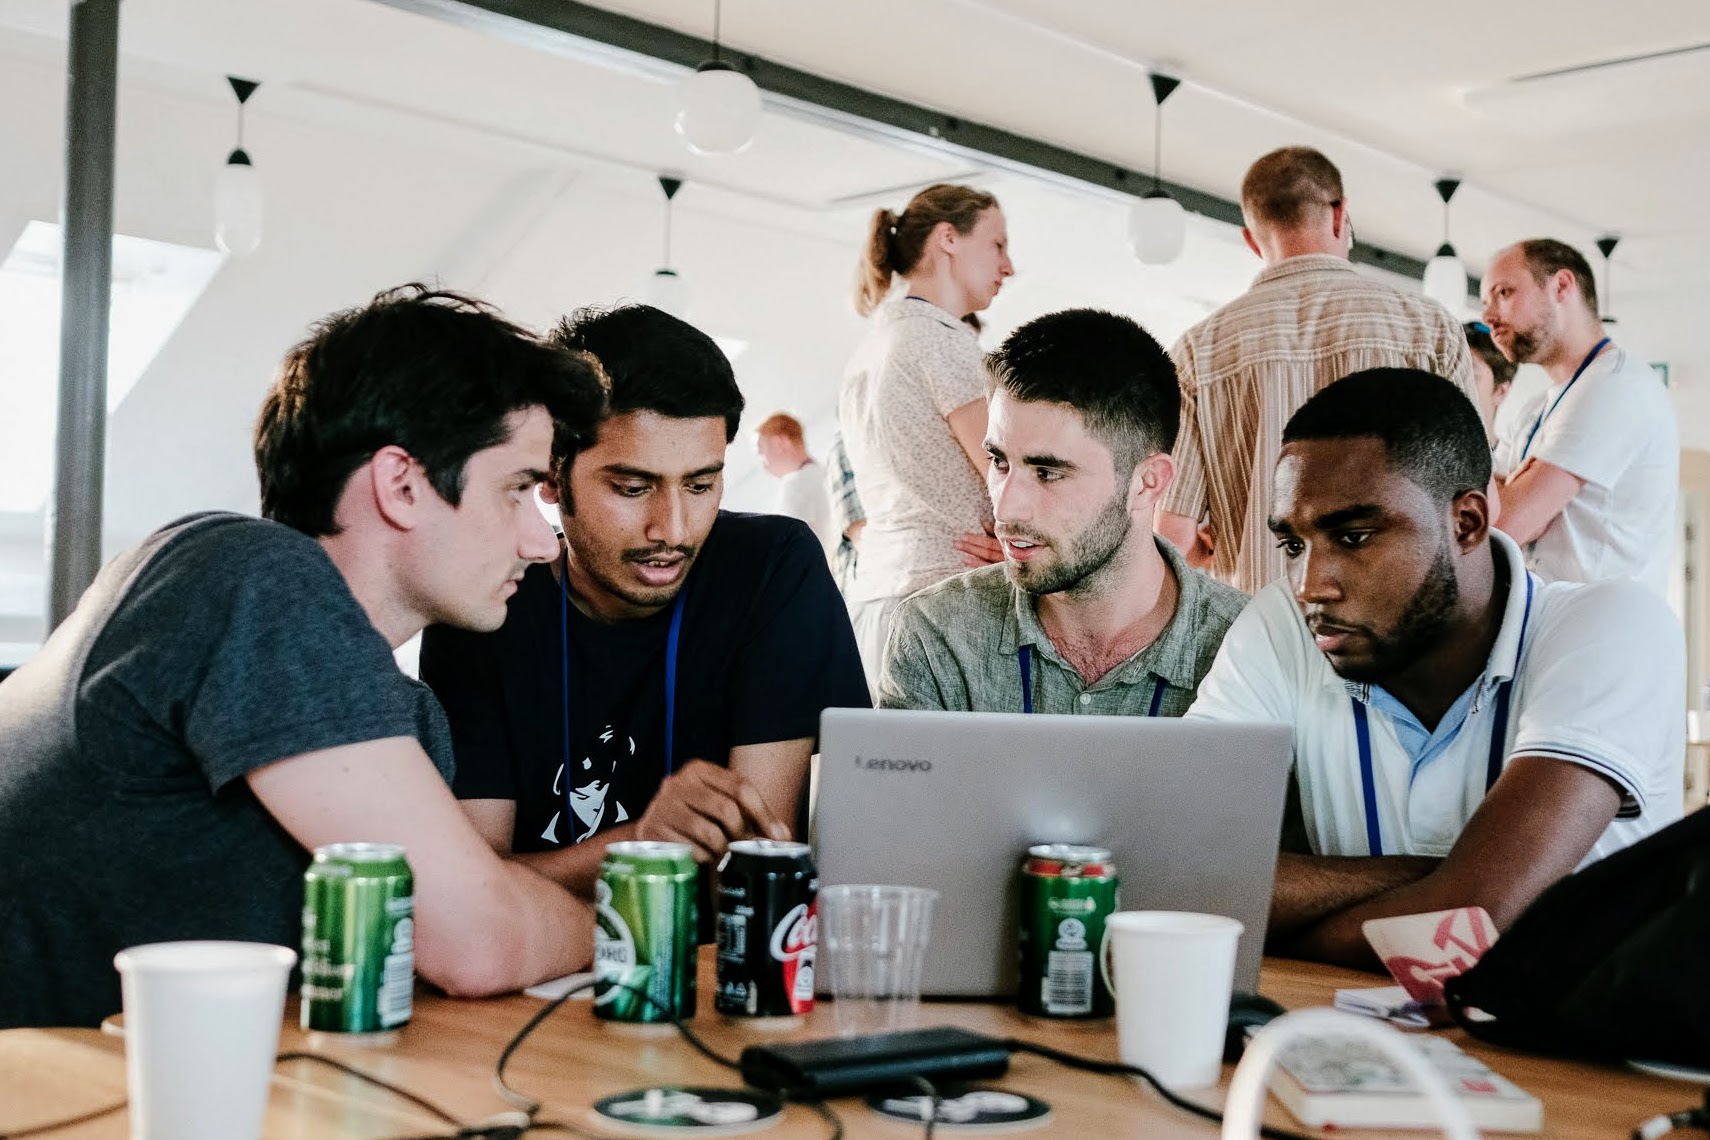
Four sixths of the GeoClusterFu...n team cluster around a laptop.
AR outcrop on your phone
Team SmARt_OGs: Brian Burnham (University of Aberdeen), Tala Maria Aabø (Natural History Museum of Denmark), Björn Wieczoreck, Georg Semmler and Johannes Camin (GiGa Infosystems).
Tech: ARKit/ARCore, WebAR, Firebase. GitLab repo.
Project: Bjørn and his colleagues from GiGa Infosystems have been at all the European hackathons. This time, he knew he wanted to get virtual outcrops on mobiles phones. He found a willing team, and they got it done! Project page.

Three views from the SmartOGs's video. See the full version.
Rock clusters in latent space
The Embedders: Lukas Mosser (Imperial College London), Jesper Dramsch (Technical University of Denmark), Ben Fischer (PricewaterhouseCoopers), Harry McHugh (DUG), Shubhodip Konar (Cairn India), Song Hou (CGG), Peter Bormann (ConocoPhillips).
Tech: Bokeh, scikit-learn, Multicore-TSNE. GitHub repo.
Project: There has been a lot of recent interest in the t-SNE algorithm as a way to reduce the dimensionality of complex data. The team explored its application to subsurface data, and found promising applications. Web page. Project page.

The Embeders built a web app to cluster the data in an LAS file. The clusters (top left) are generated by the t-SNE algorithm.
Fully mixed reality
Team Hands On GeoLabs: Will Sanger (Western Geco), Chance Sanger (Houston Museum of Fine Arts), Pierre Goutorbe (Total), Fernando Villanueva (Institut de Physique du Globe de Paris).
Project: Starting with the ambitious goal of combining the mixed reality of the Meta AR gear with the mixed reality of the Gempy sandbox, the team managed to display and interact with some seismic data in the AR headset, which allows interaction with simple hand gestures. Project page.

The team demonstrate the Meta AR headset.
Huge grids over the web
Team Grid Vizards: Fabian Kampe, Daniel Buse, Jonas Kopcsek, Paul Gabriel (all from GiGa Infosystems)
Tech: three.js. GitHub repo.
Project: Paul and his team wanted to visualize hundreds of millions or billions of grid cells — all in the browser. They ended up with about 20 million points working very smoothly, and impressed everyone. Project page.

Interpreting RGB displays for spec decomp
Team: Florian Smit (Technical University of Denmark), Gijs Straathof (SGS), Thomas Gazzola (Total), Julien Capgras (Total), Steve Purves (Euclidity), Tom Sandison (Shell)
Tech: Python, react.js. GitHub repos: Client. Backend.
Project: Spectral decomposition is still a mostly quantitative tool, especially the interpretation of RGB-blended displays. This team set out to make intuitive, attractive forward models of the spectral response of wells. This should help interpret seismic data, and perhaps make more useful RGB displays too. Intriguing and promising work. Project page.

That's it for another year! Twelve new geoscience visualization projects — ten of them open source. And another fun, creative weekend for 63 geoscientists — all of whom left with new connections and new skills. All this compressed into one weekend. If you haven't experienced a hackathon yet, I urge you to seek one out.
I will leave you with two videos — and an apology. We are so focused on creating a memorable experience for everyone in the room, that we tend to neglect the importance of capturing what's happening. Early hackathons only had the resulting blog post as the document of record, but lately we've been trying to livestream the demos at the end. Our success has been, er, mixed... but they were especially wonky this time because we didn't have livestream maestro Gram Ganssle there. So, these videos exist, and are part of the documentation of the event, but they barely begin to convey the awesomeness of the individuals, the teams, or their projects. Enjoy them, but next time — you should be there!


 Except where noted, this content is licensed