The Scottish hackathon

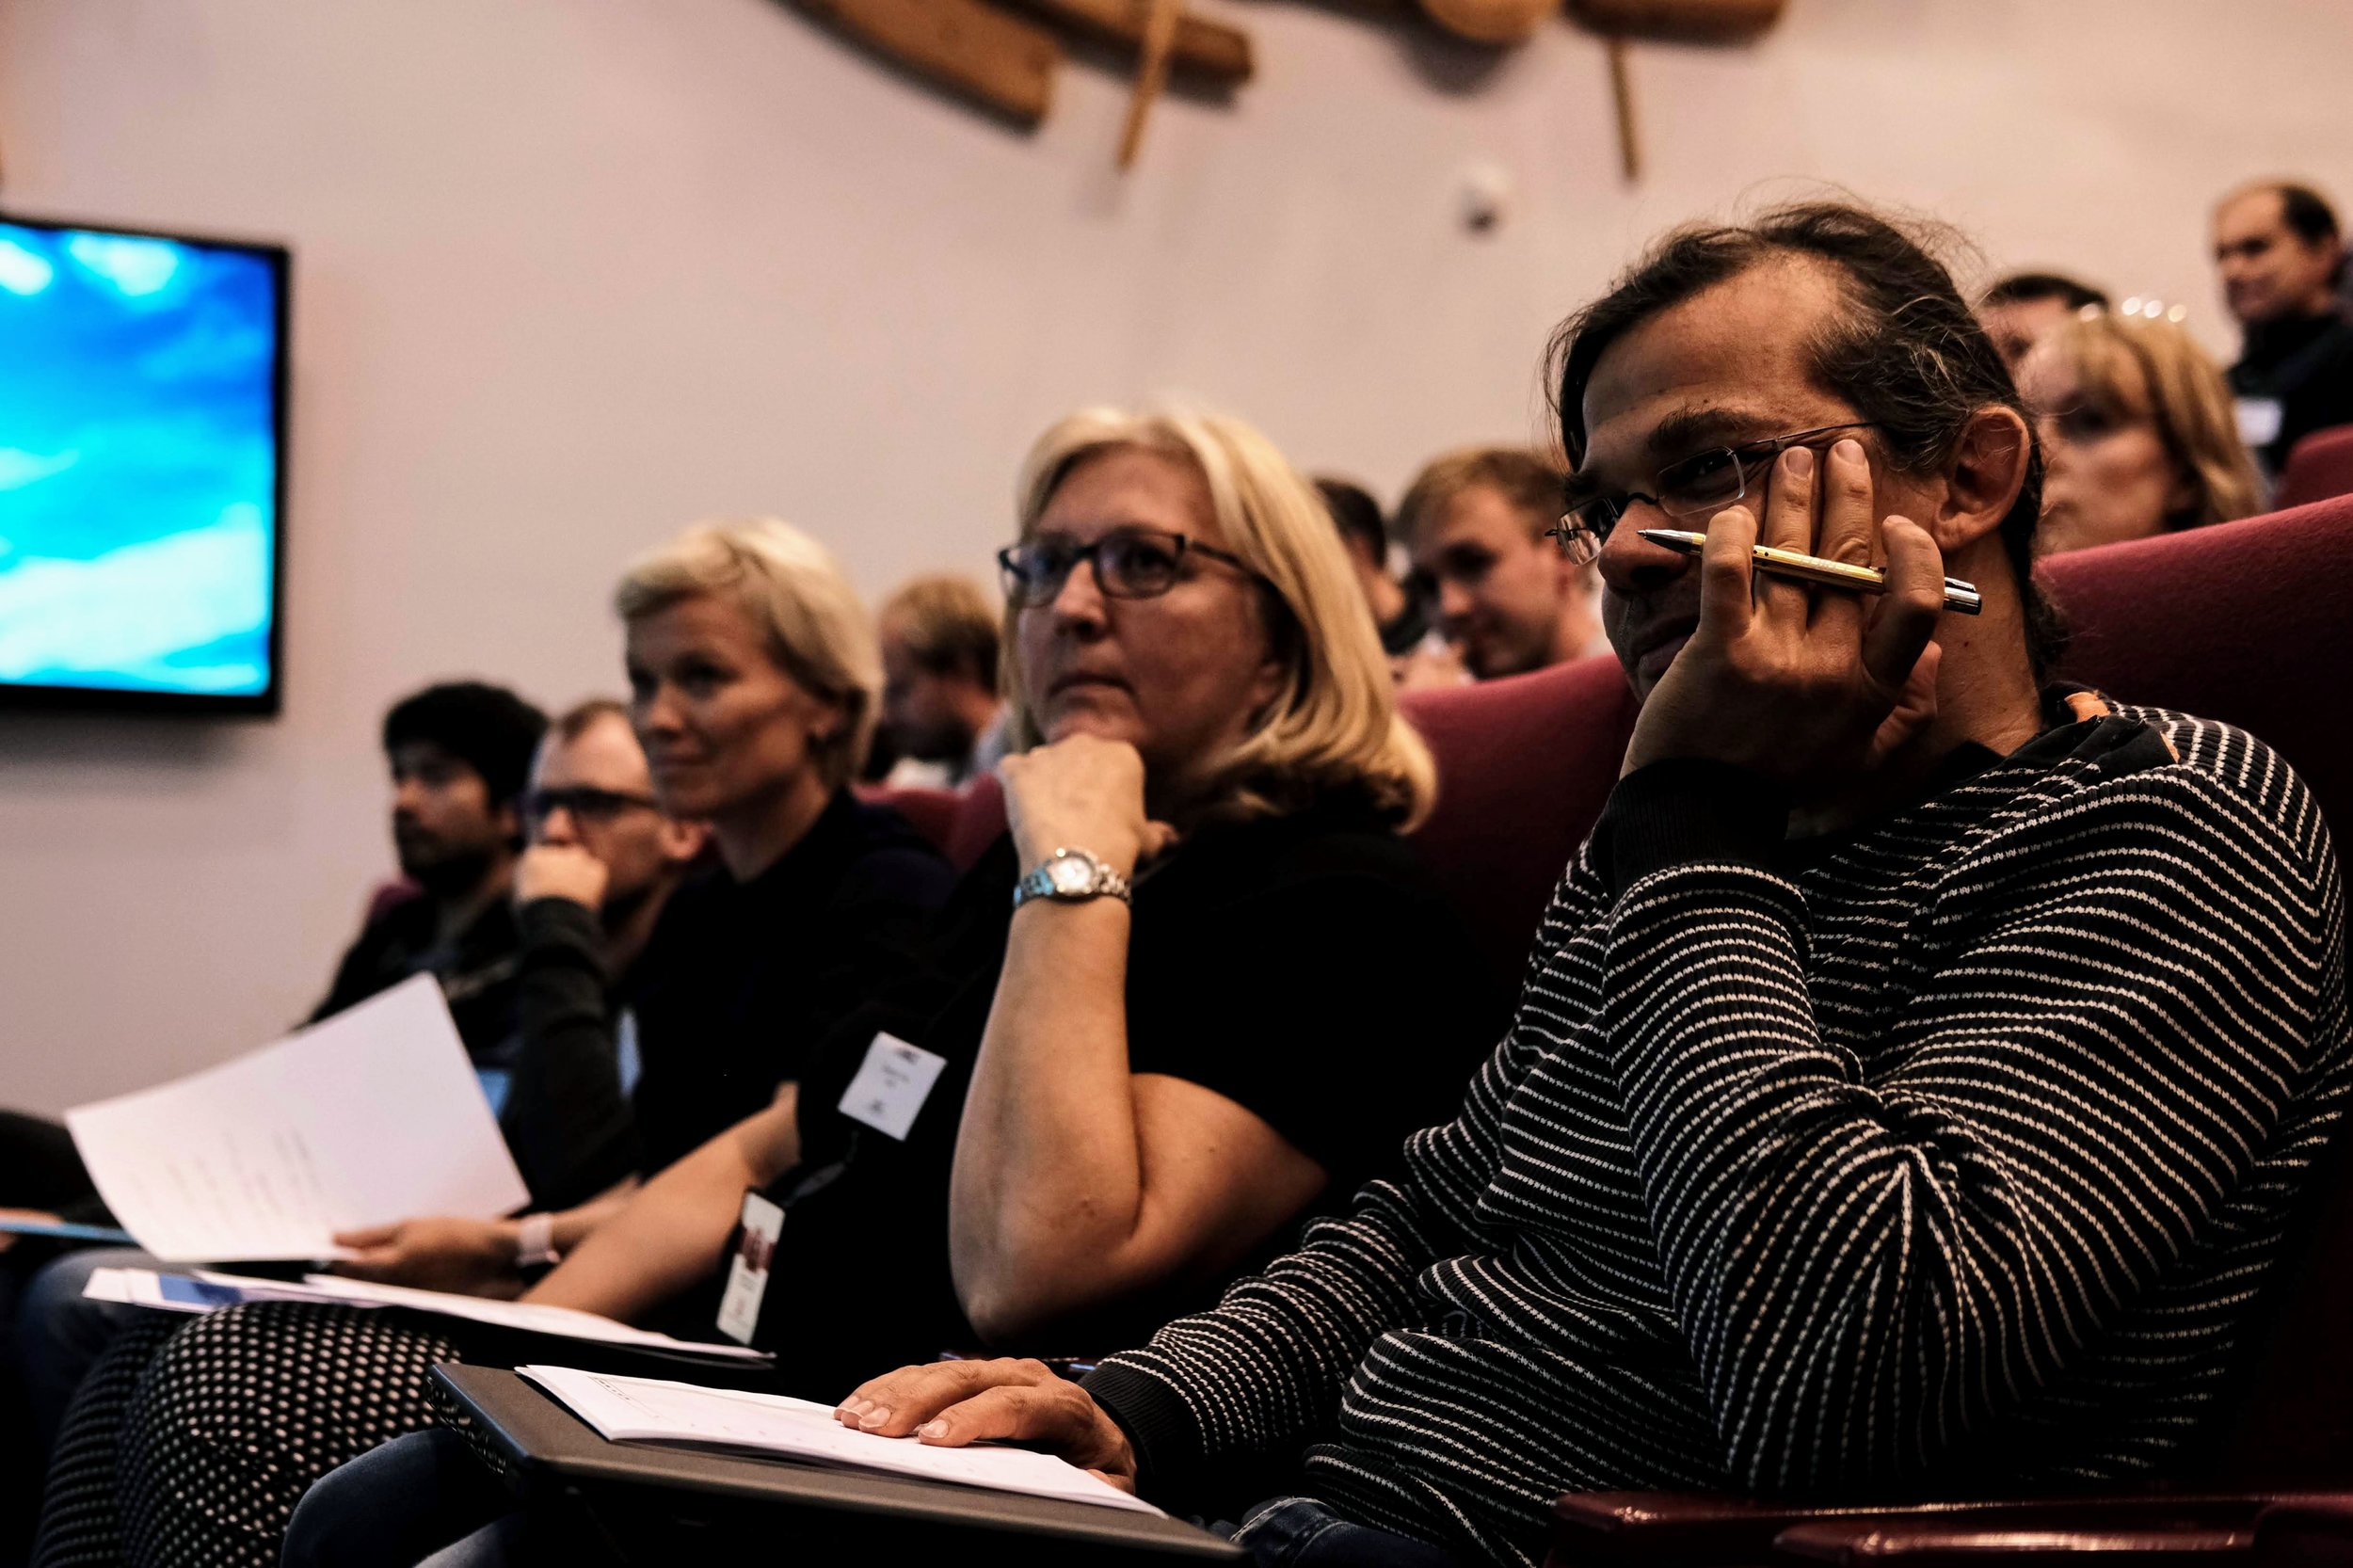
On 16−18 November the UK Oil & Gas Authority (OGA) hosted its first hackathon, with Agile providing the format and technical support. This followed a week of training the OGA provided — again, through Agile — back in September. The theme for the hackathon was ‘machine learning’, and I’m pretty sure it was the first ever geoscience hackathon in the UK.

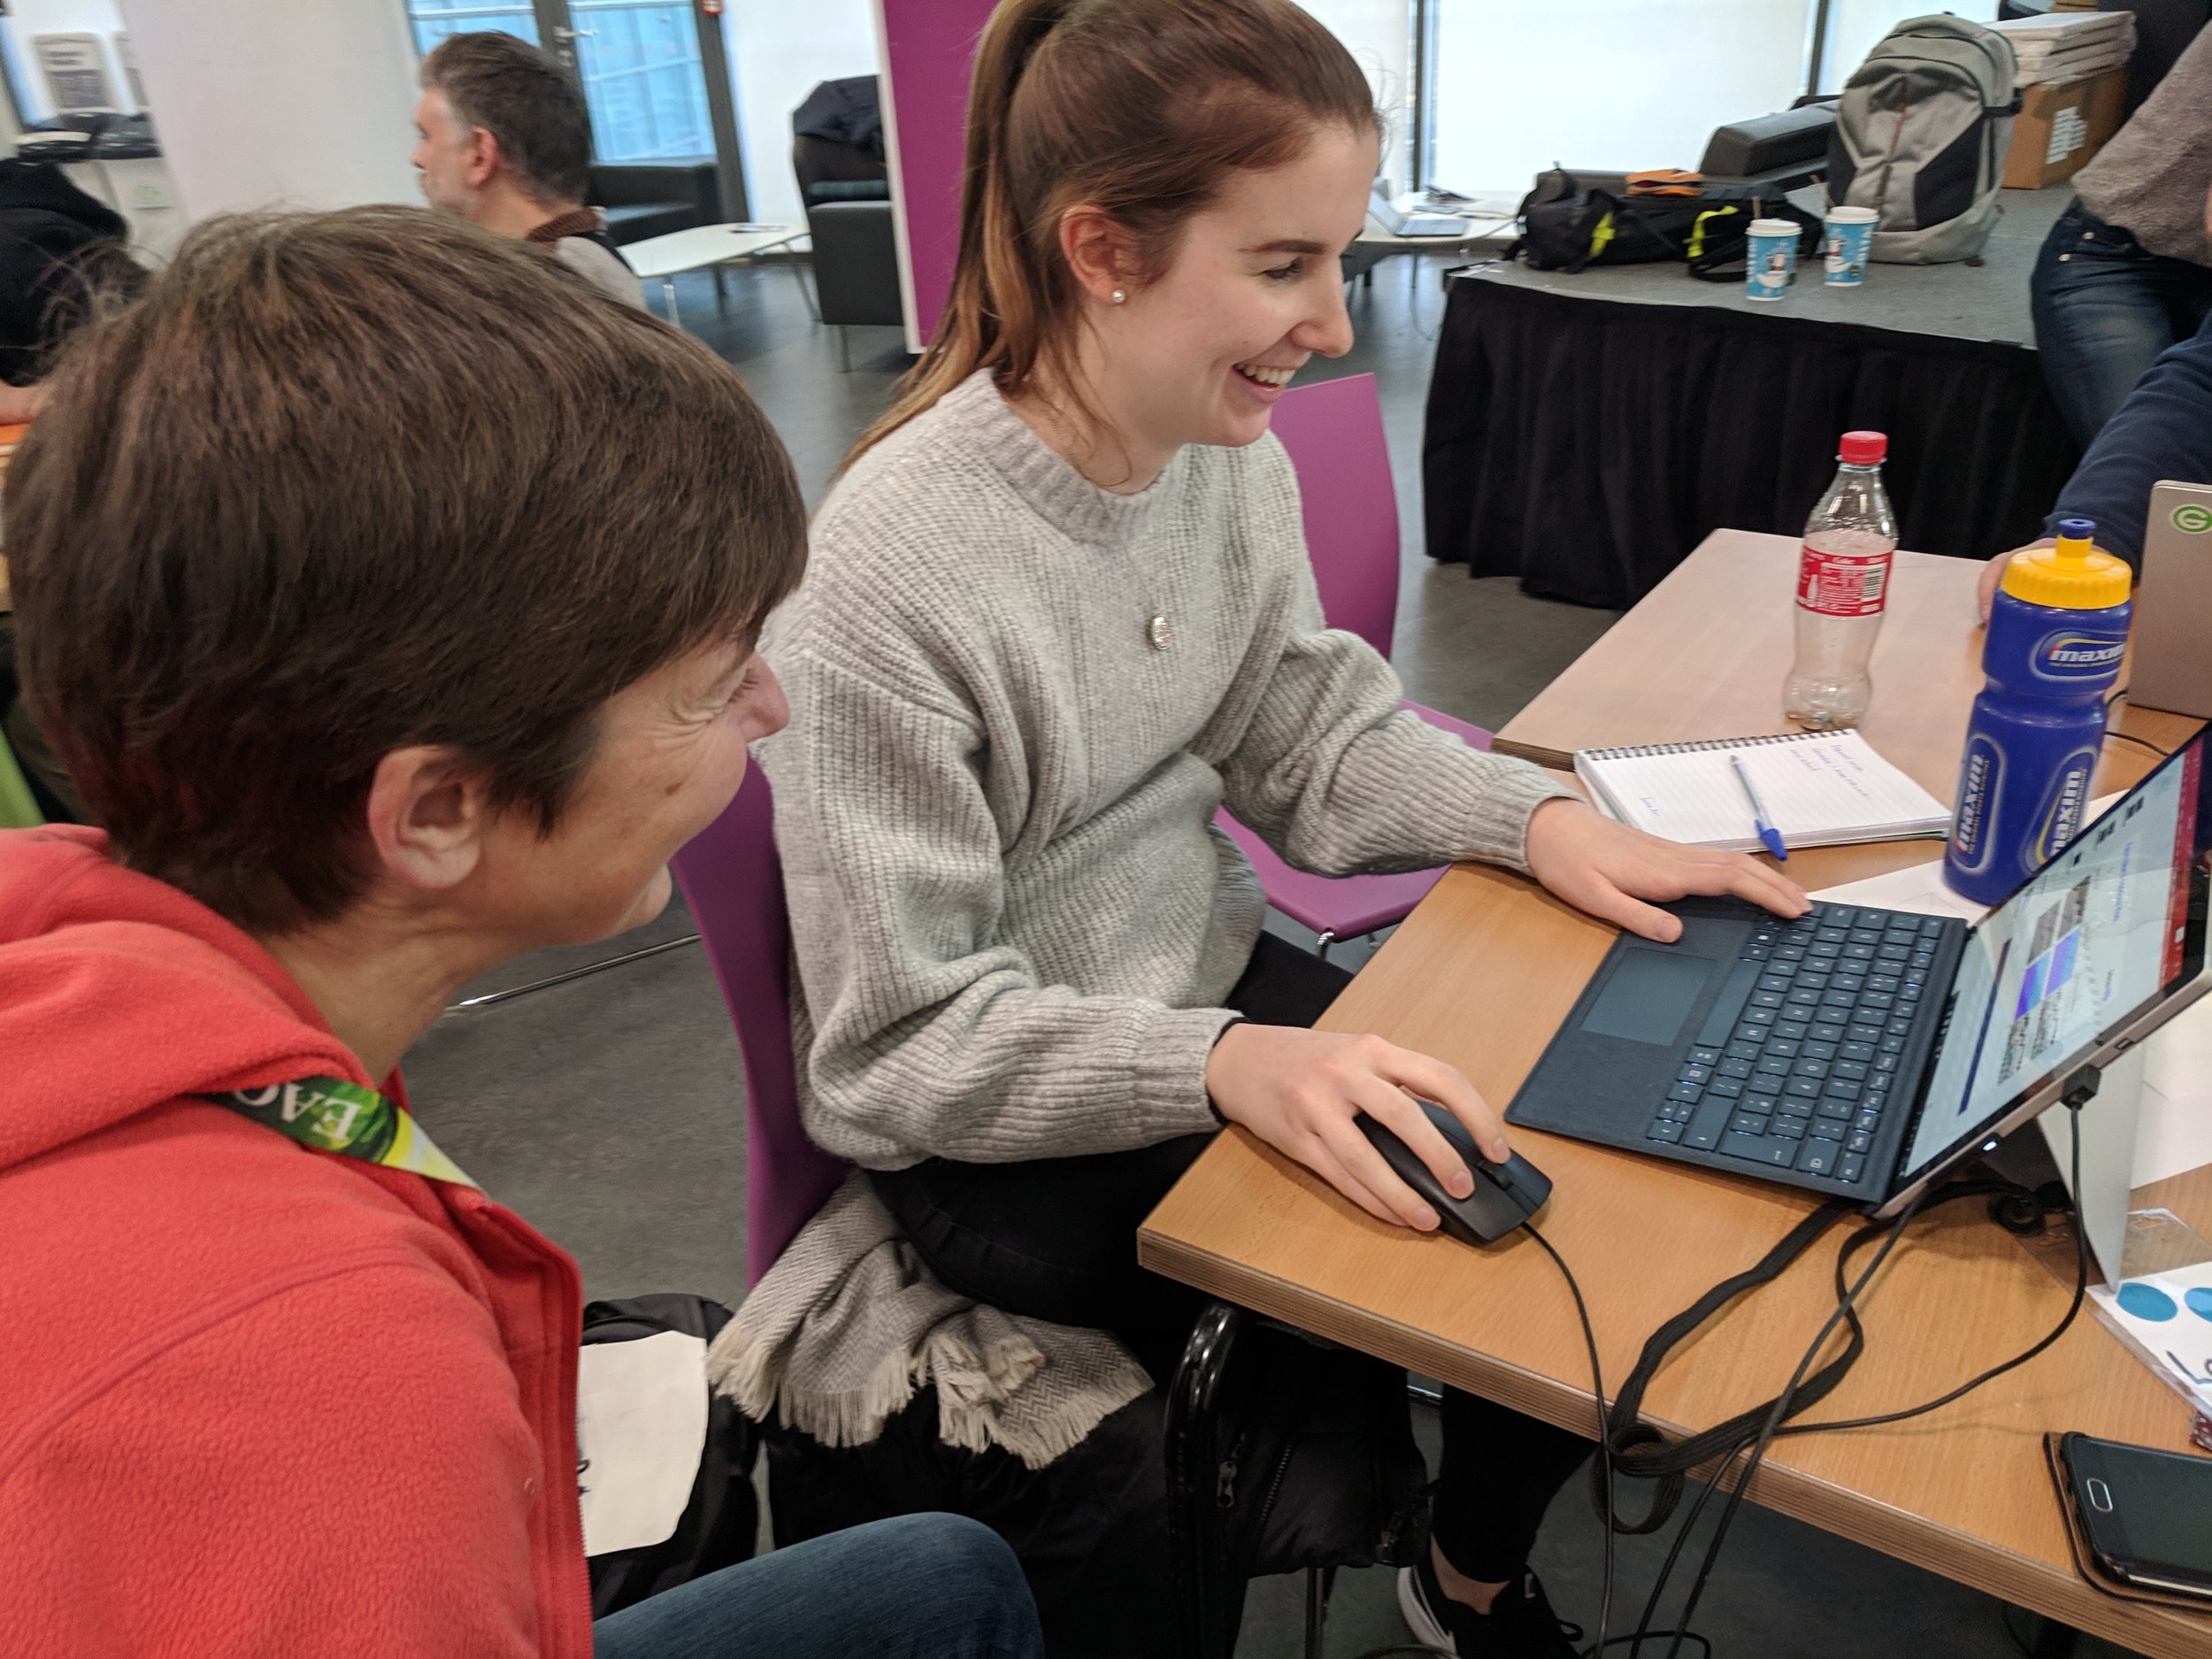
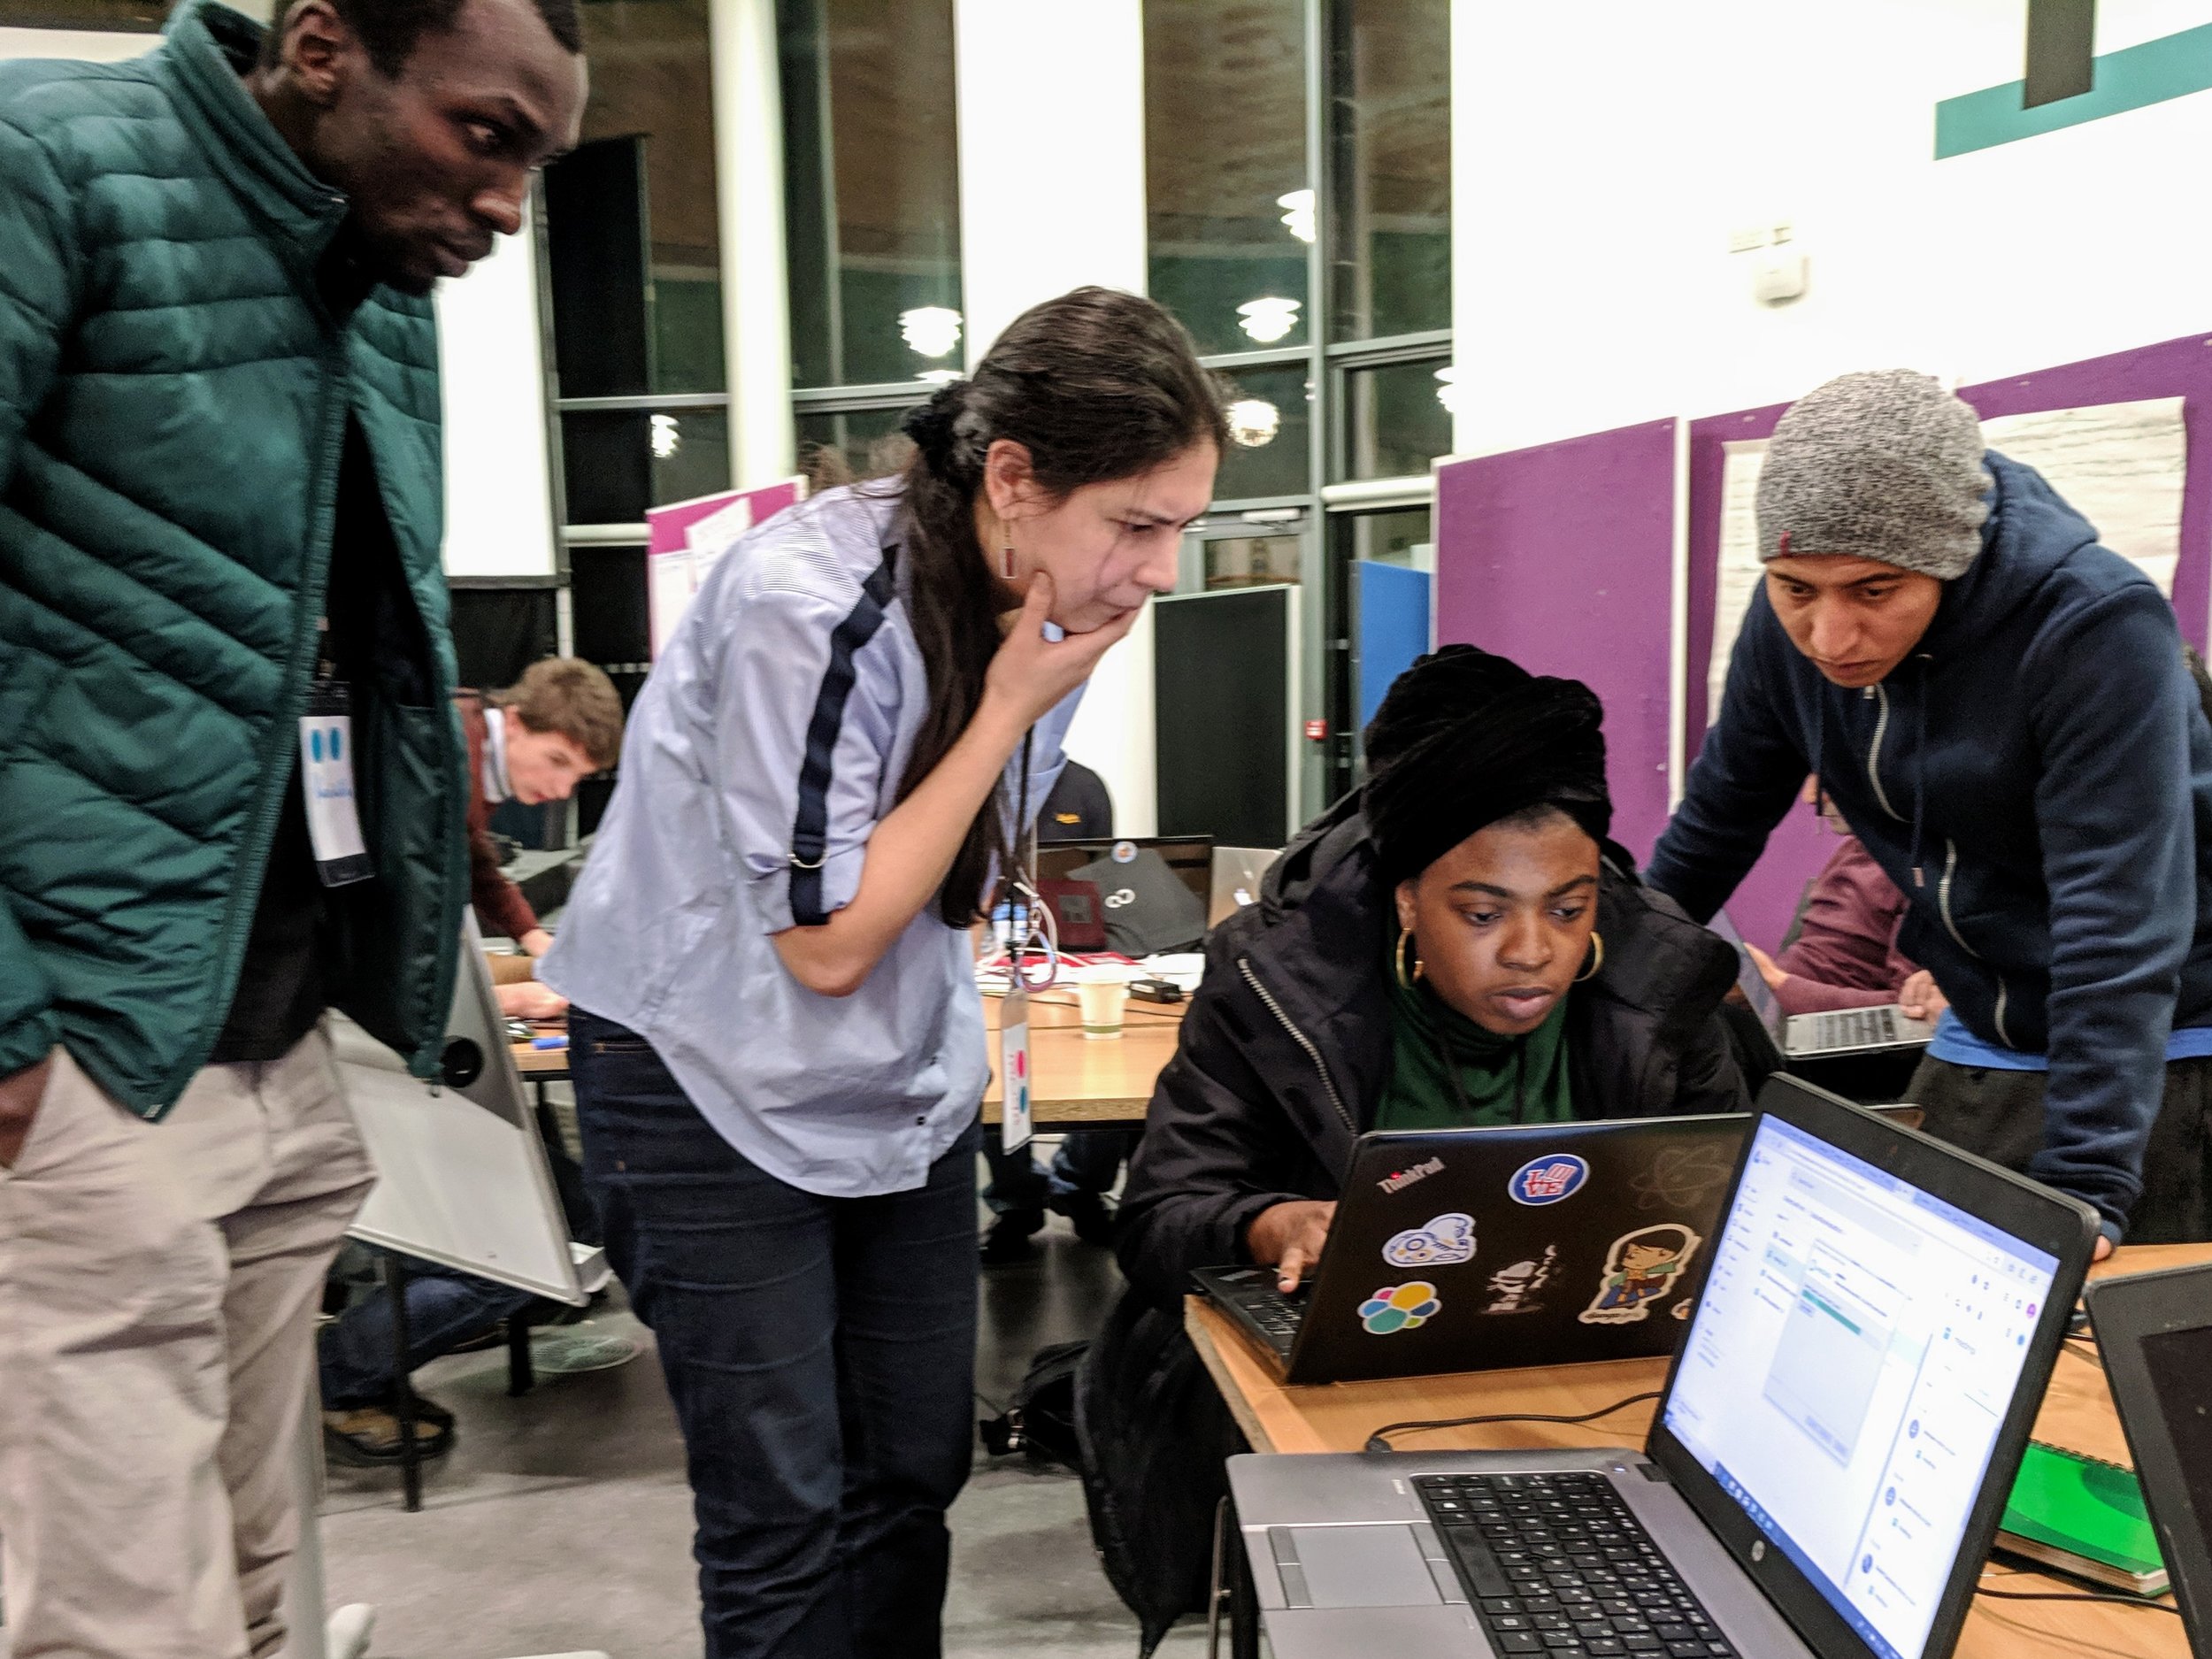
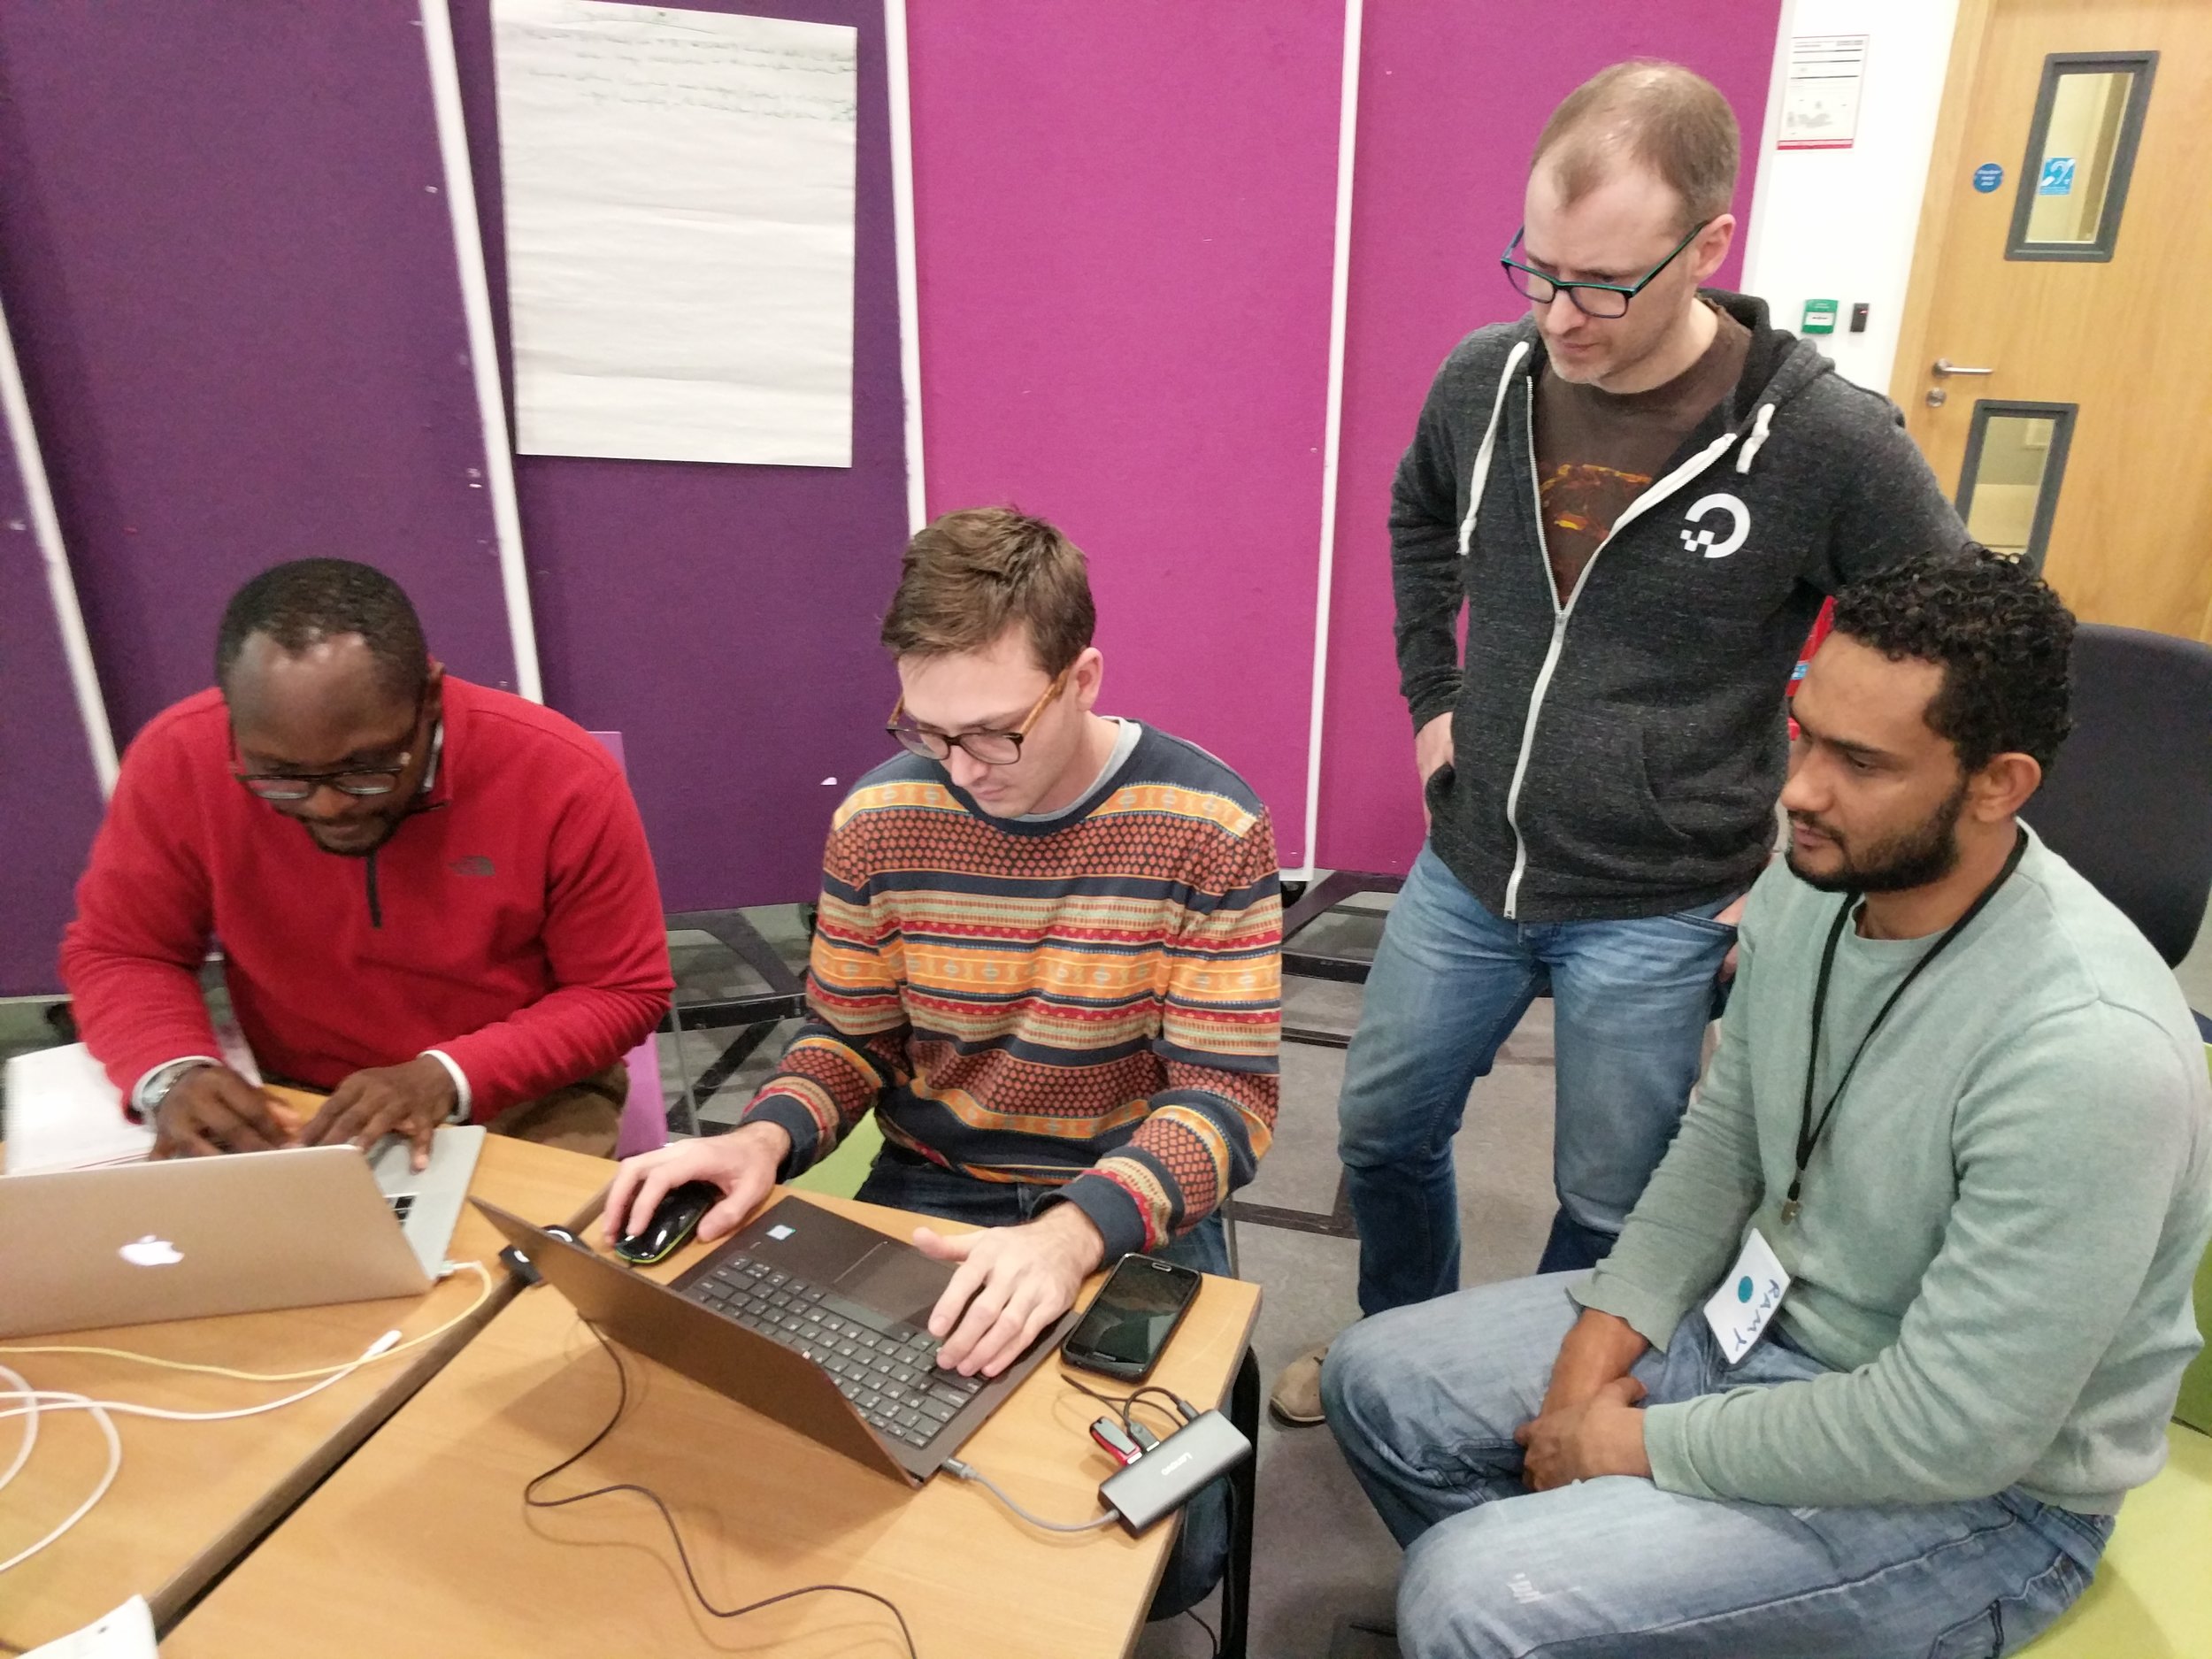
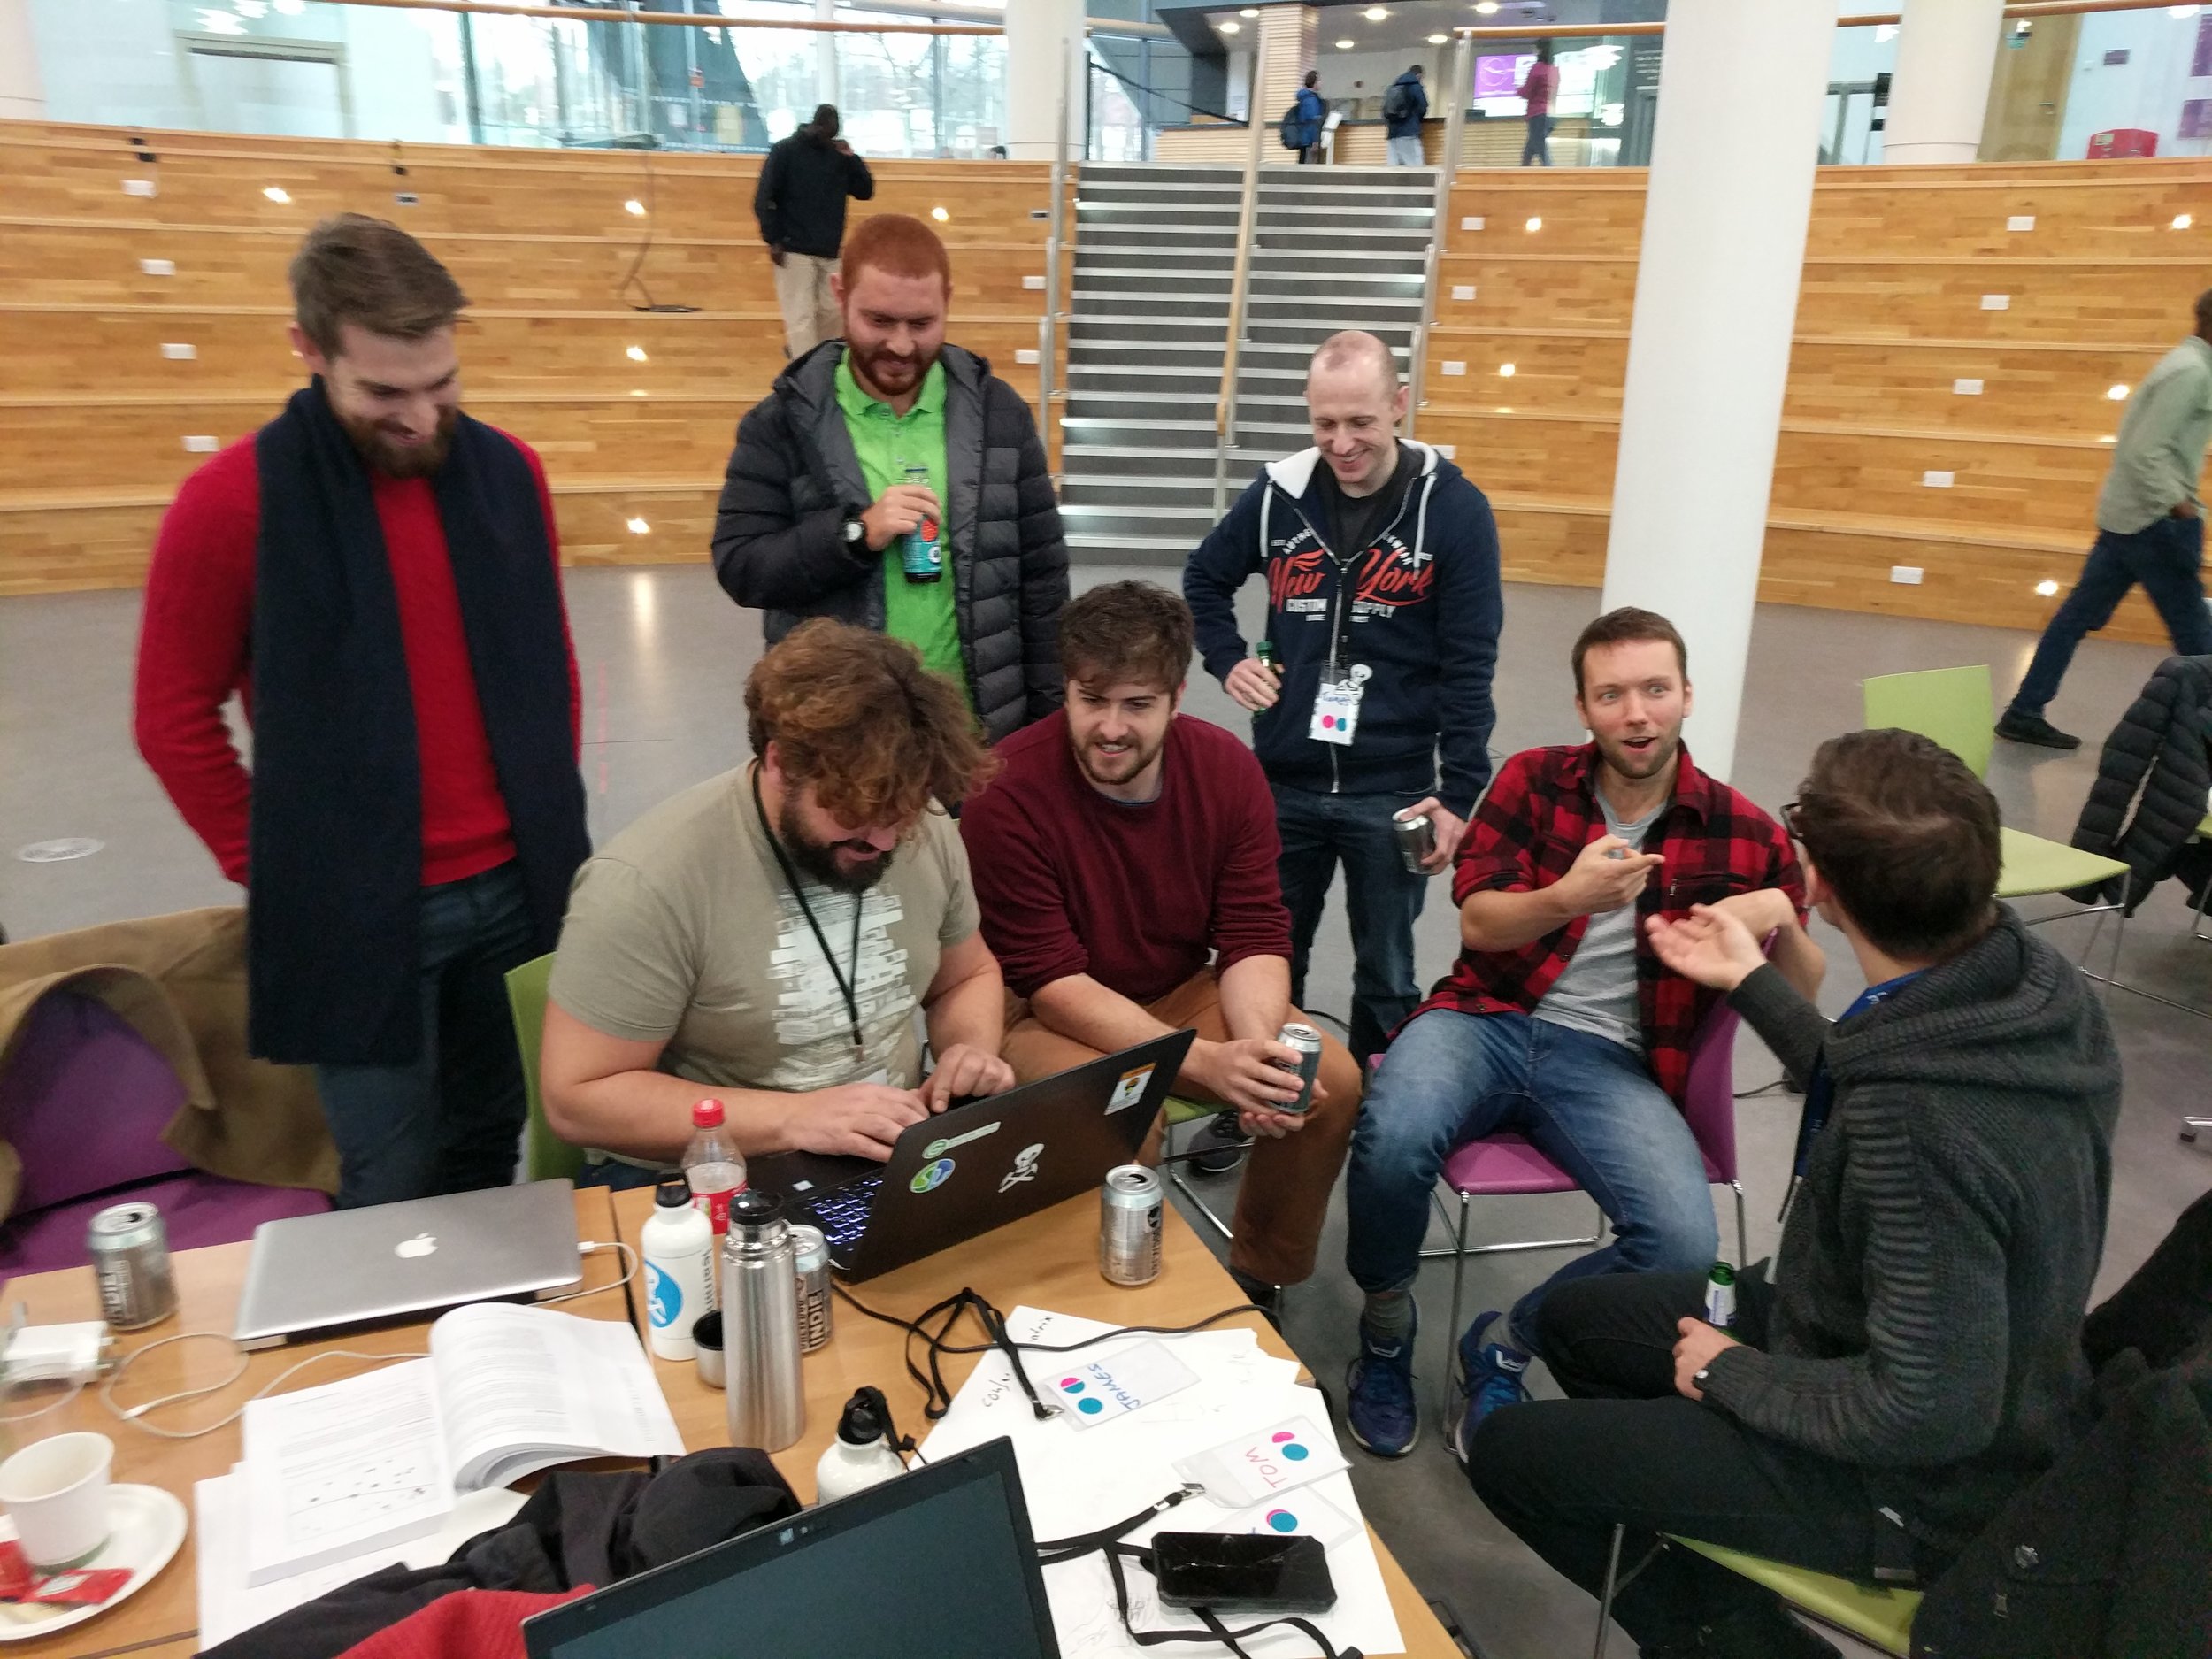
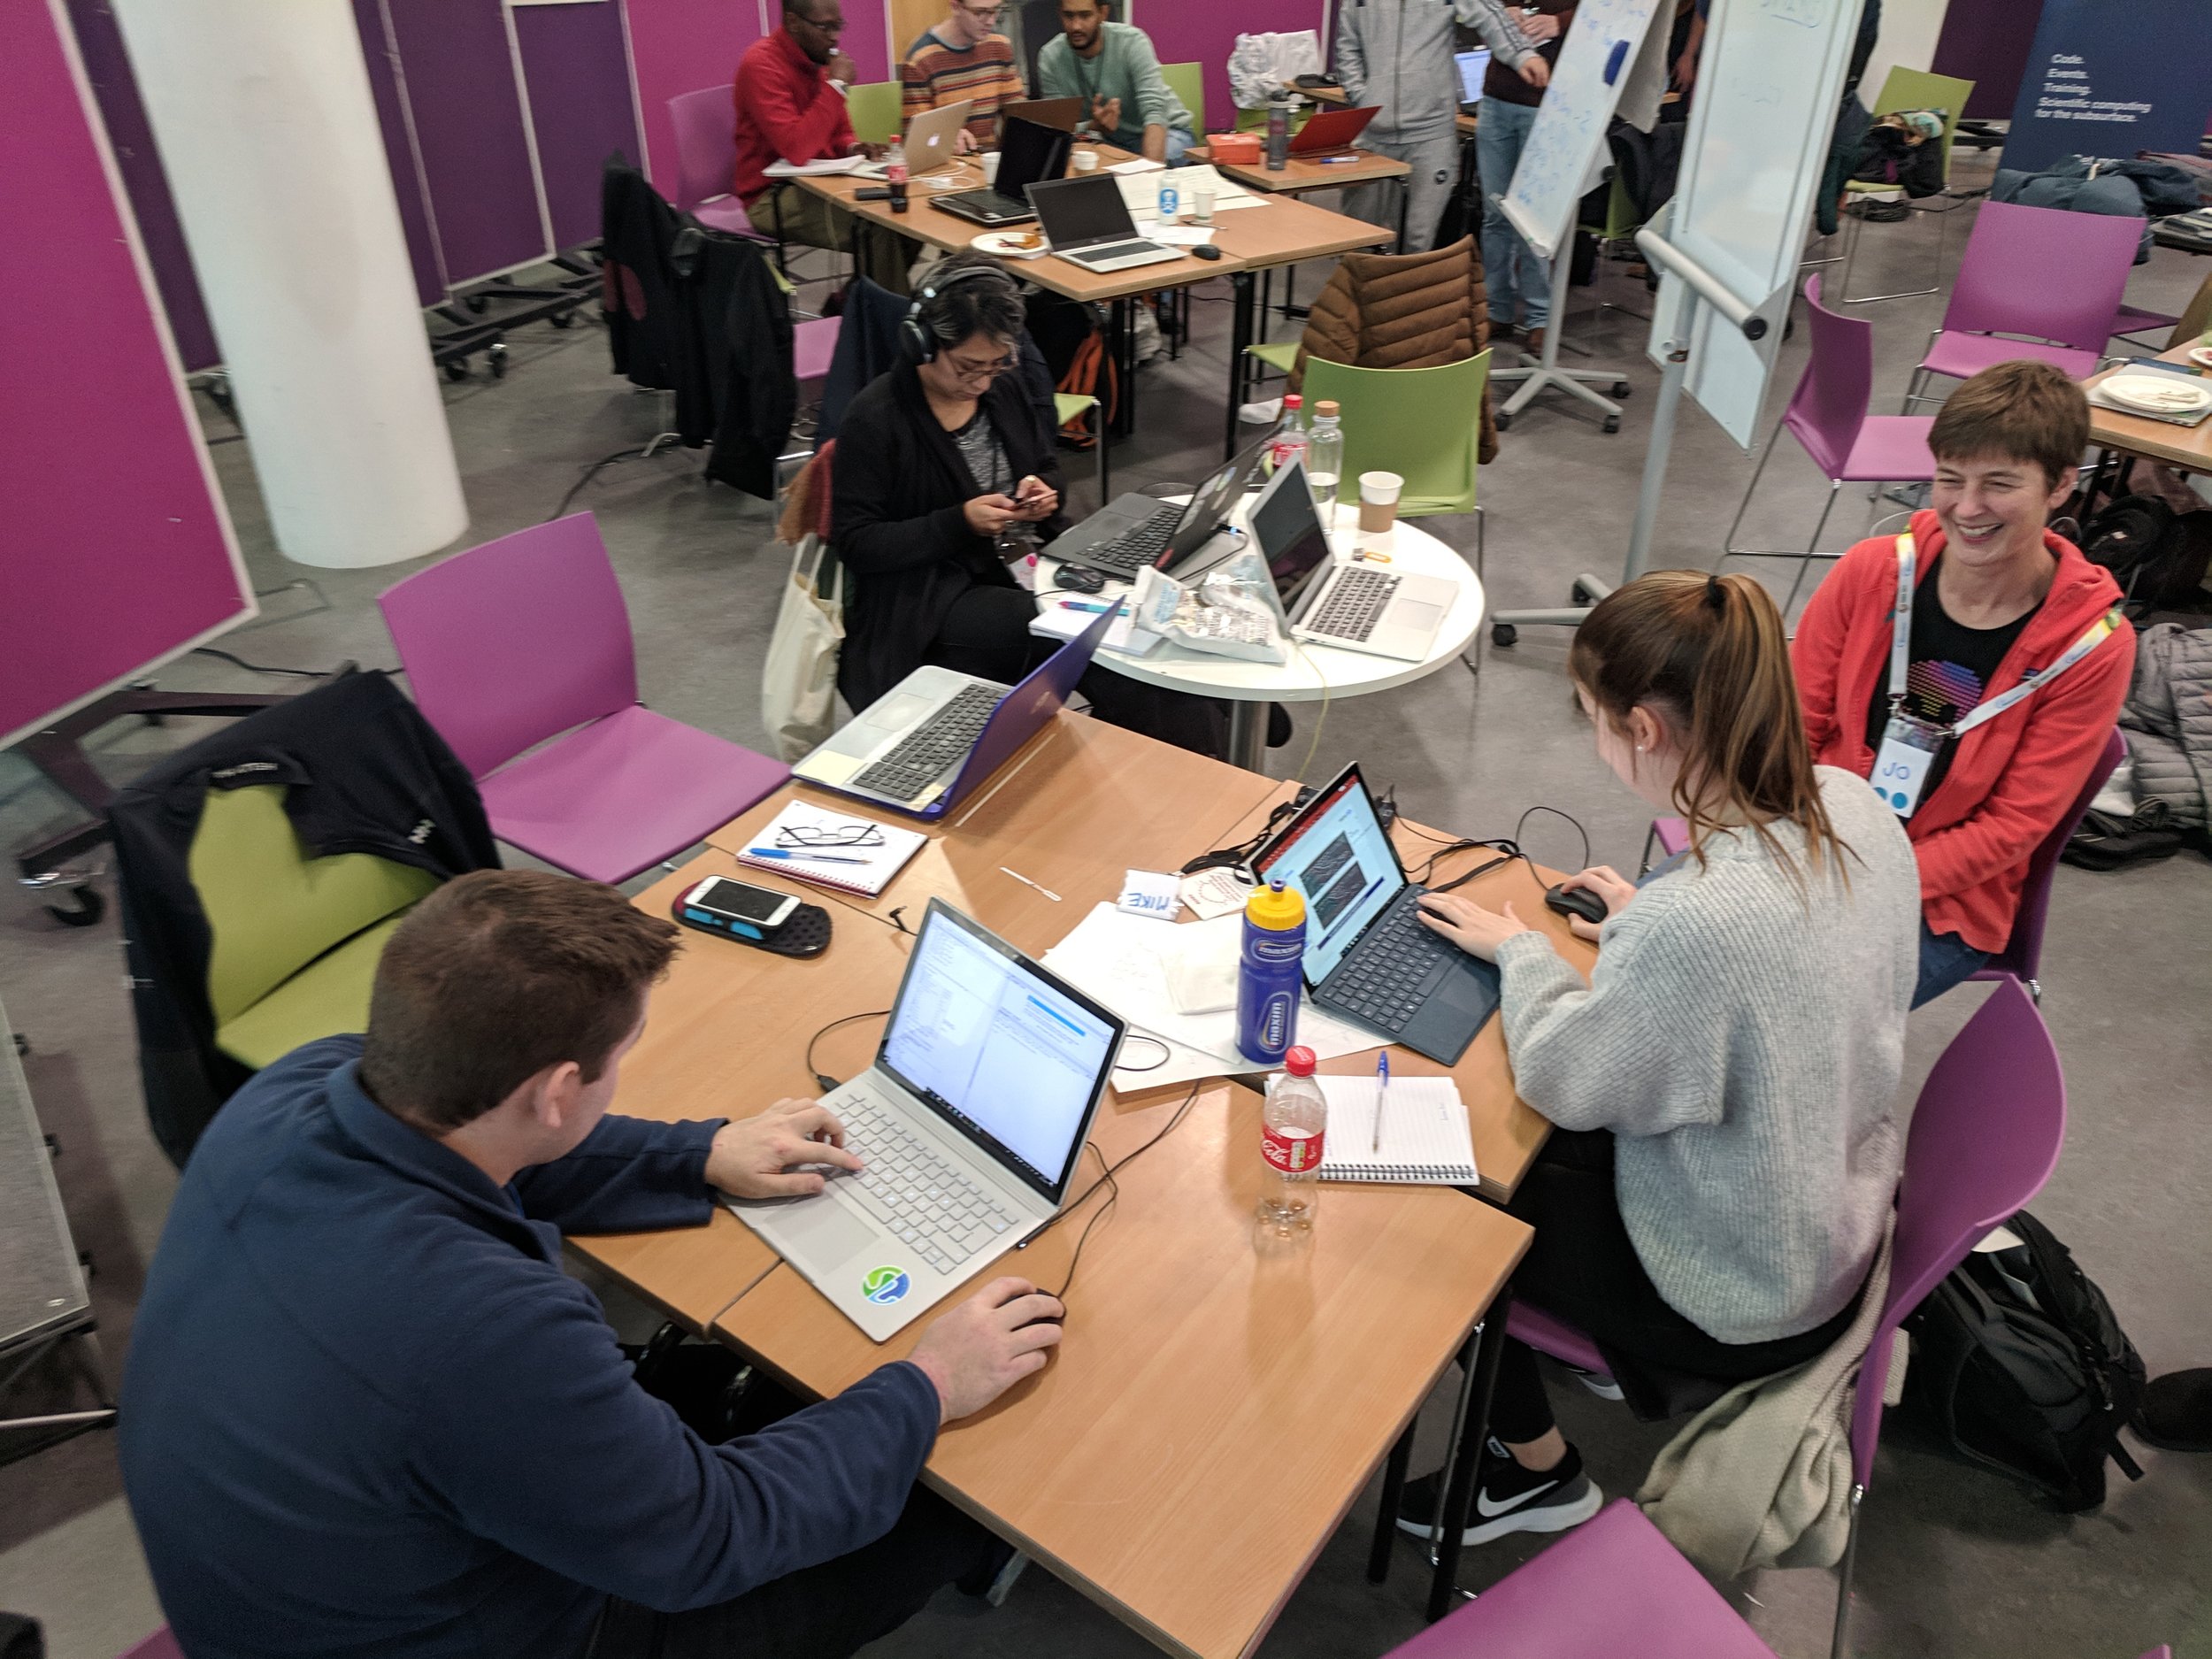
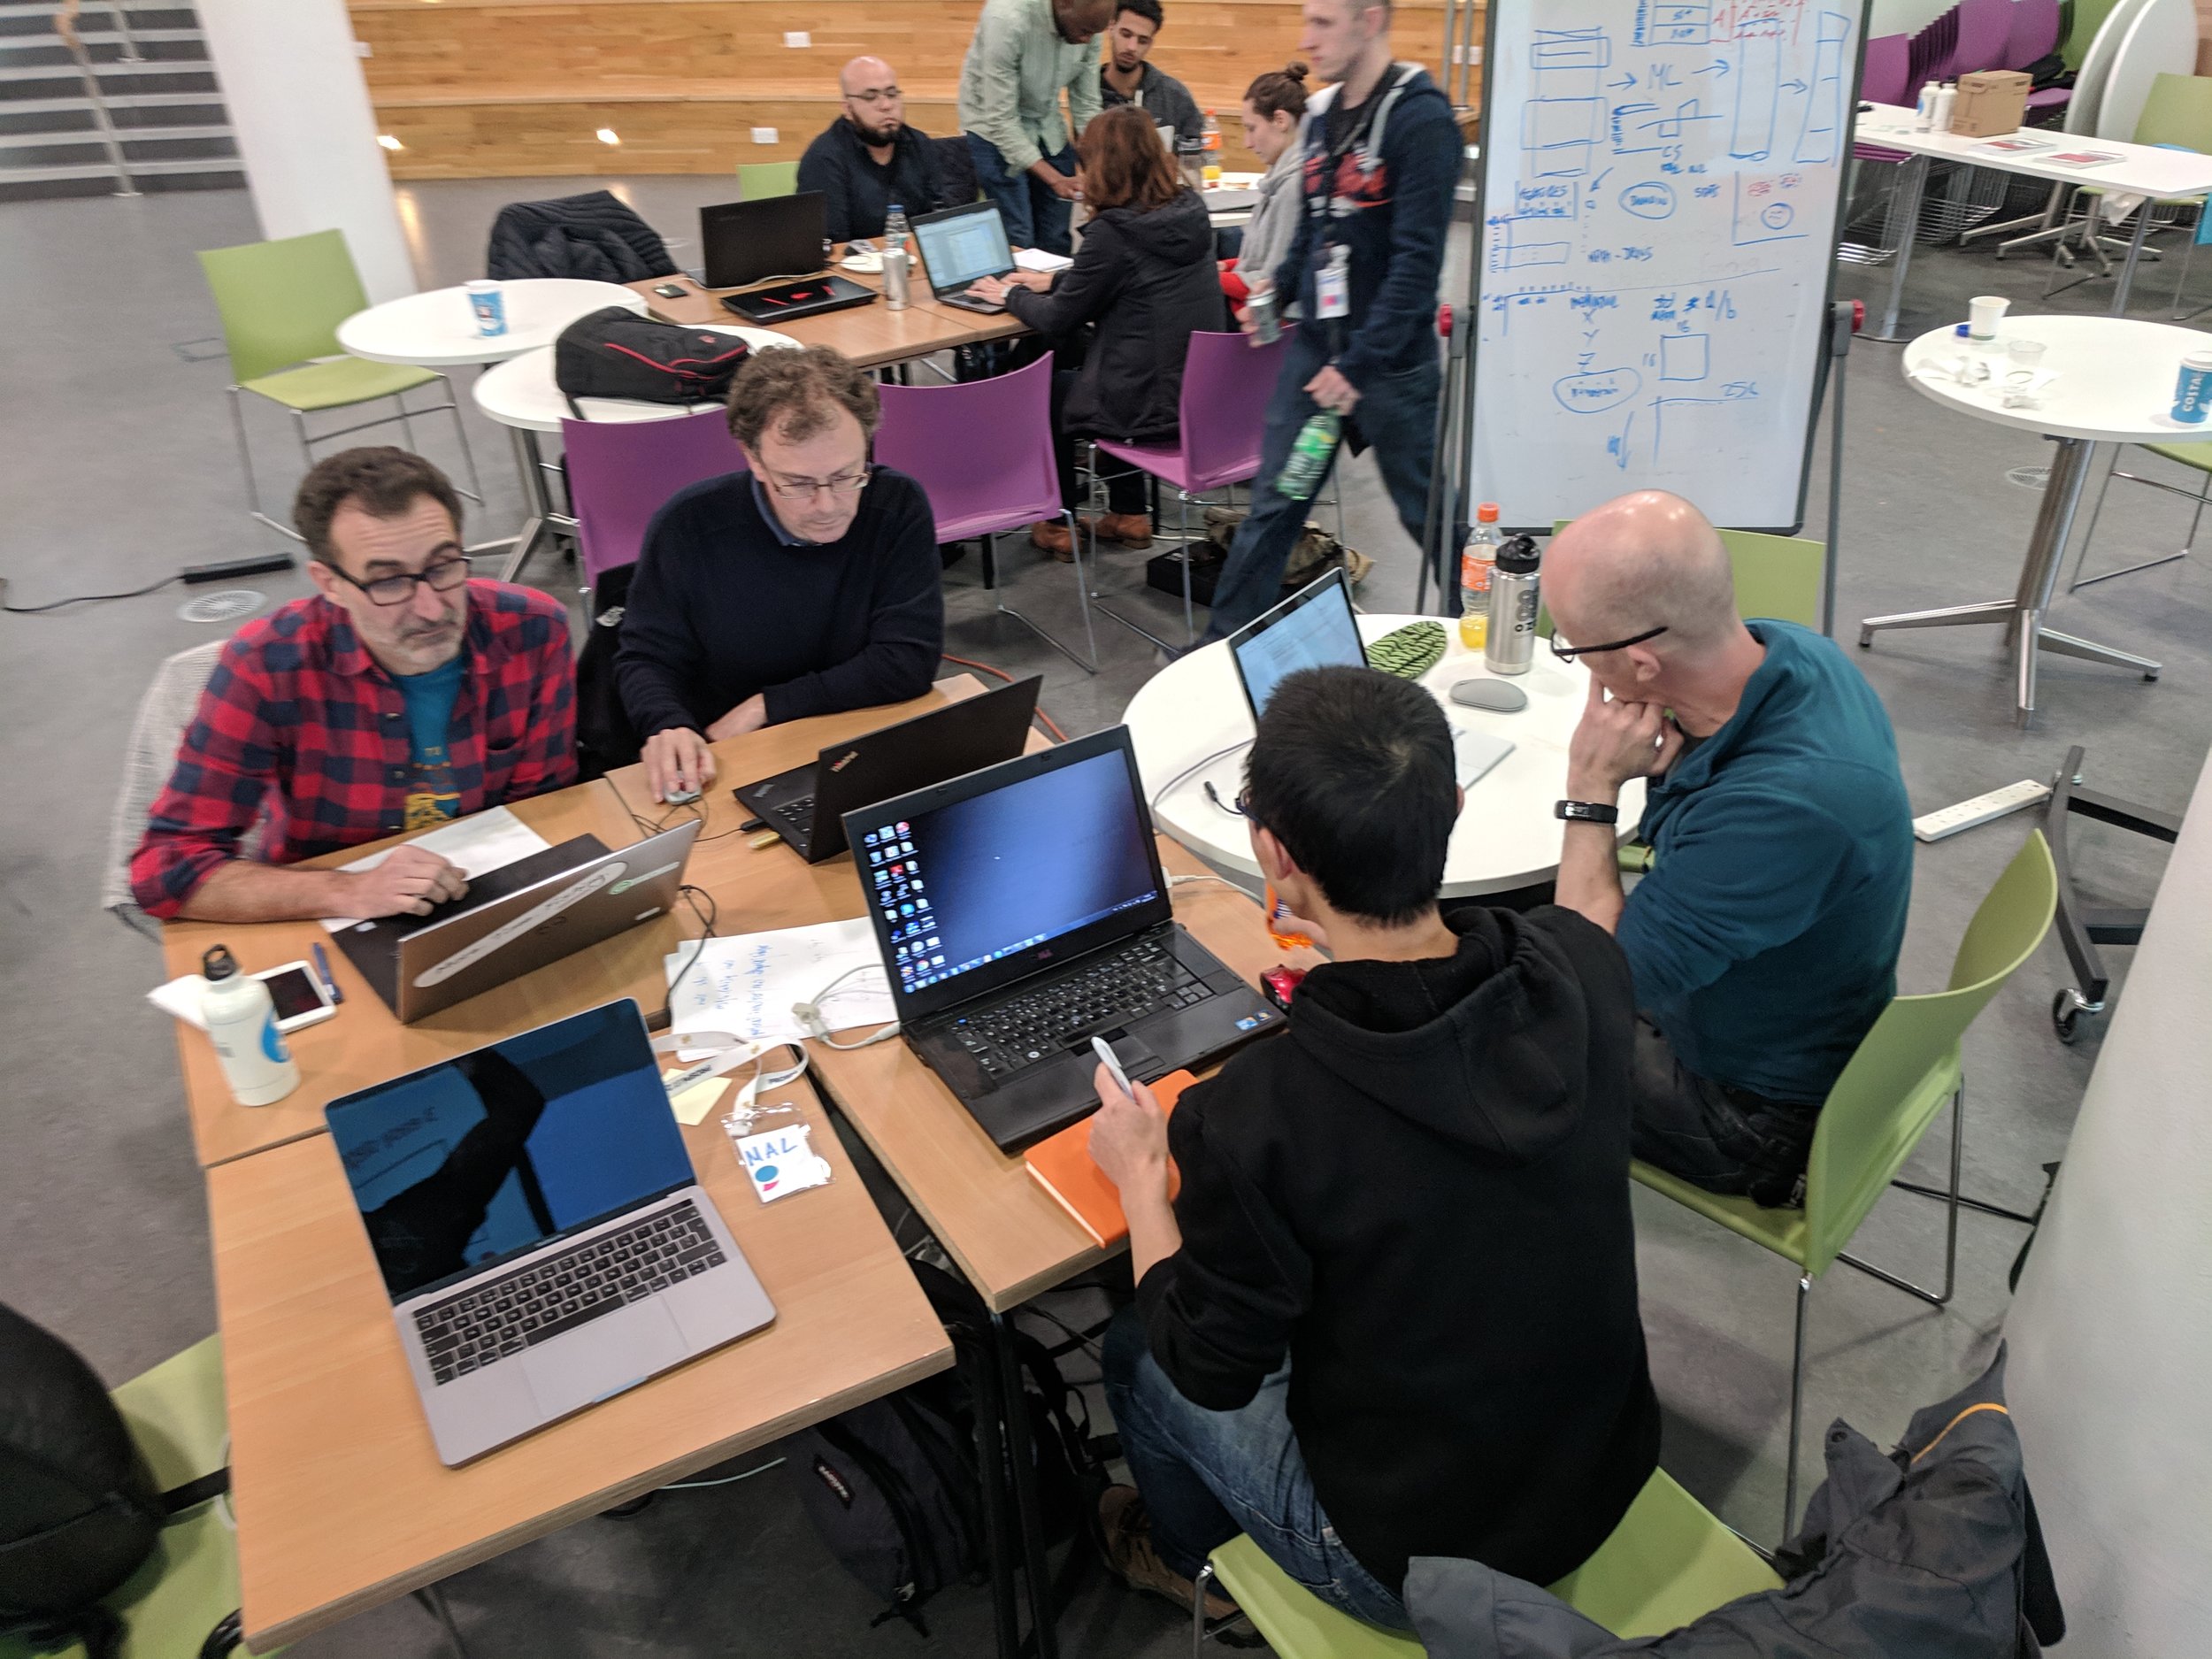
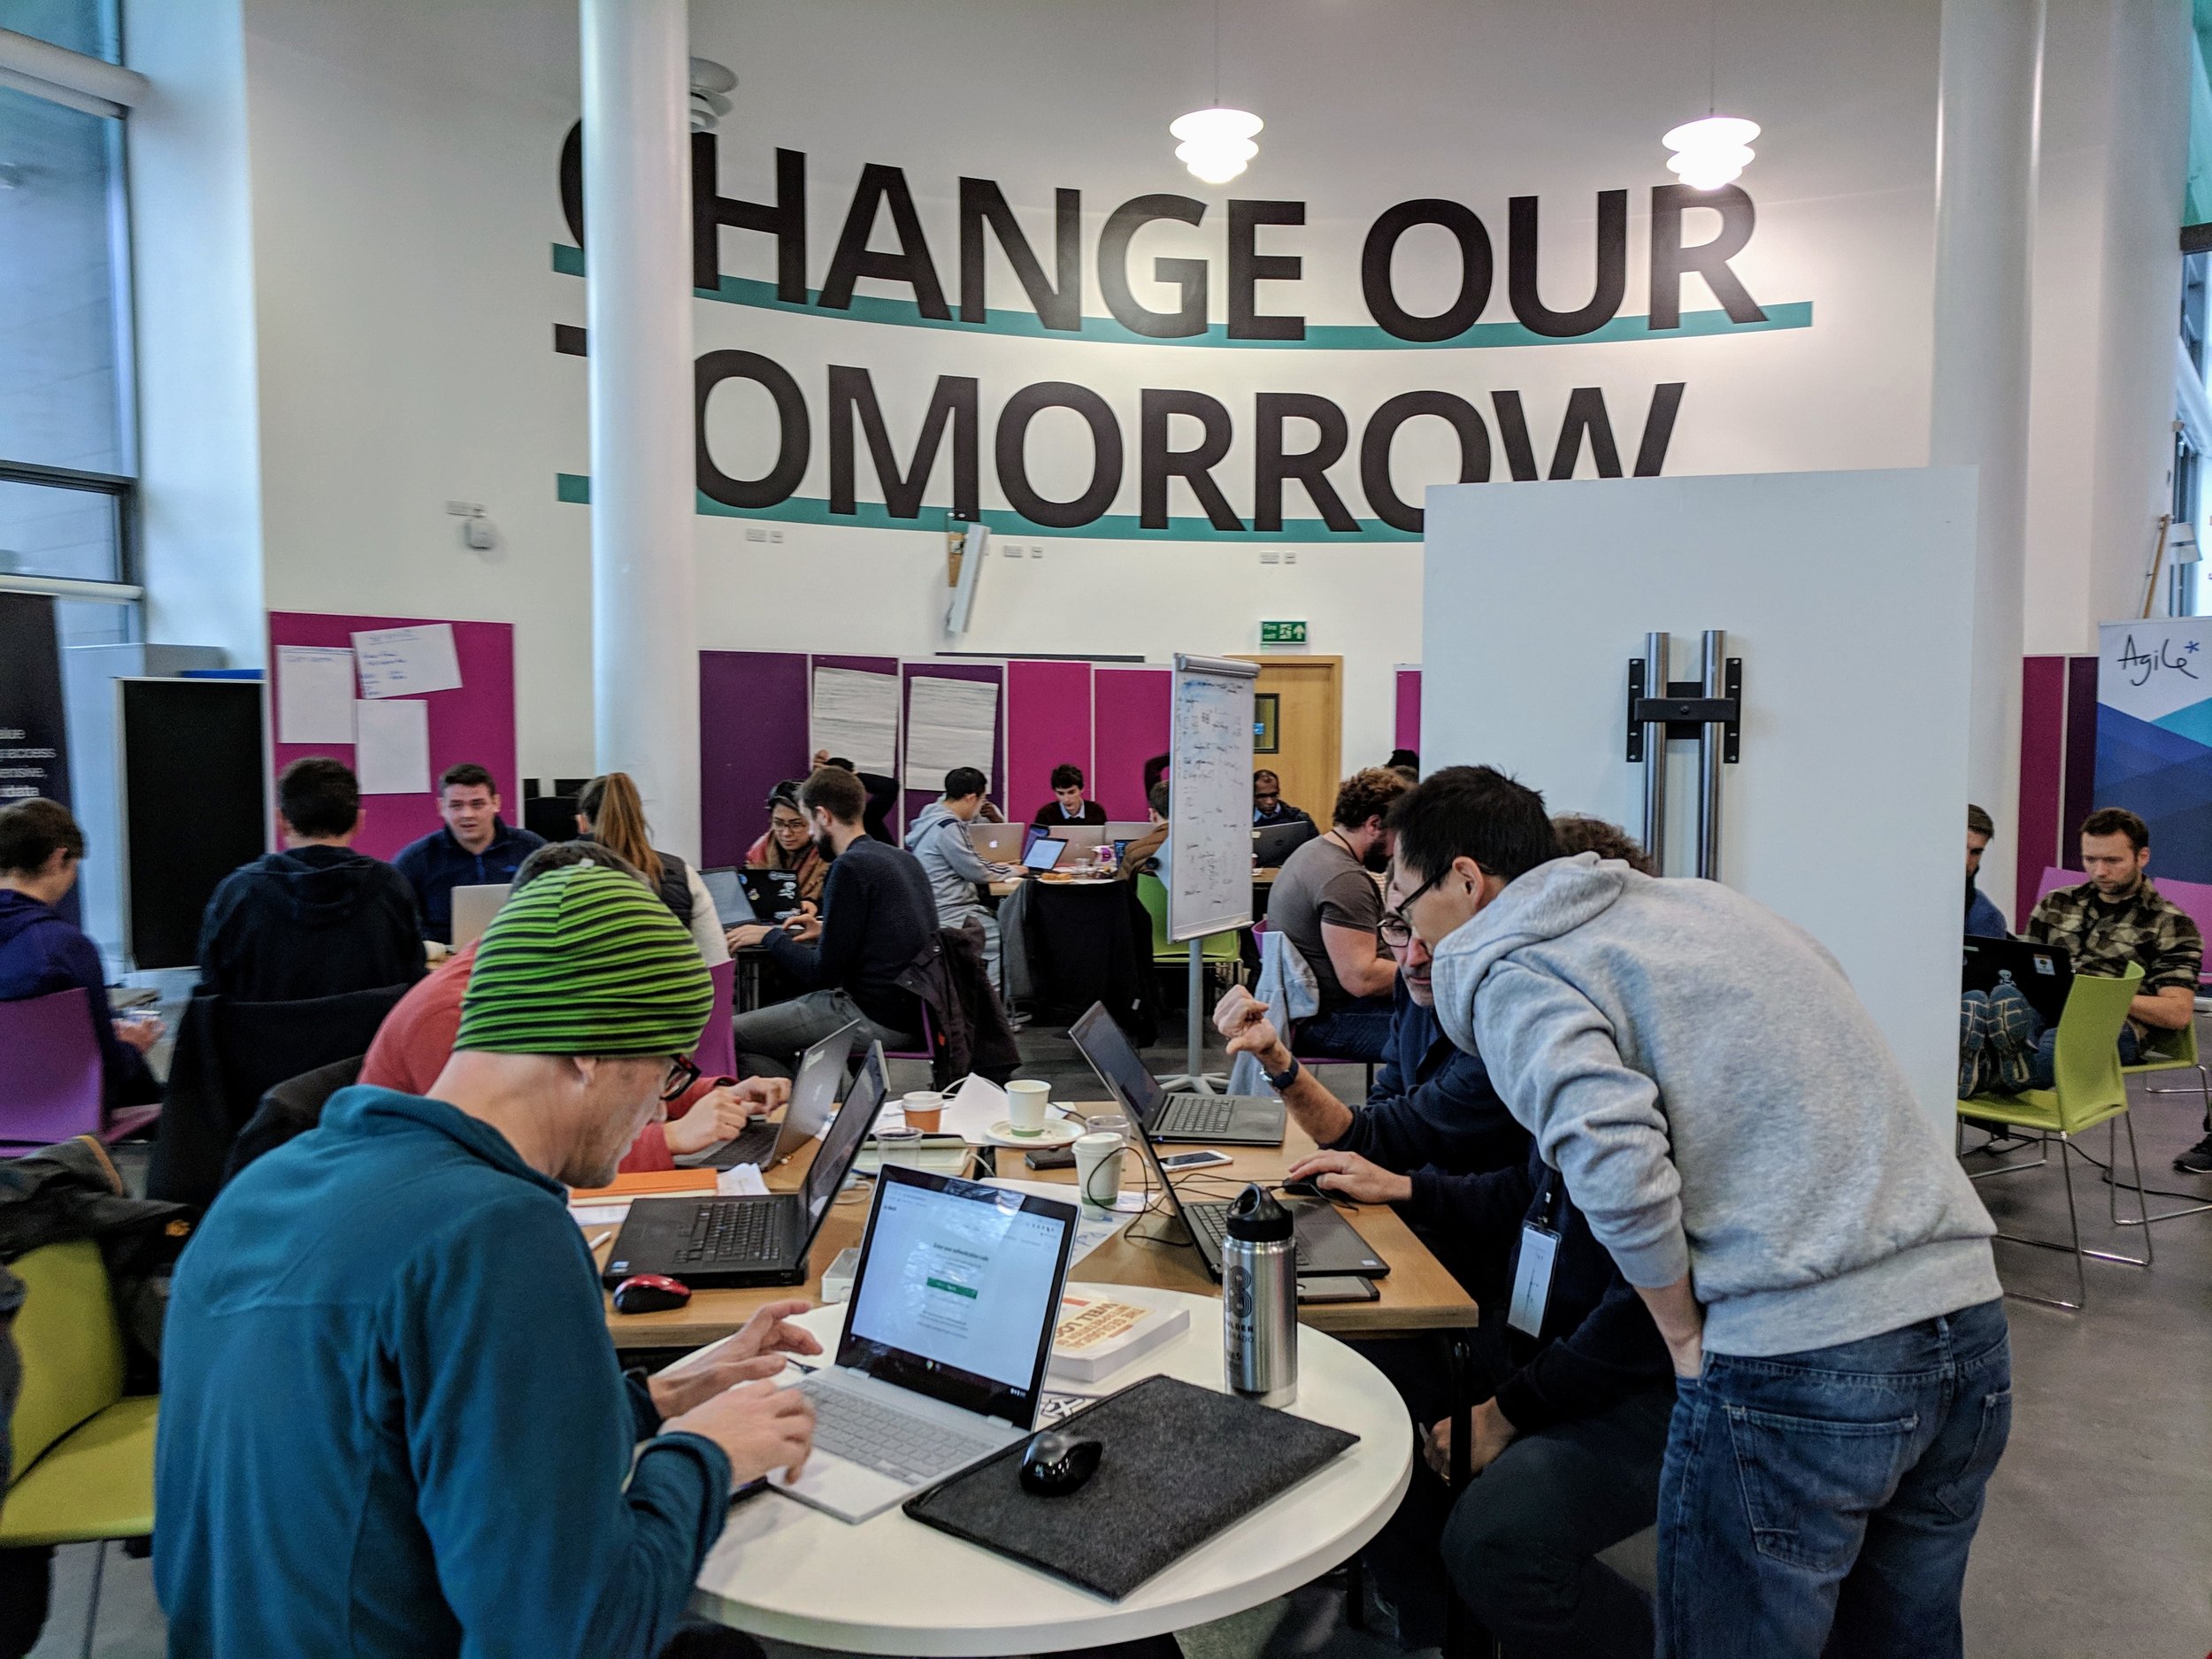
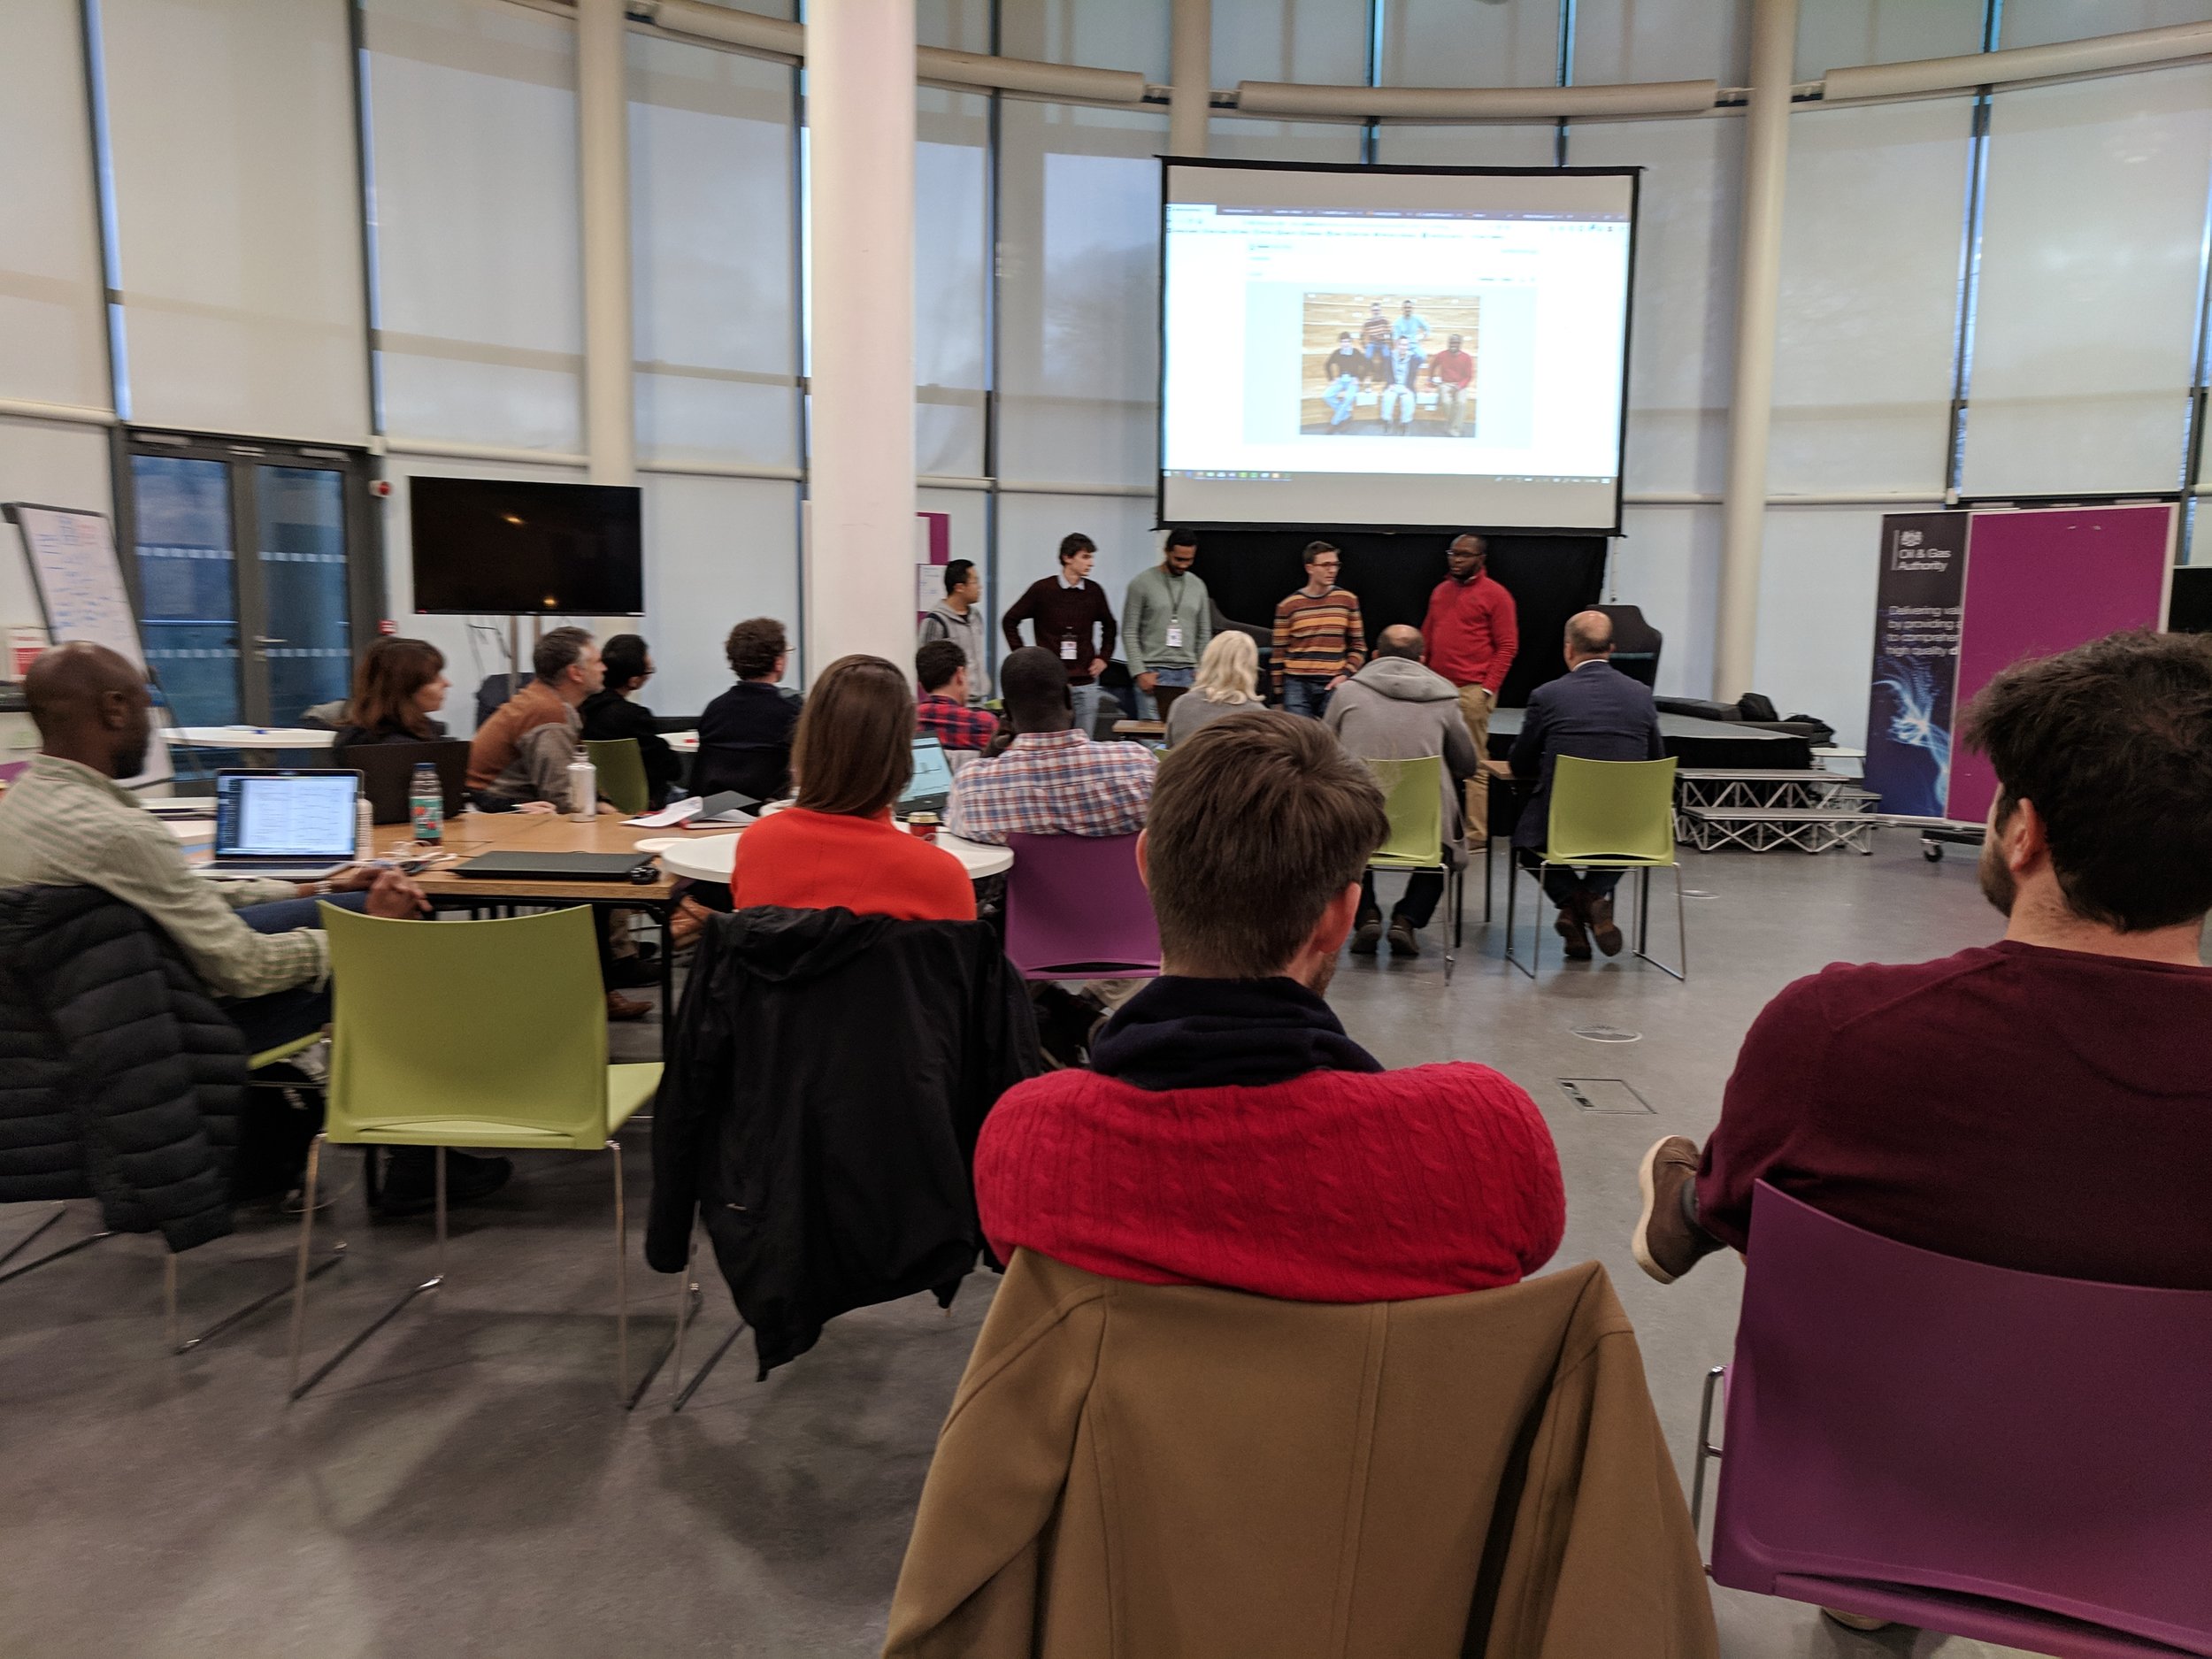
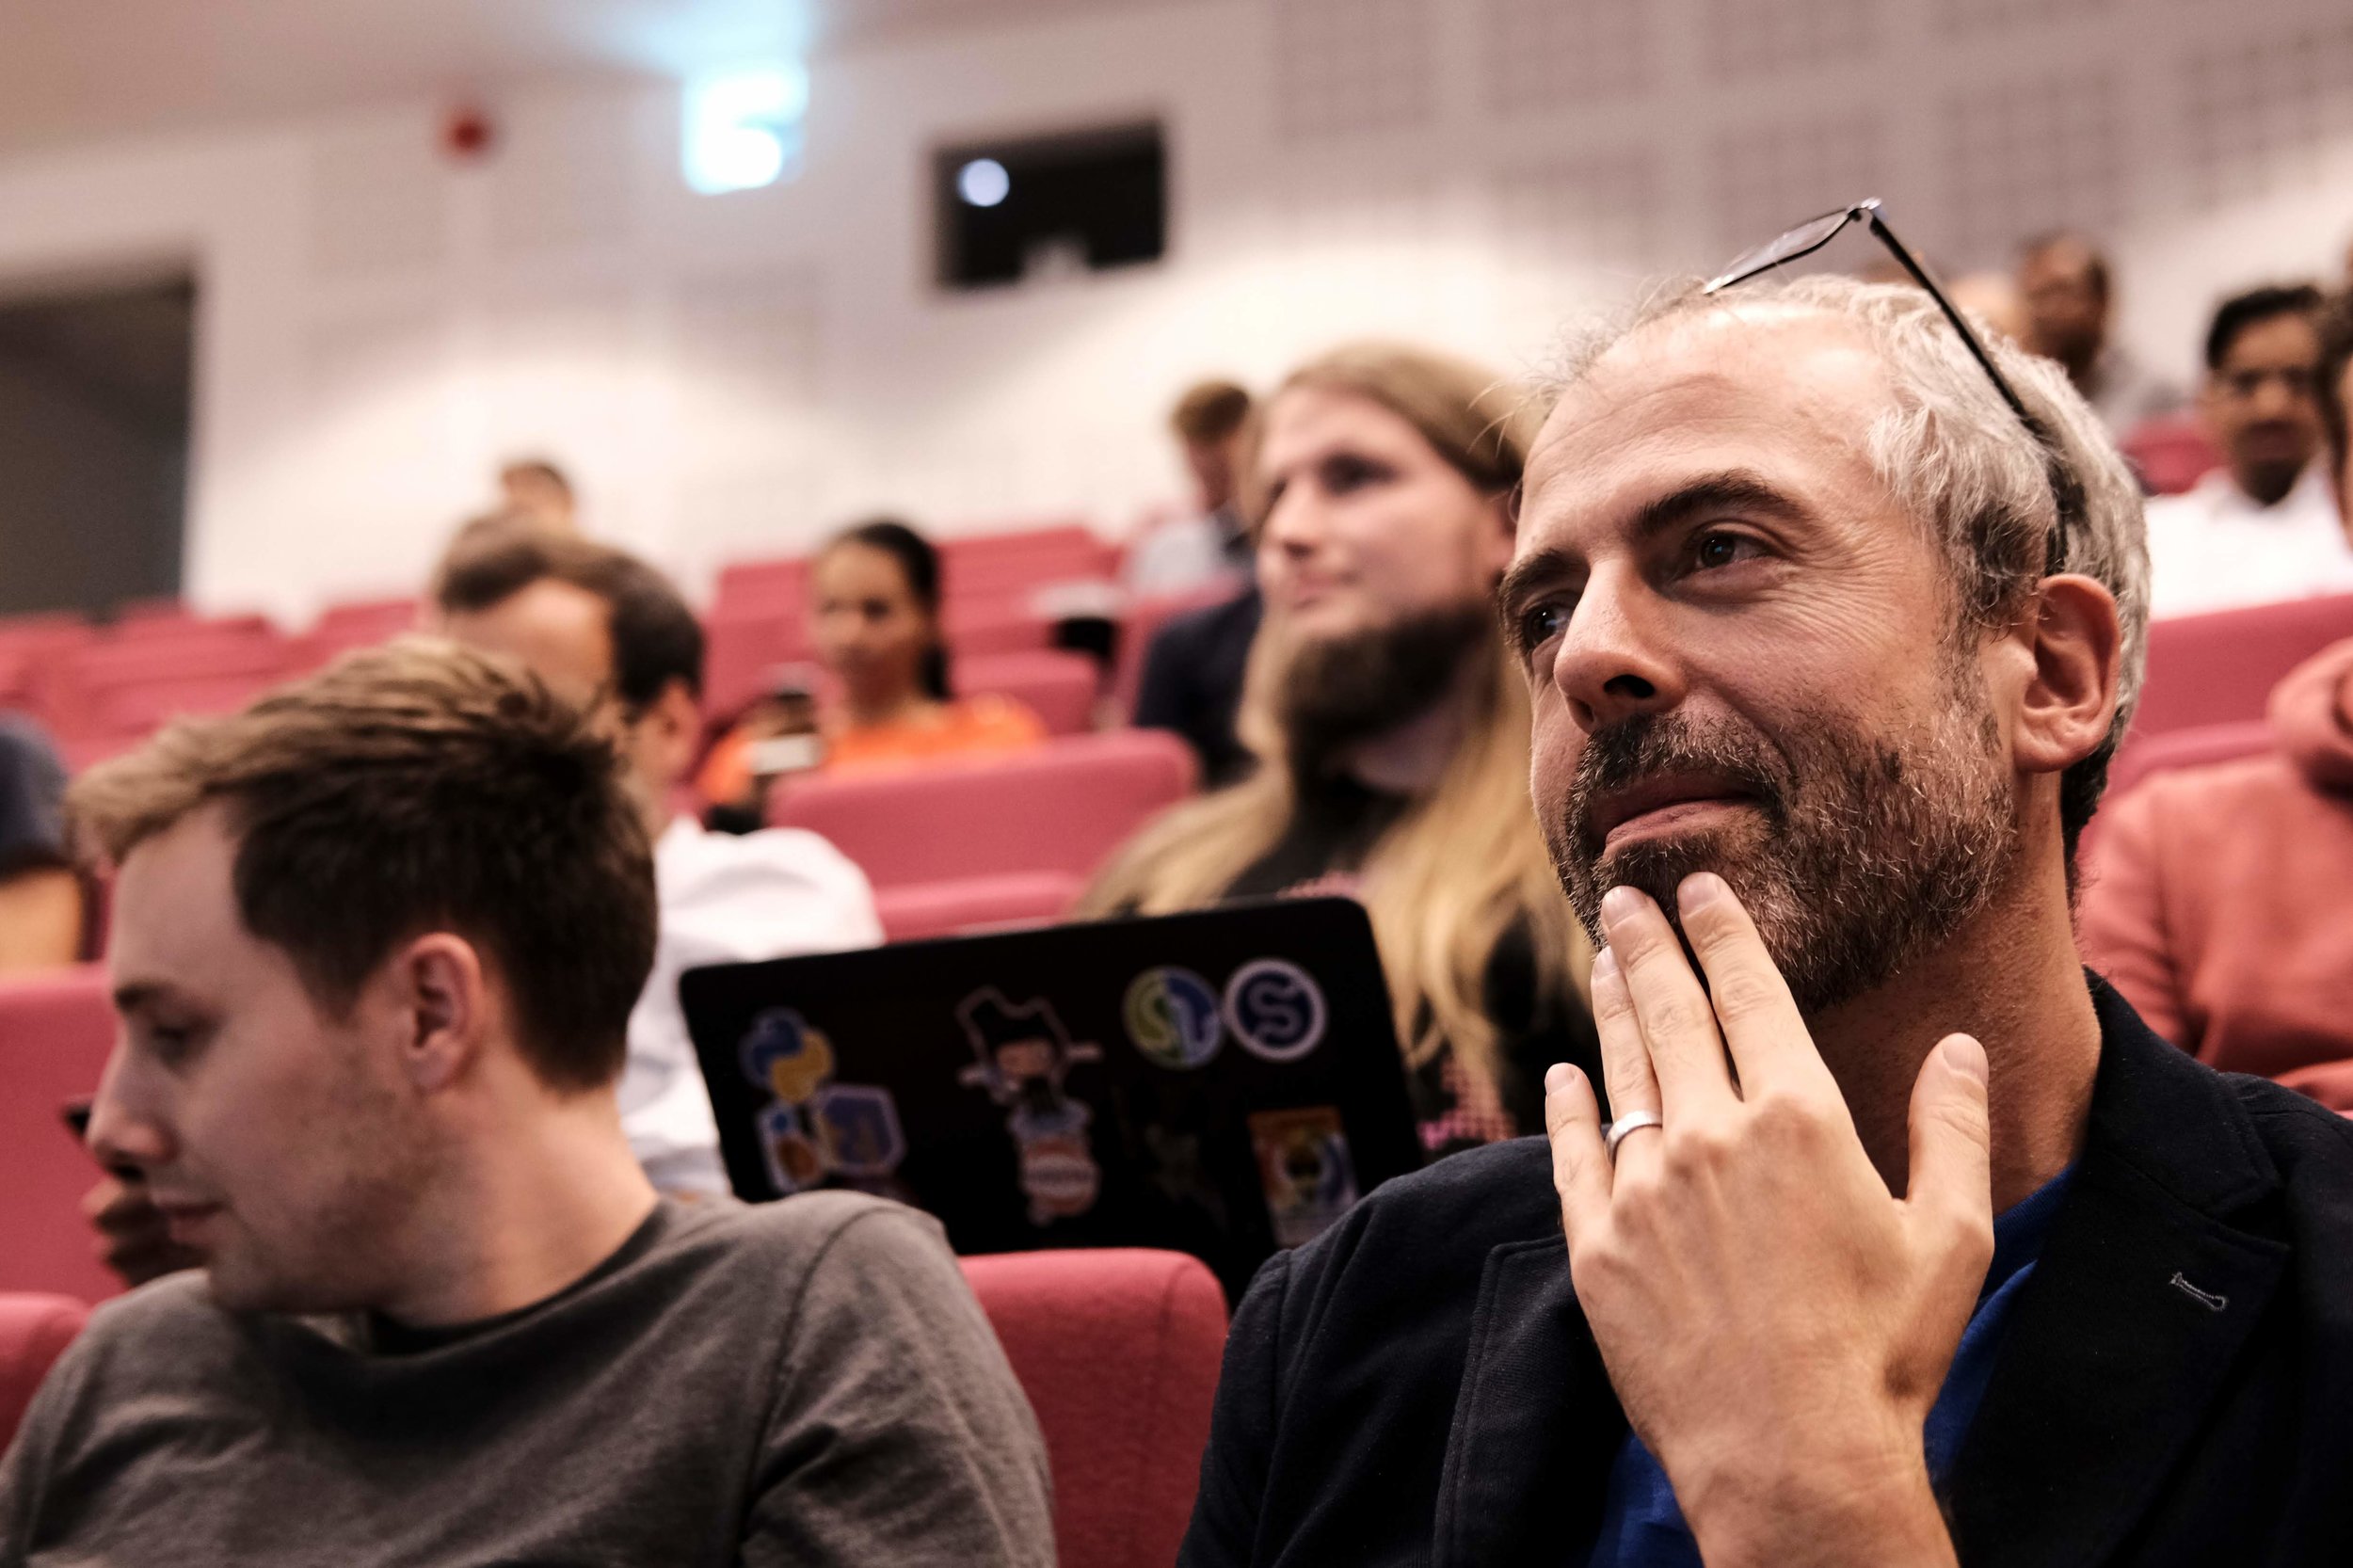
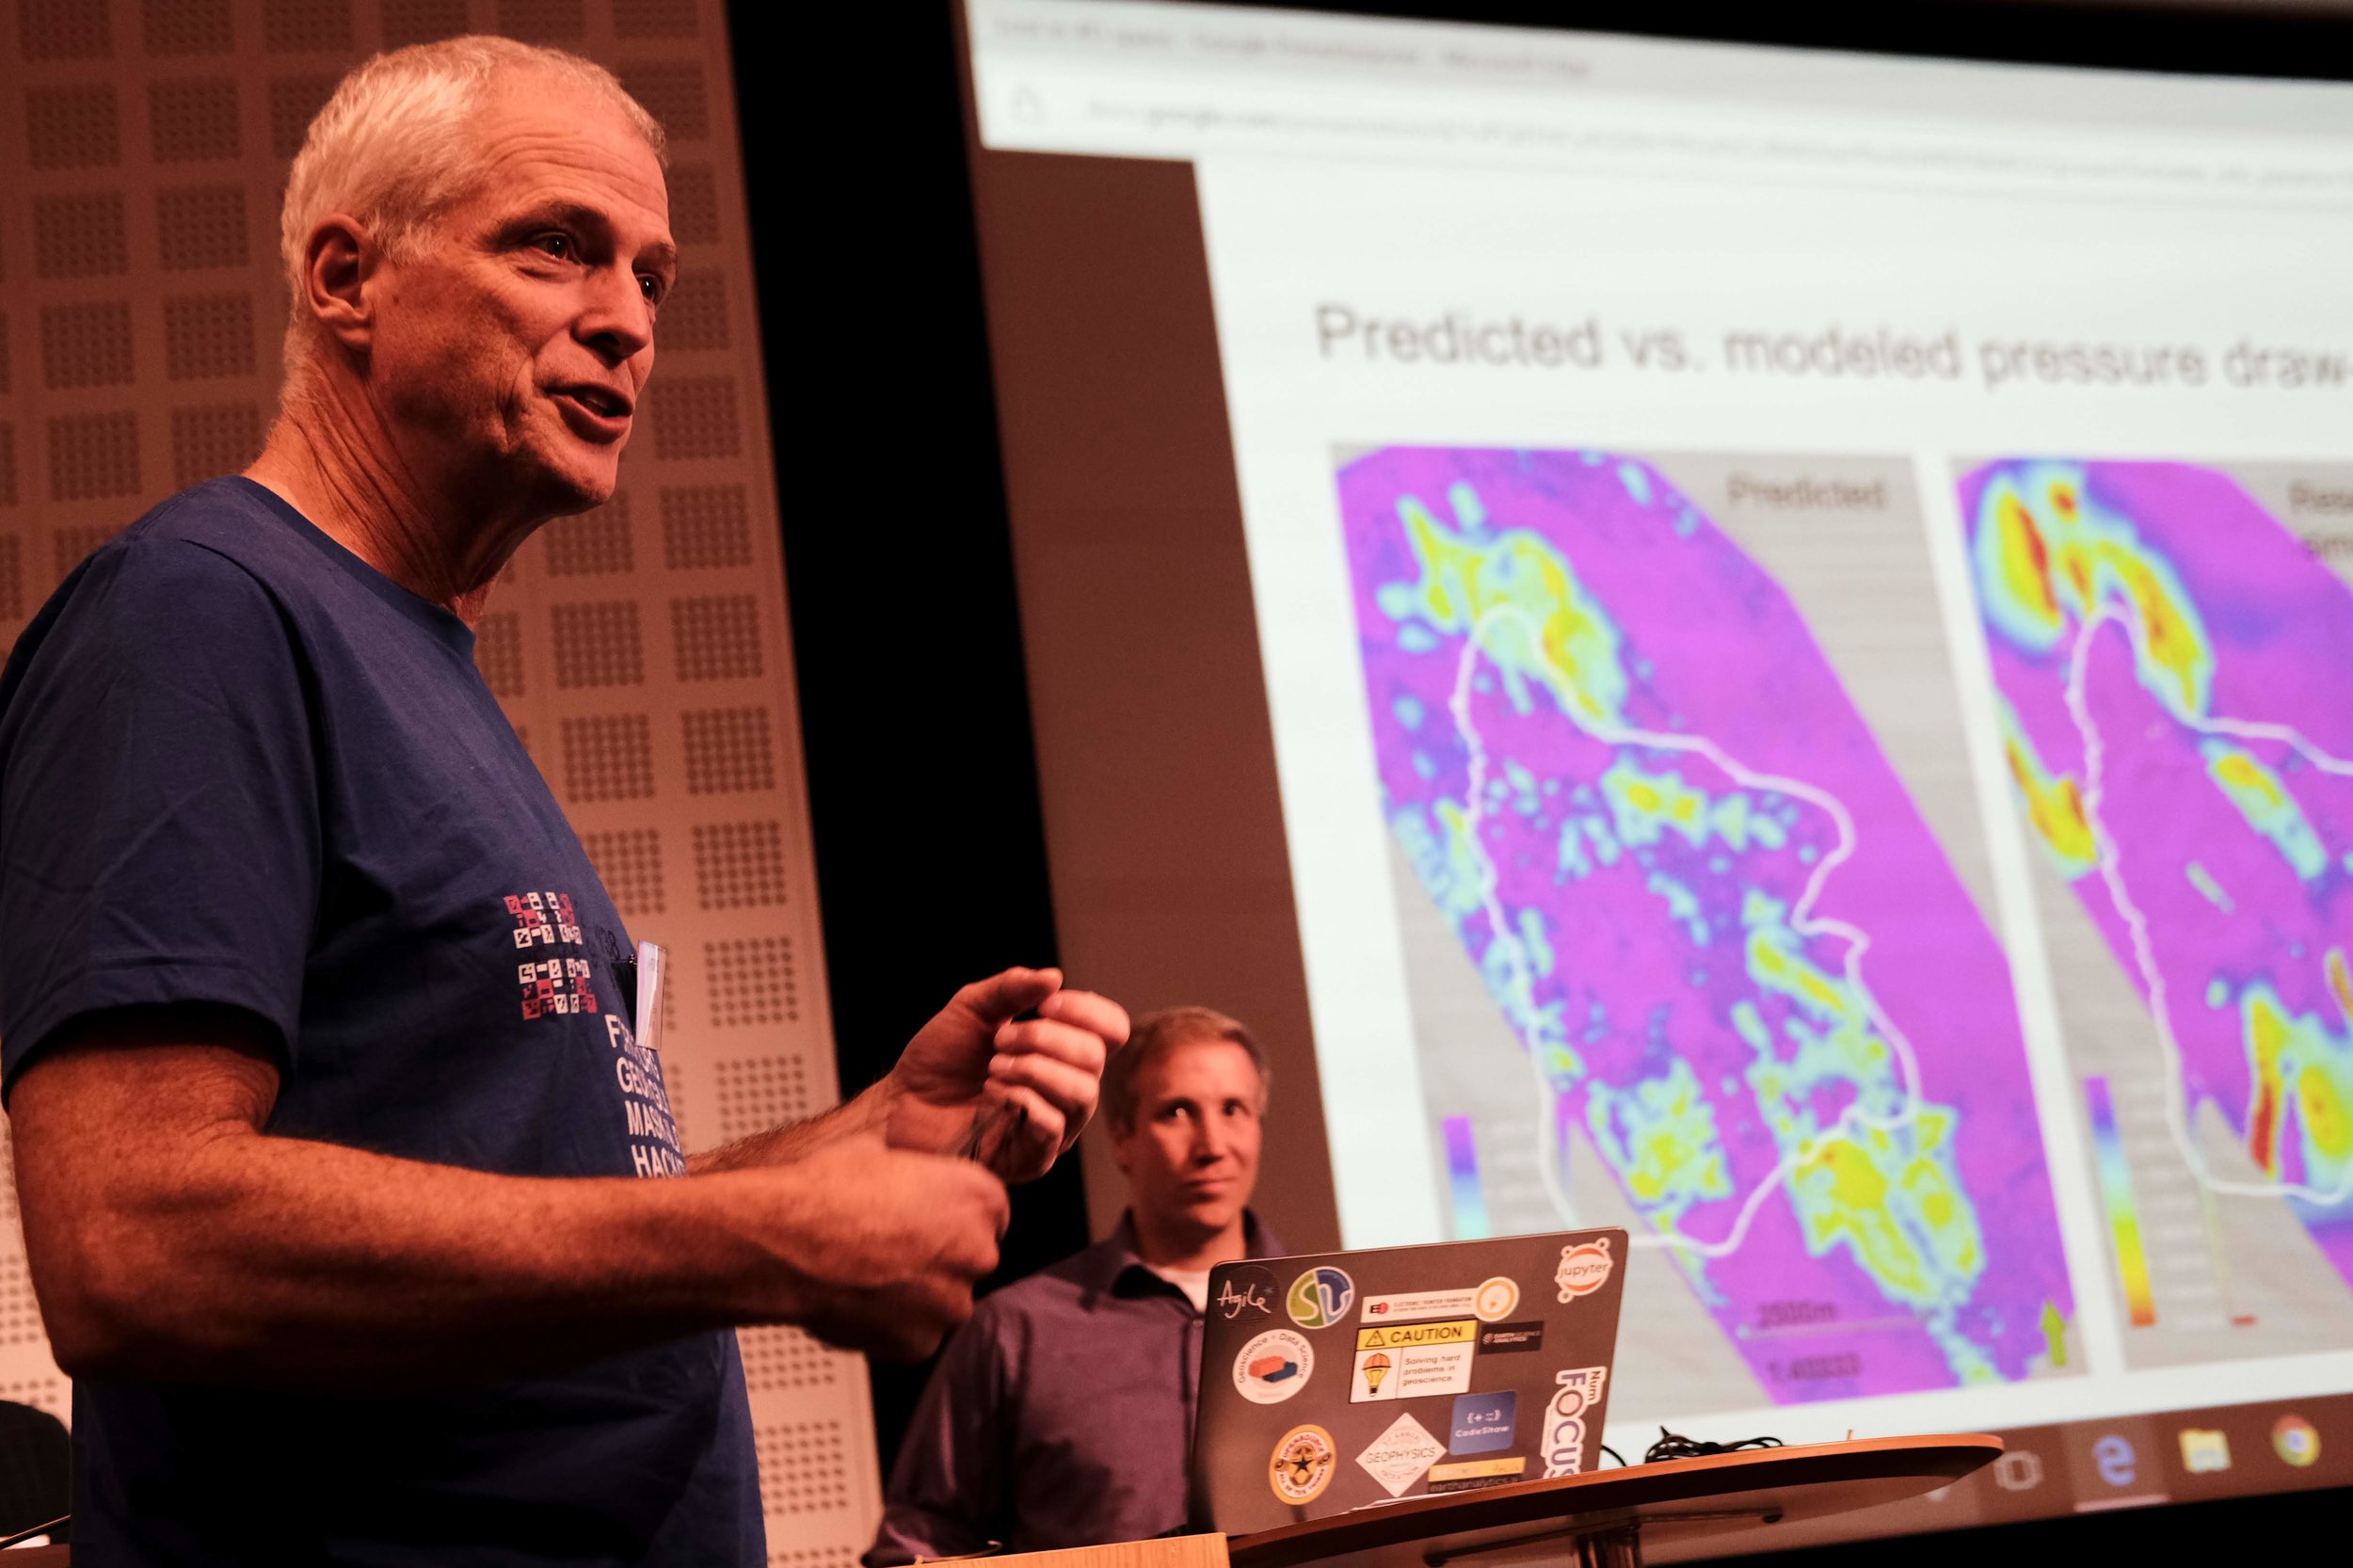
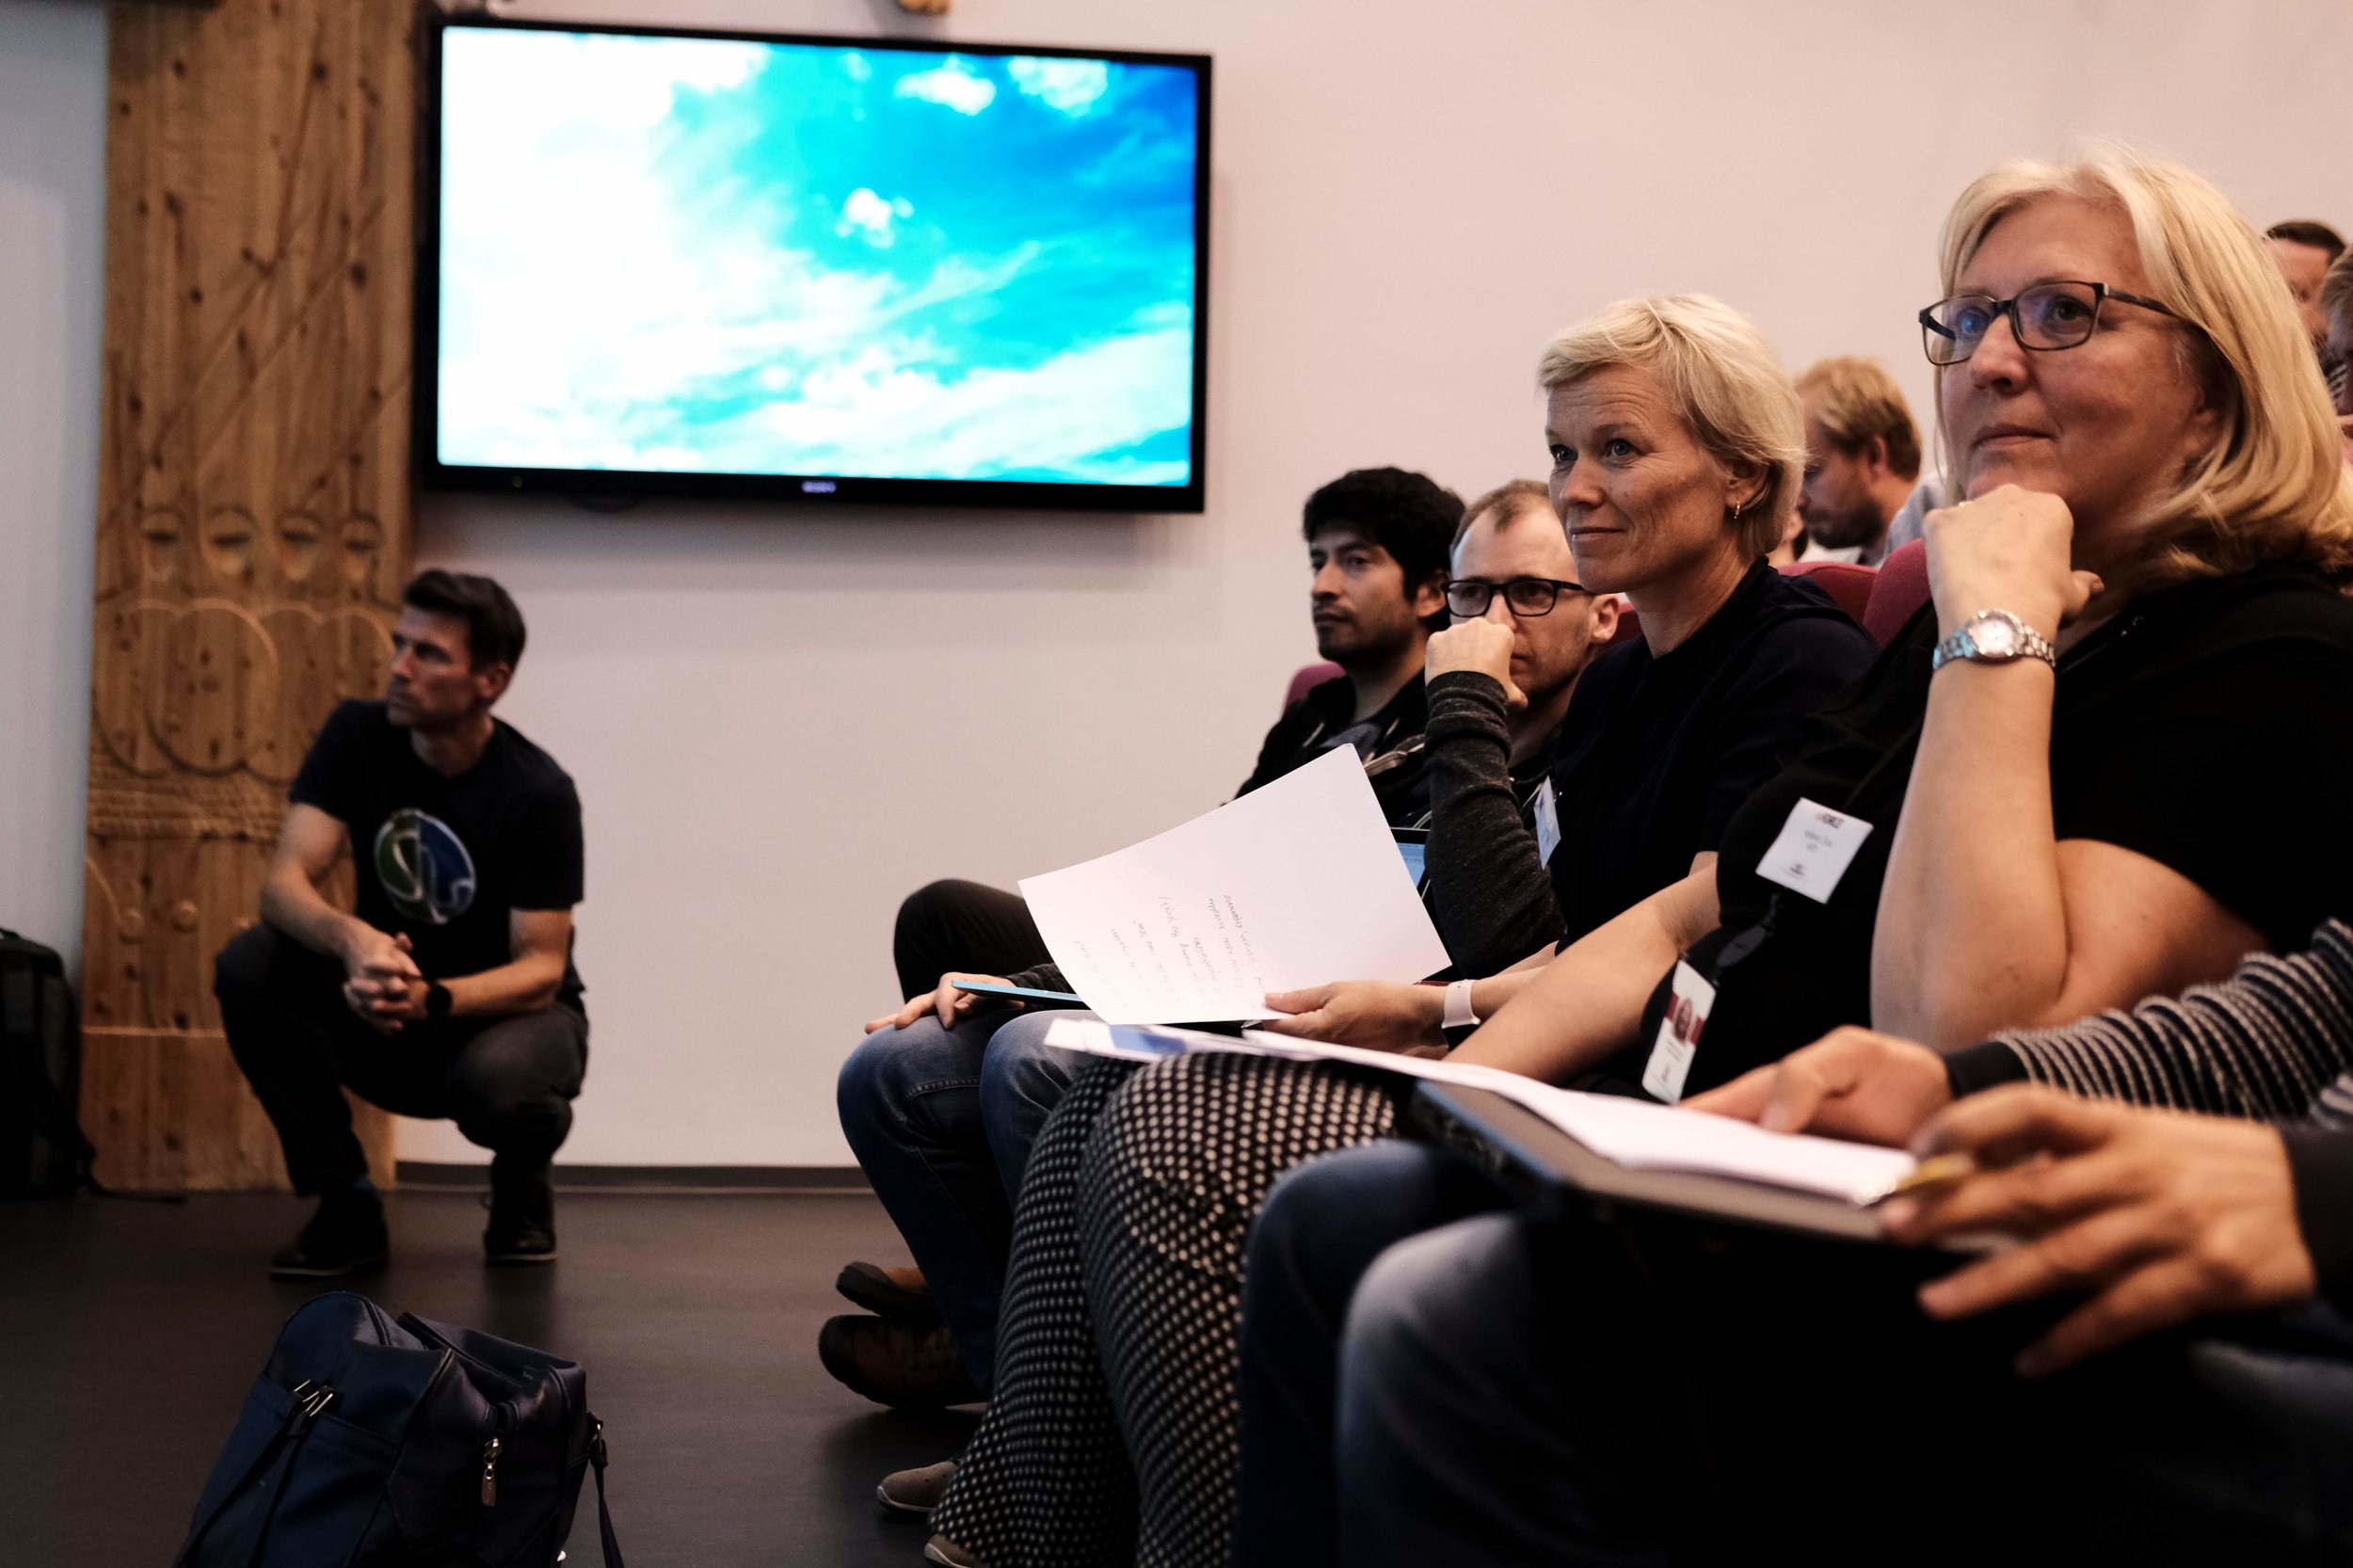
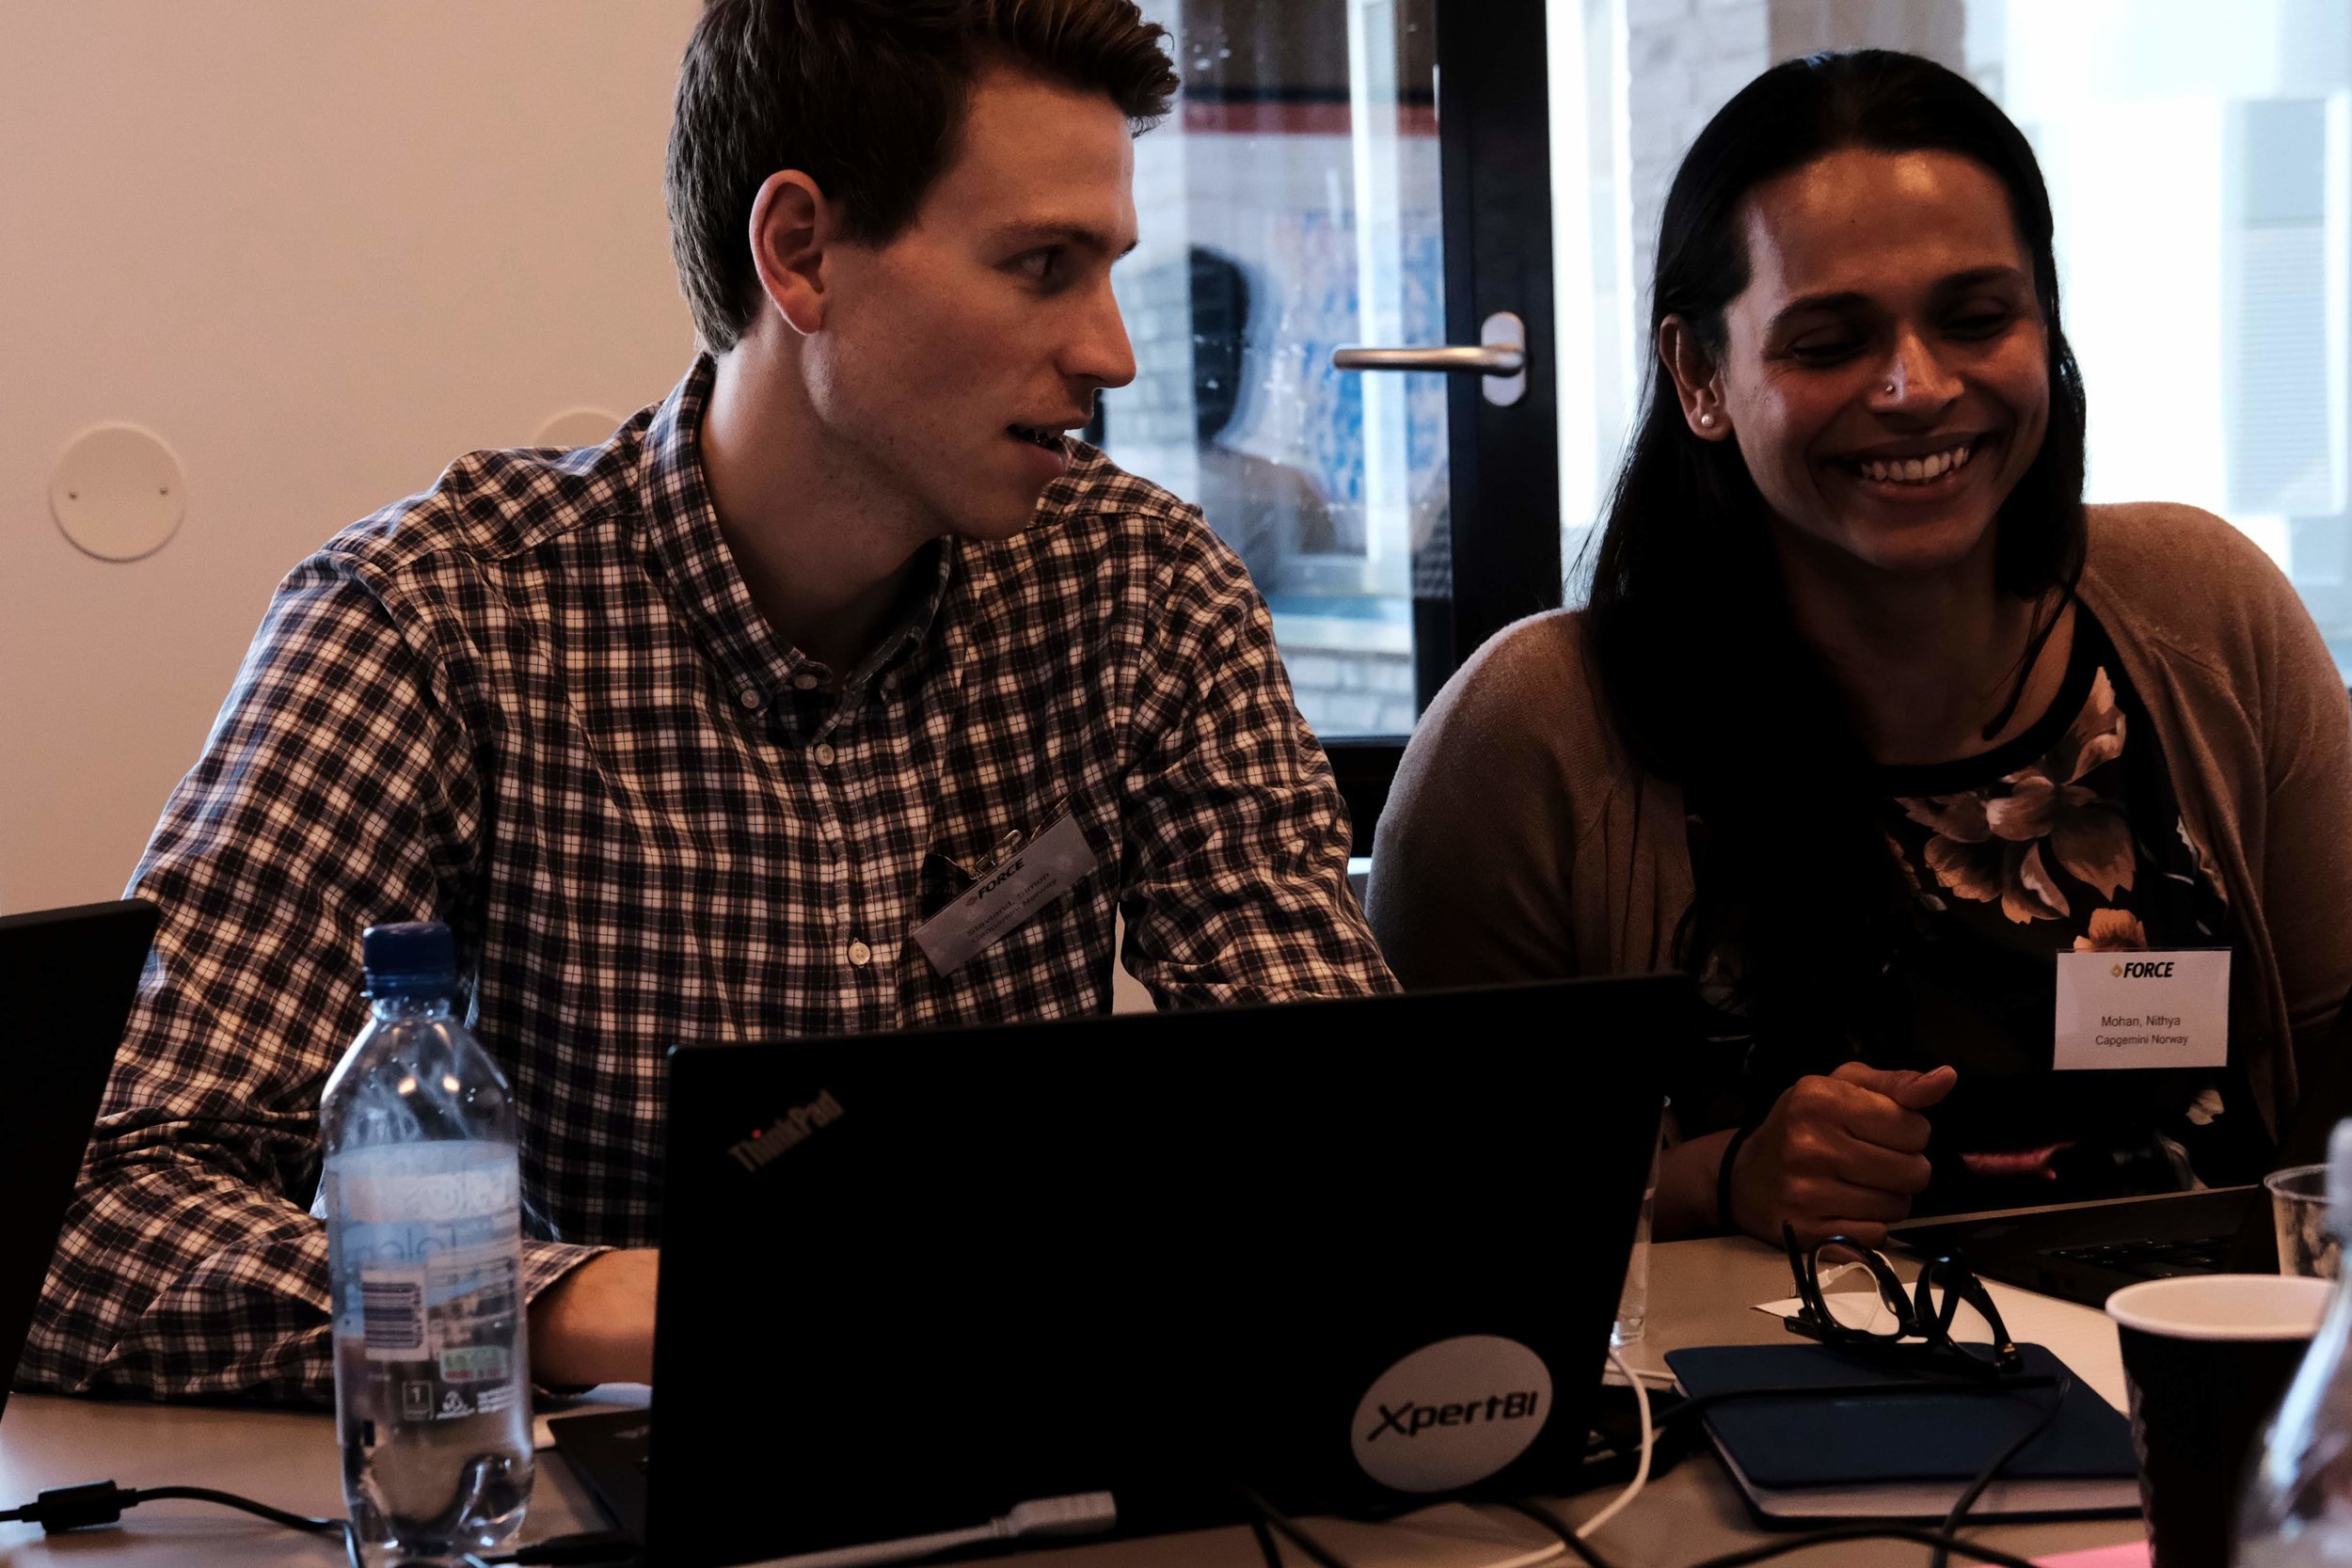
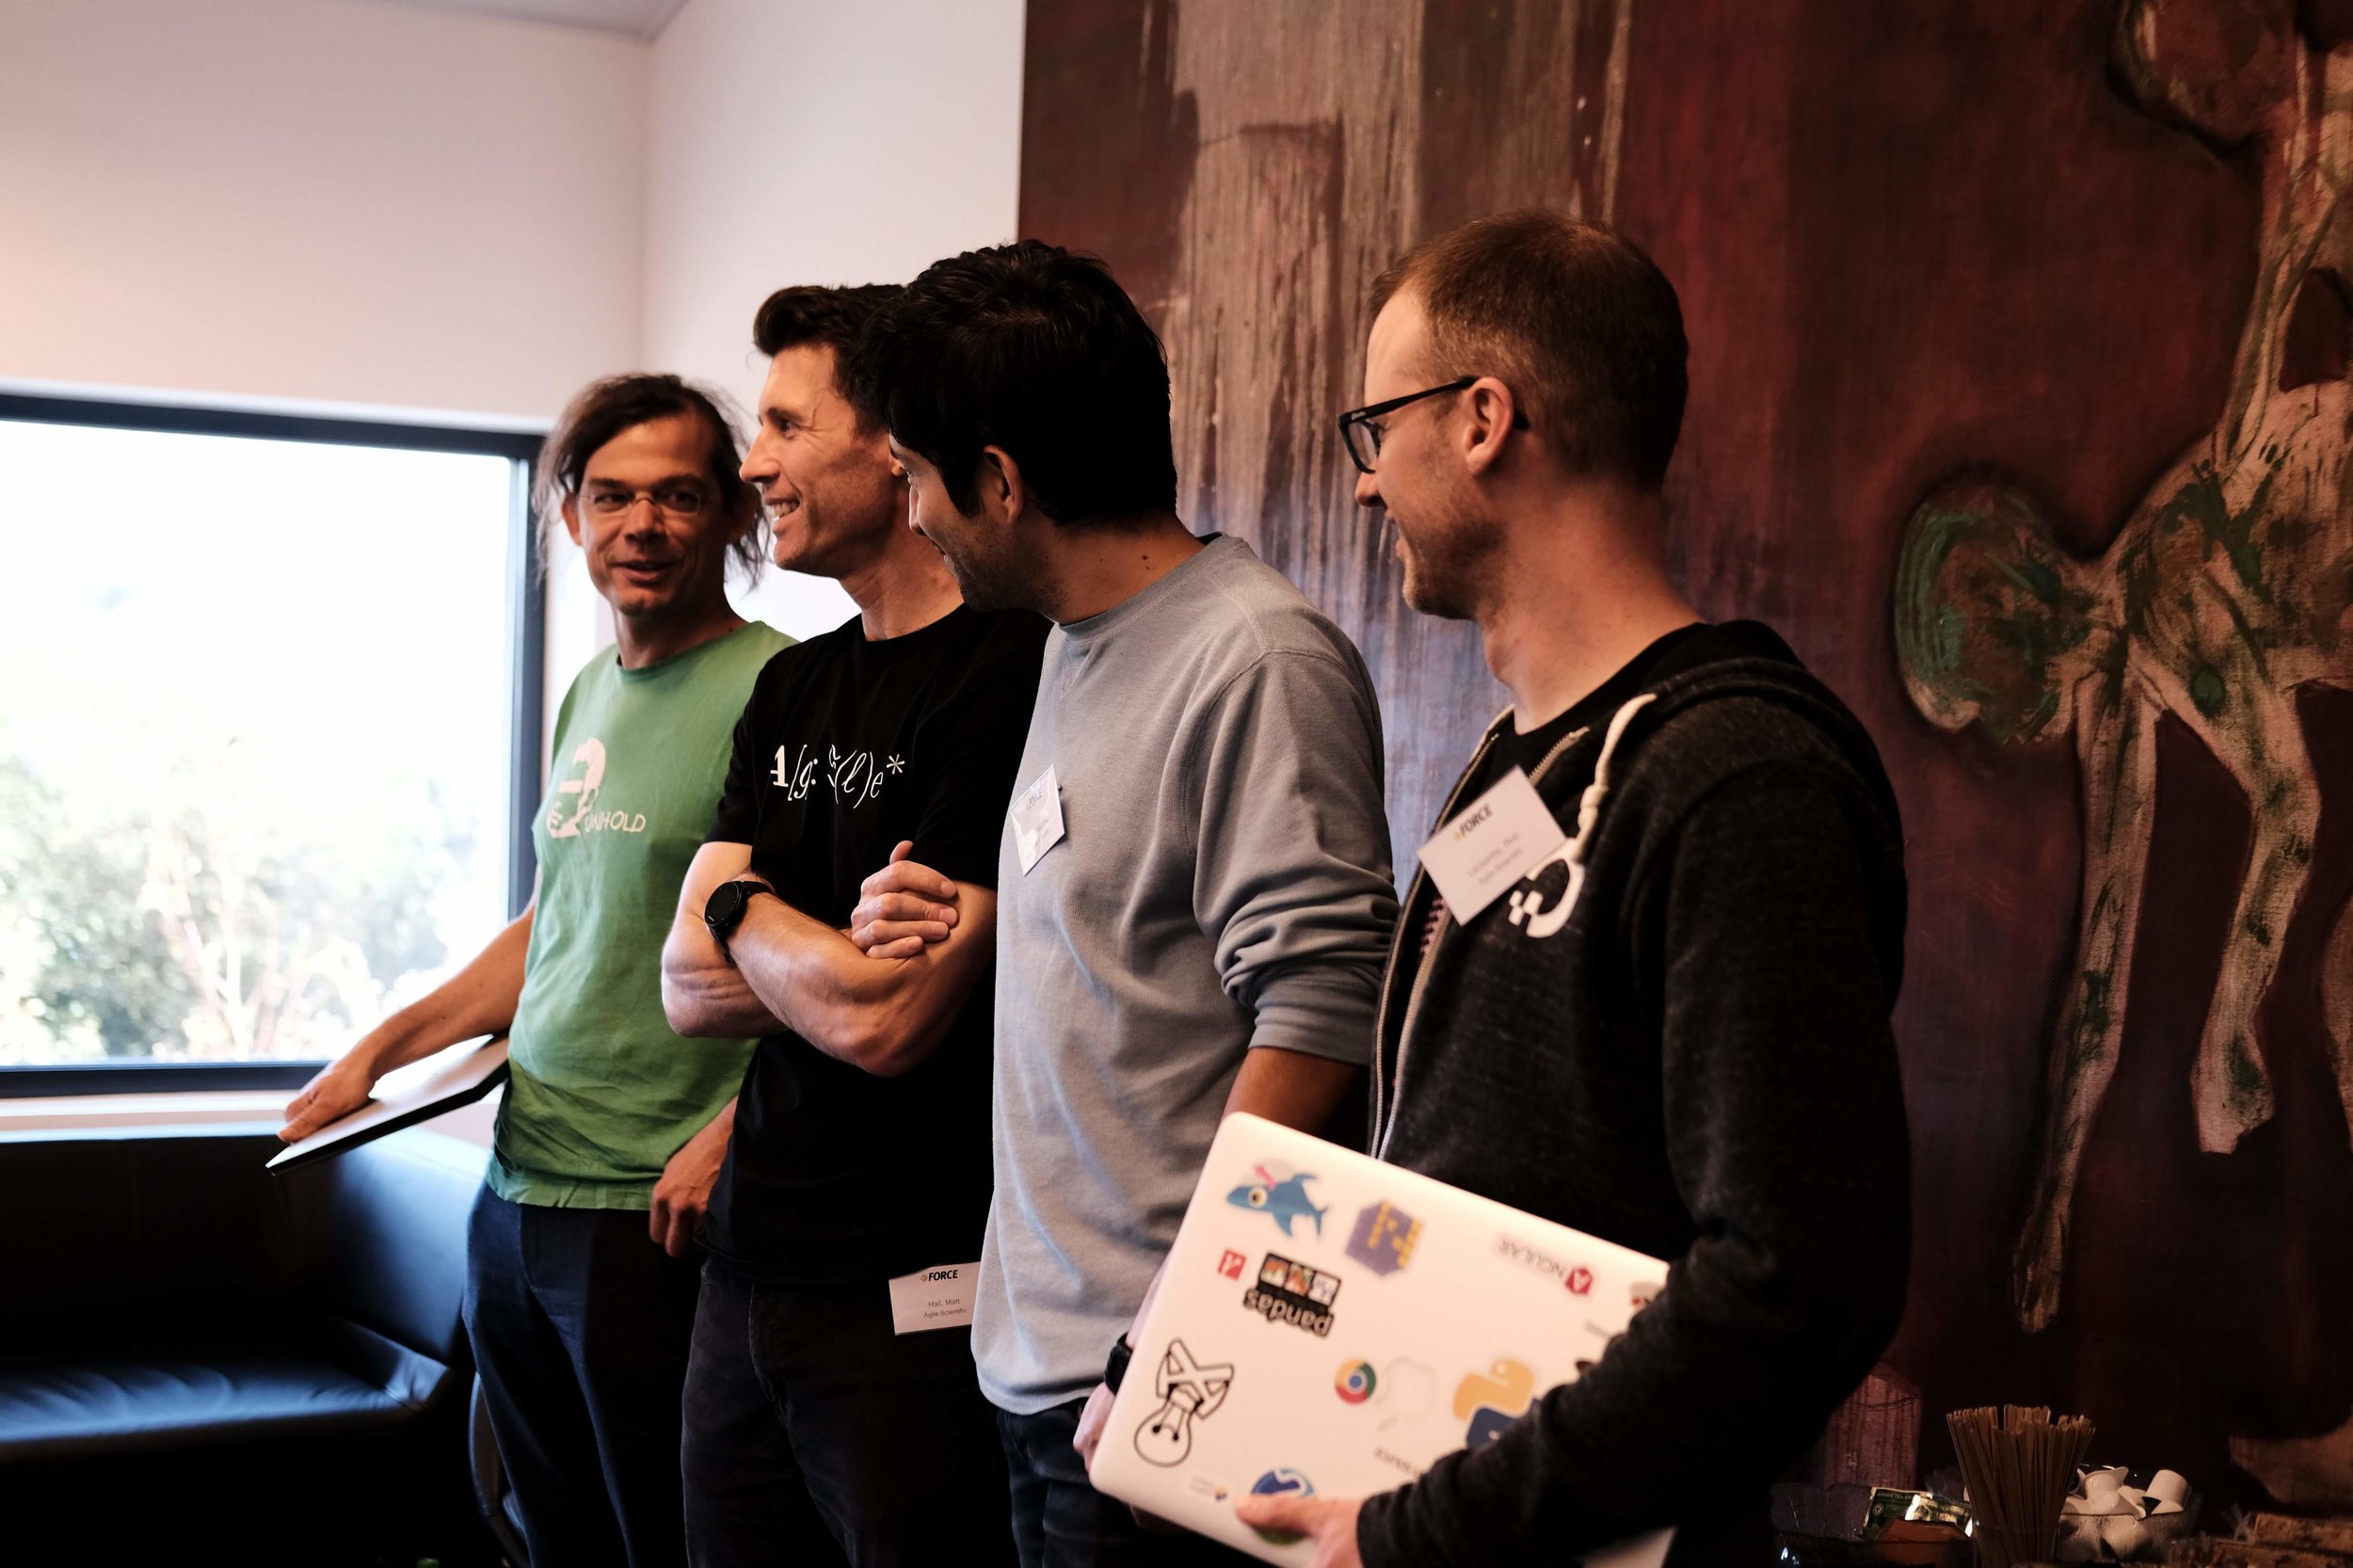
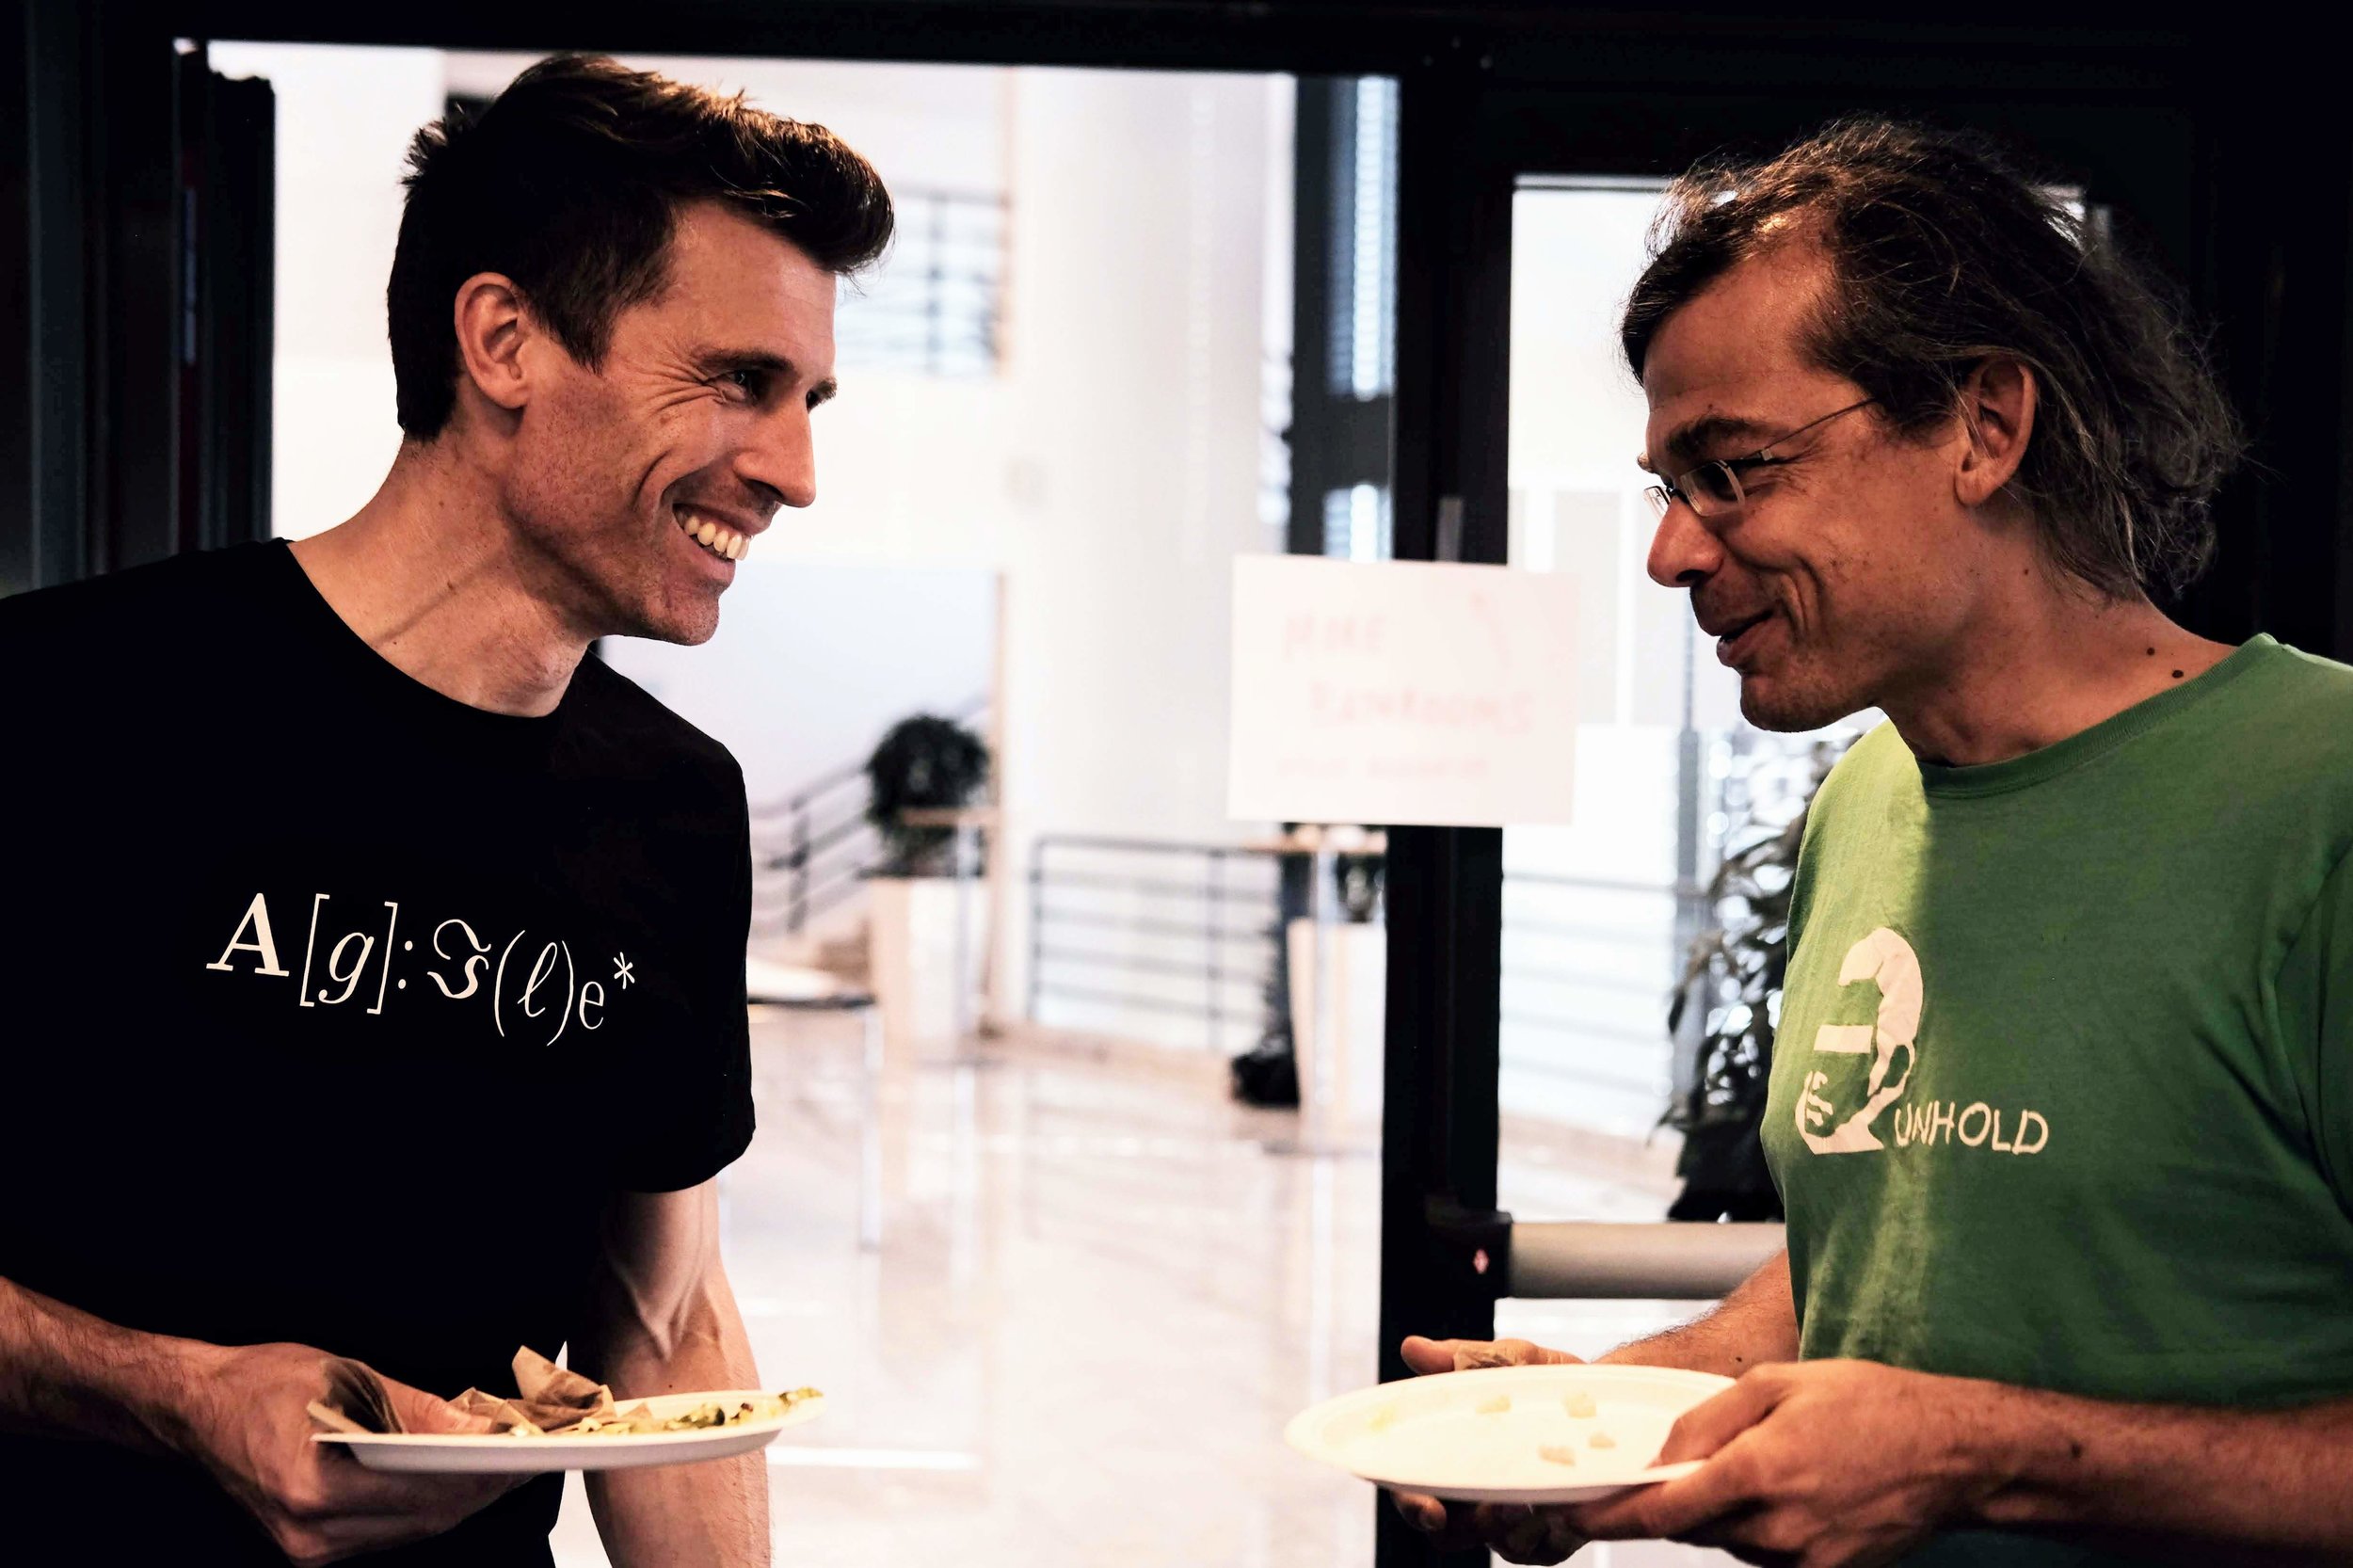
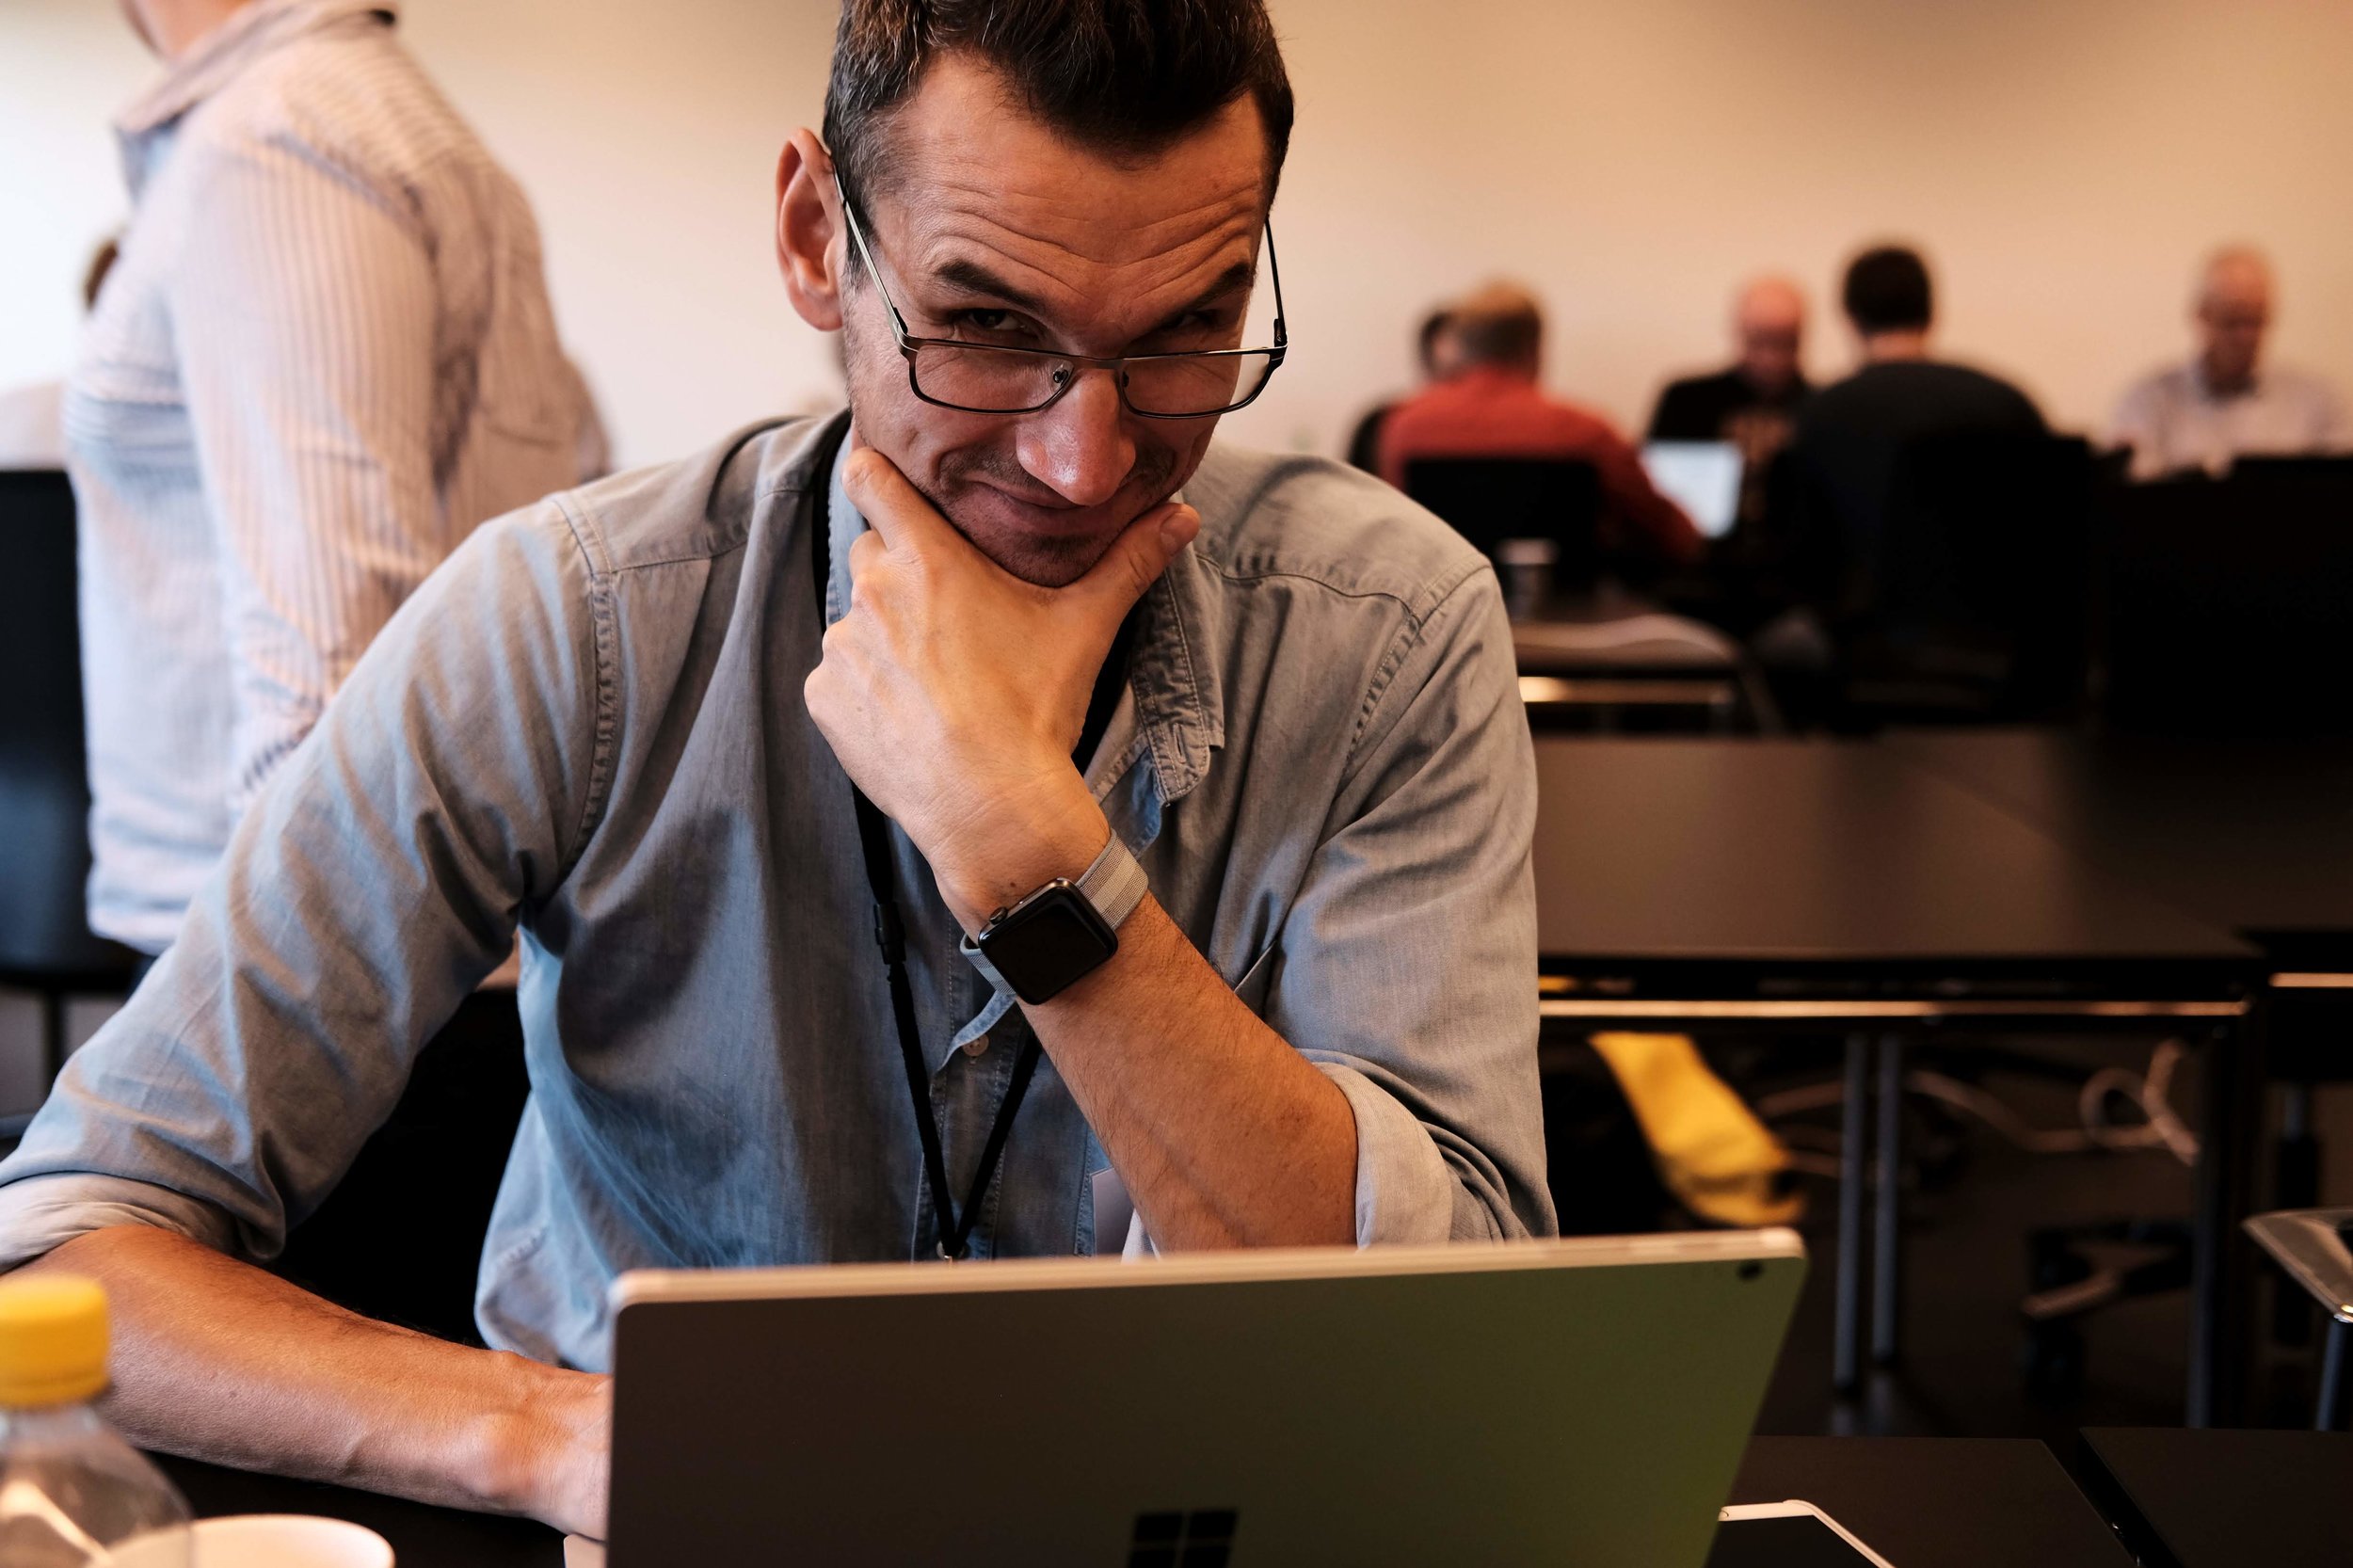
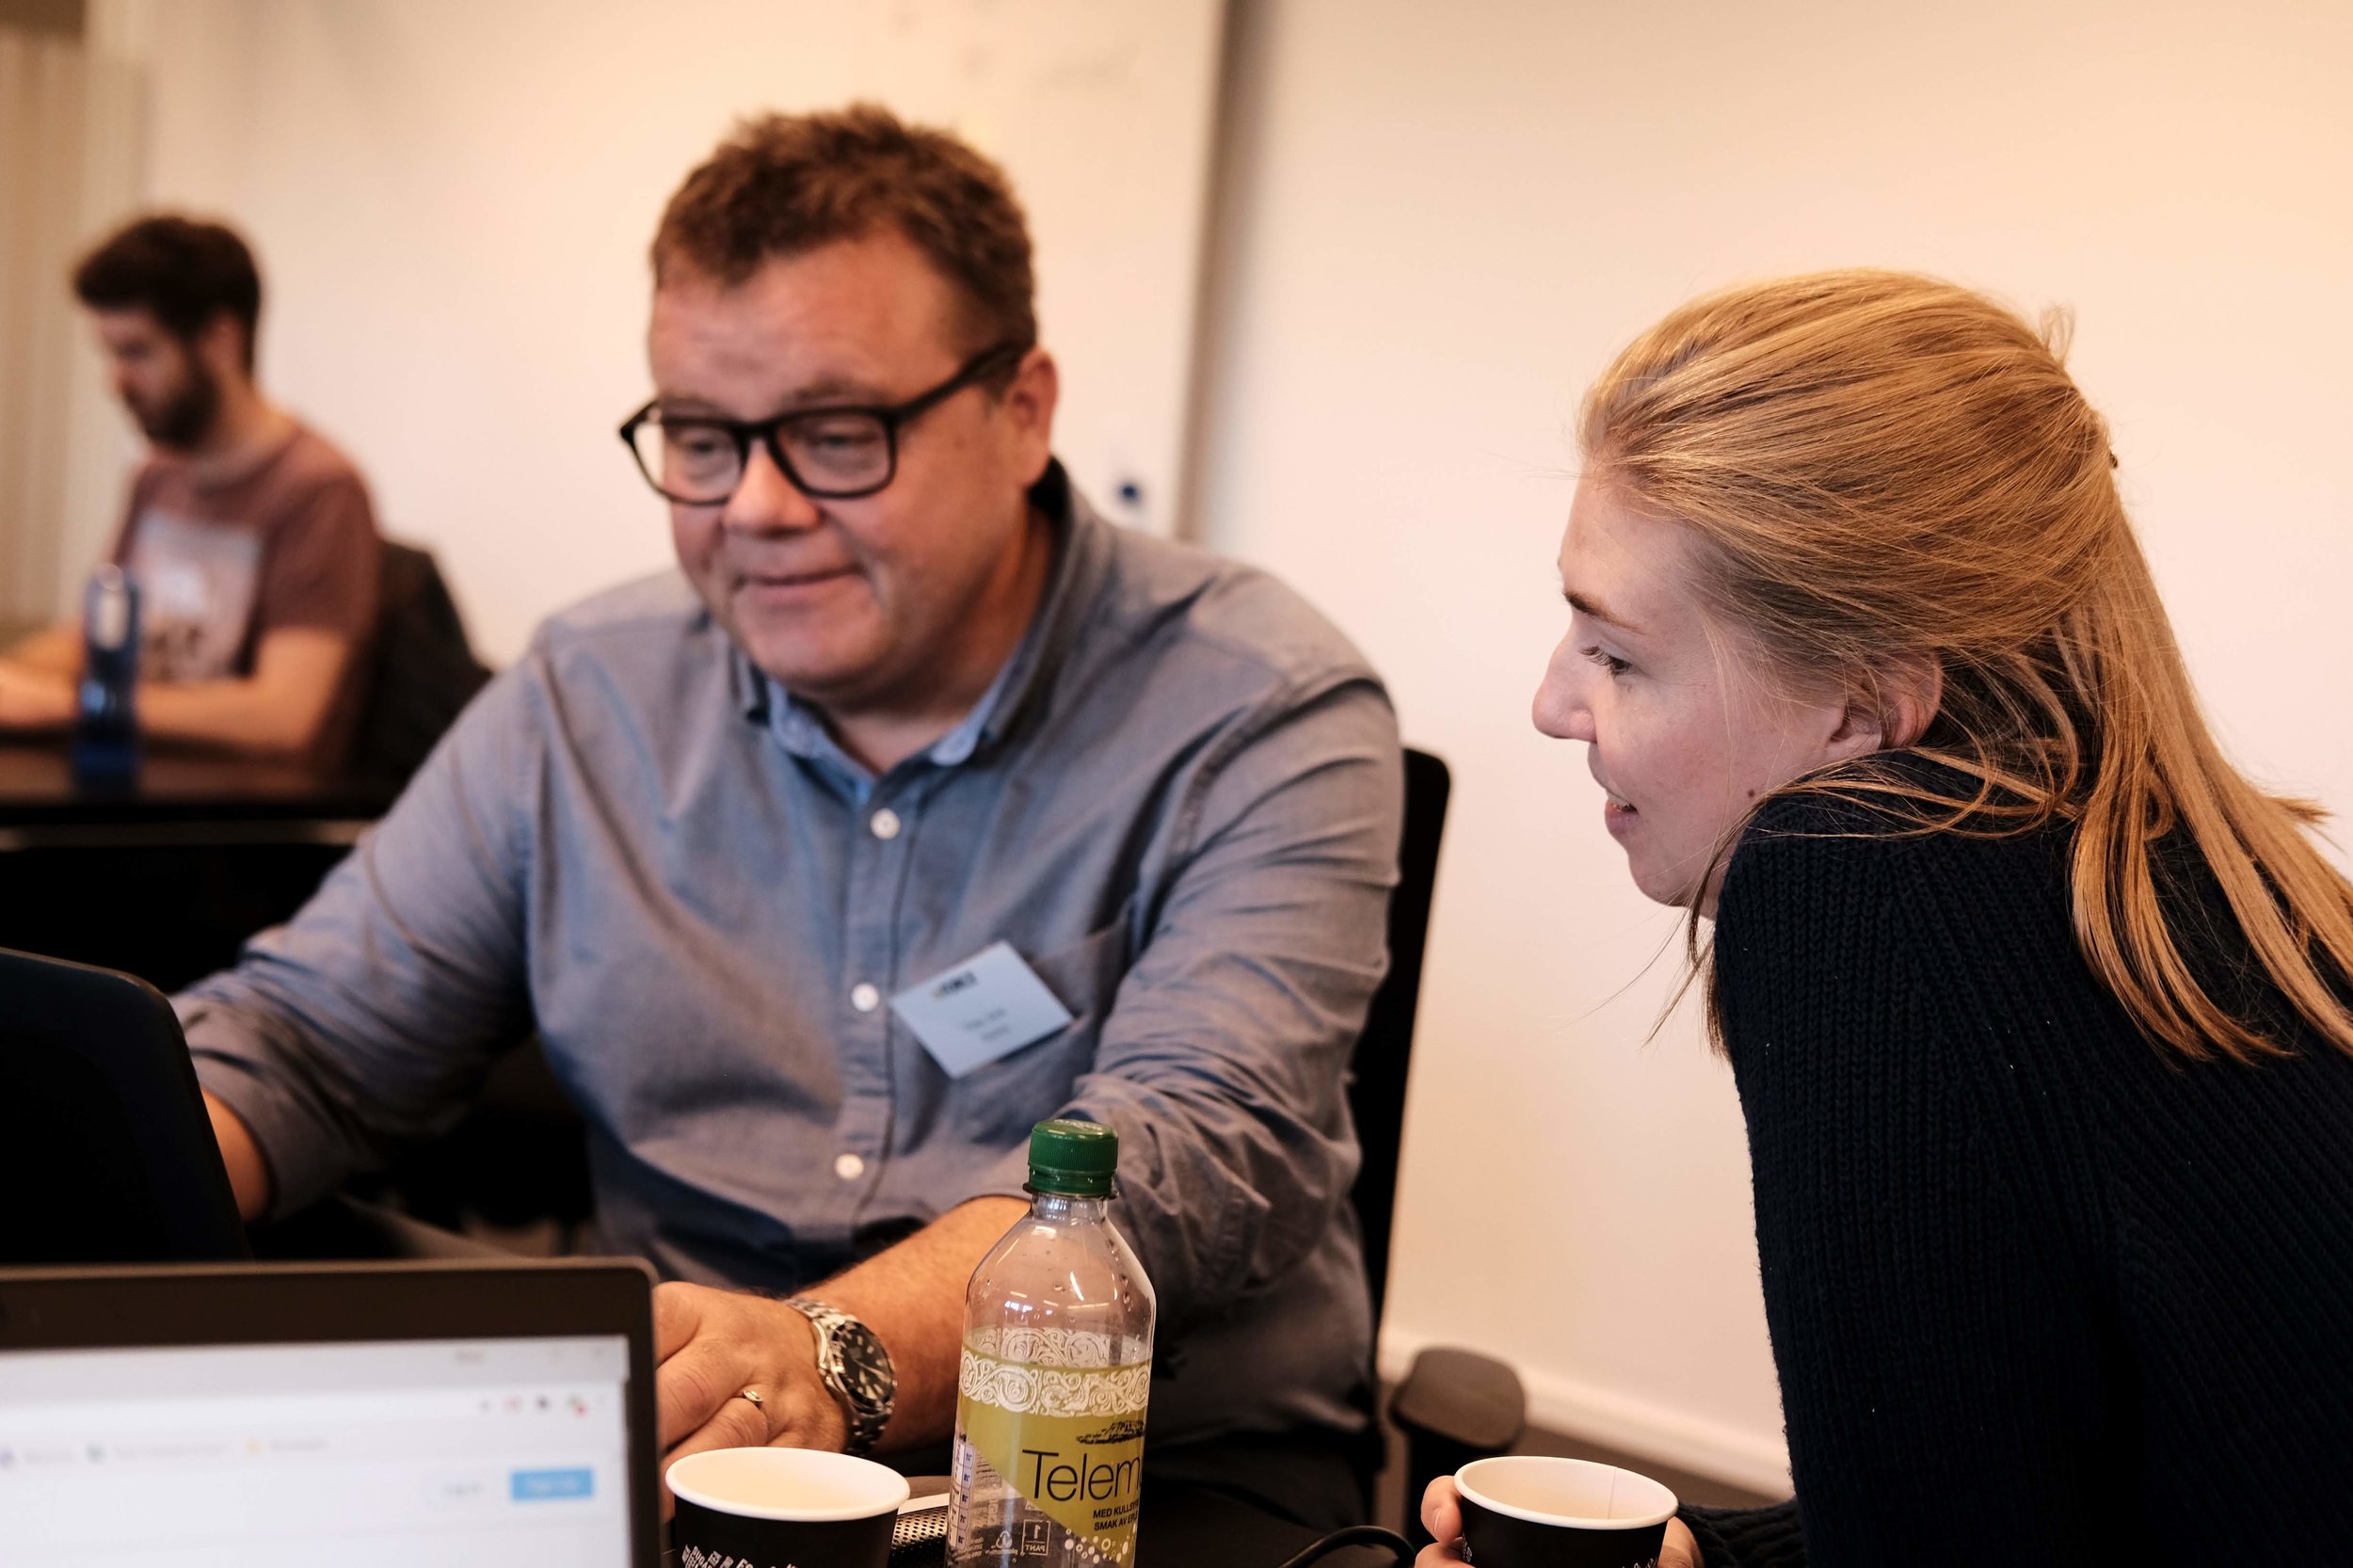
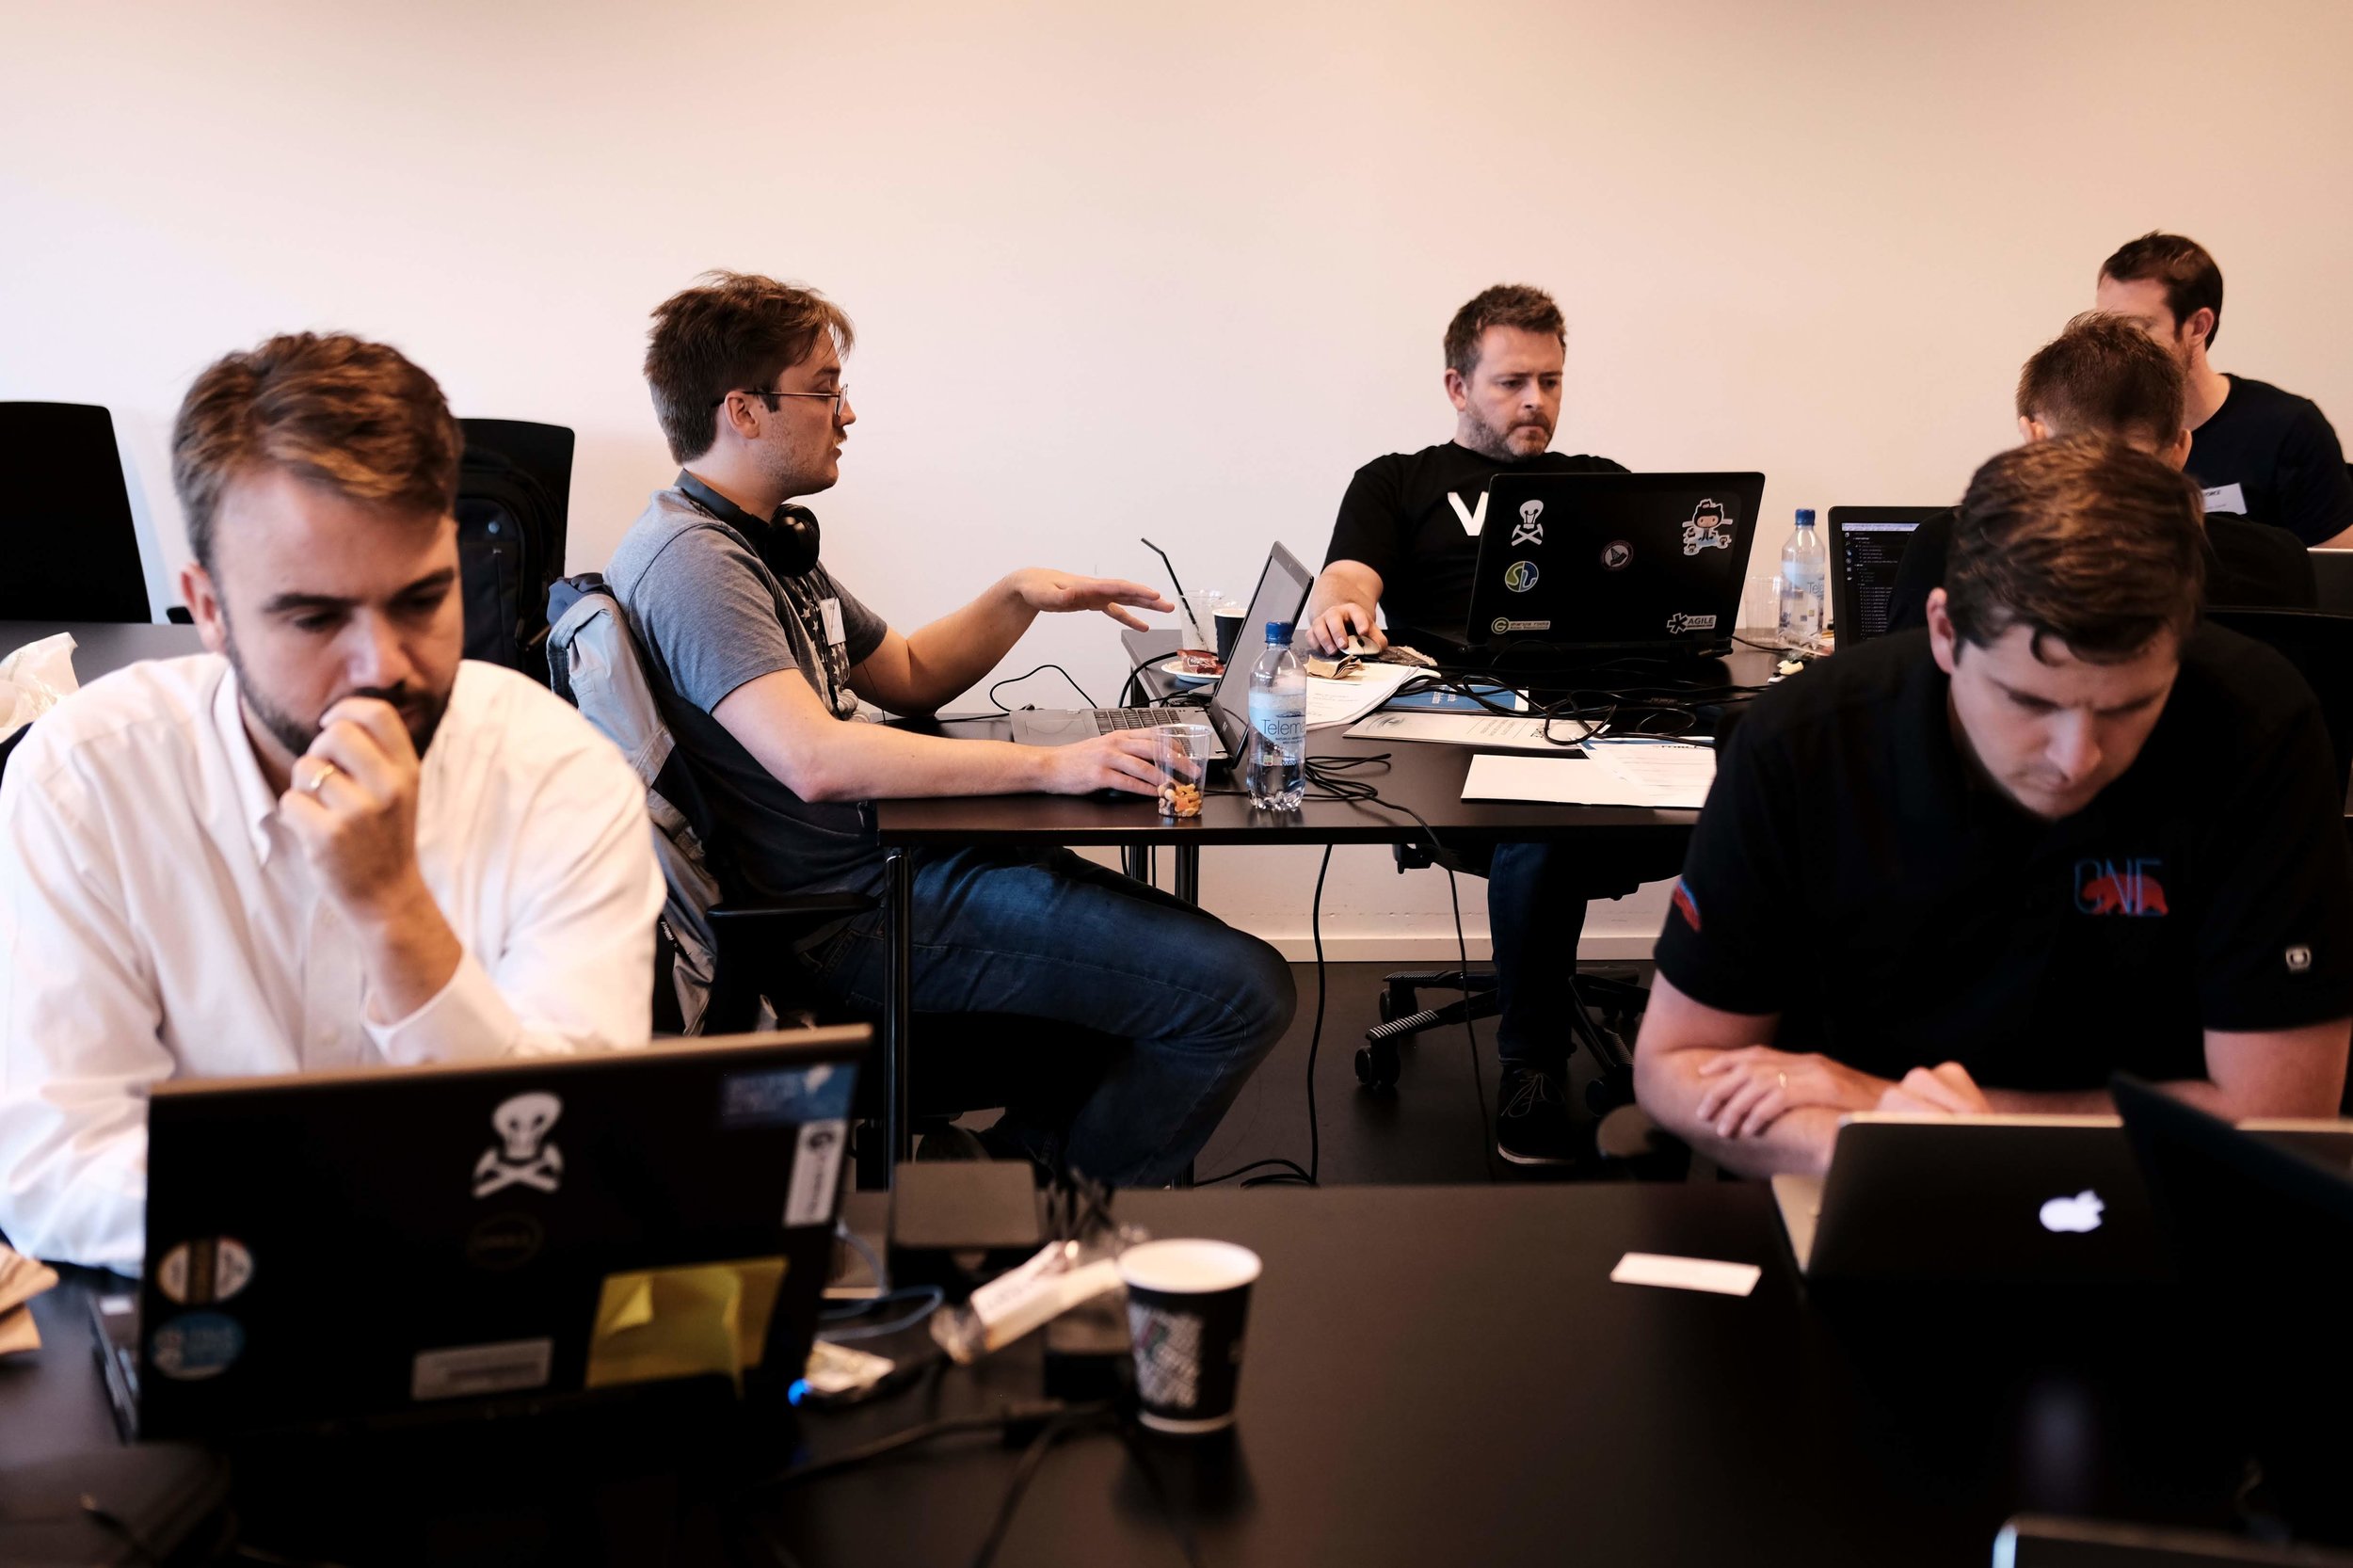
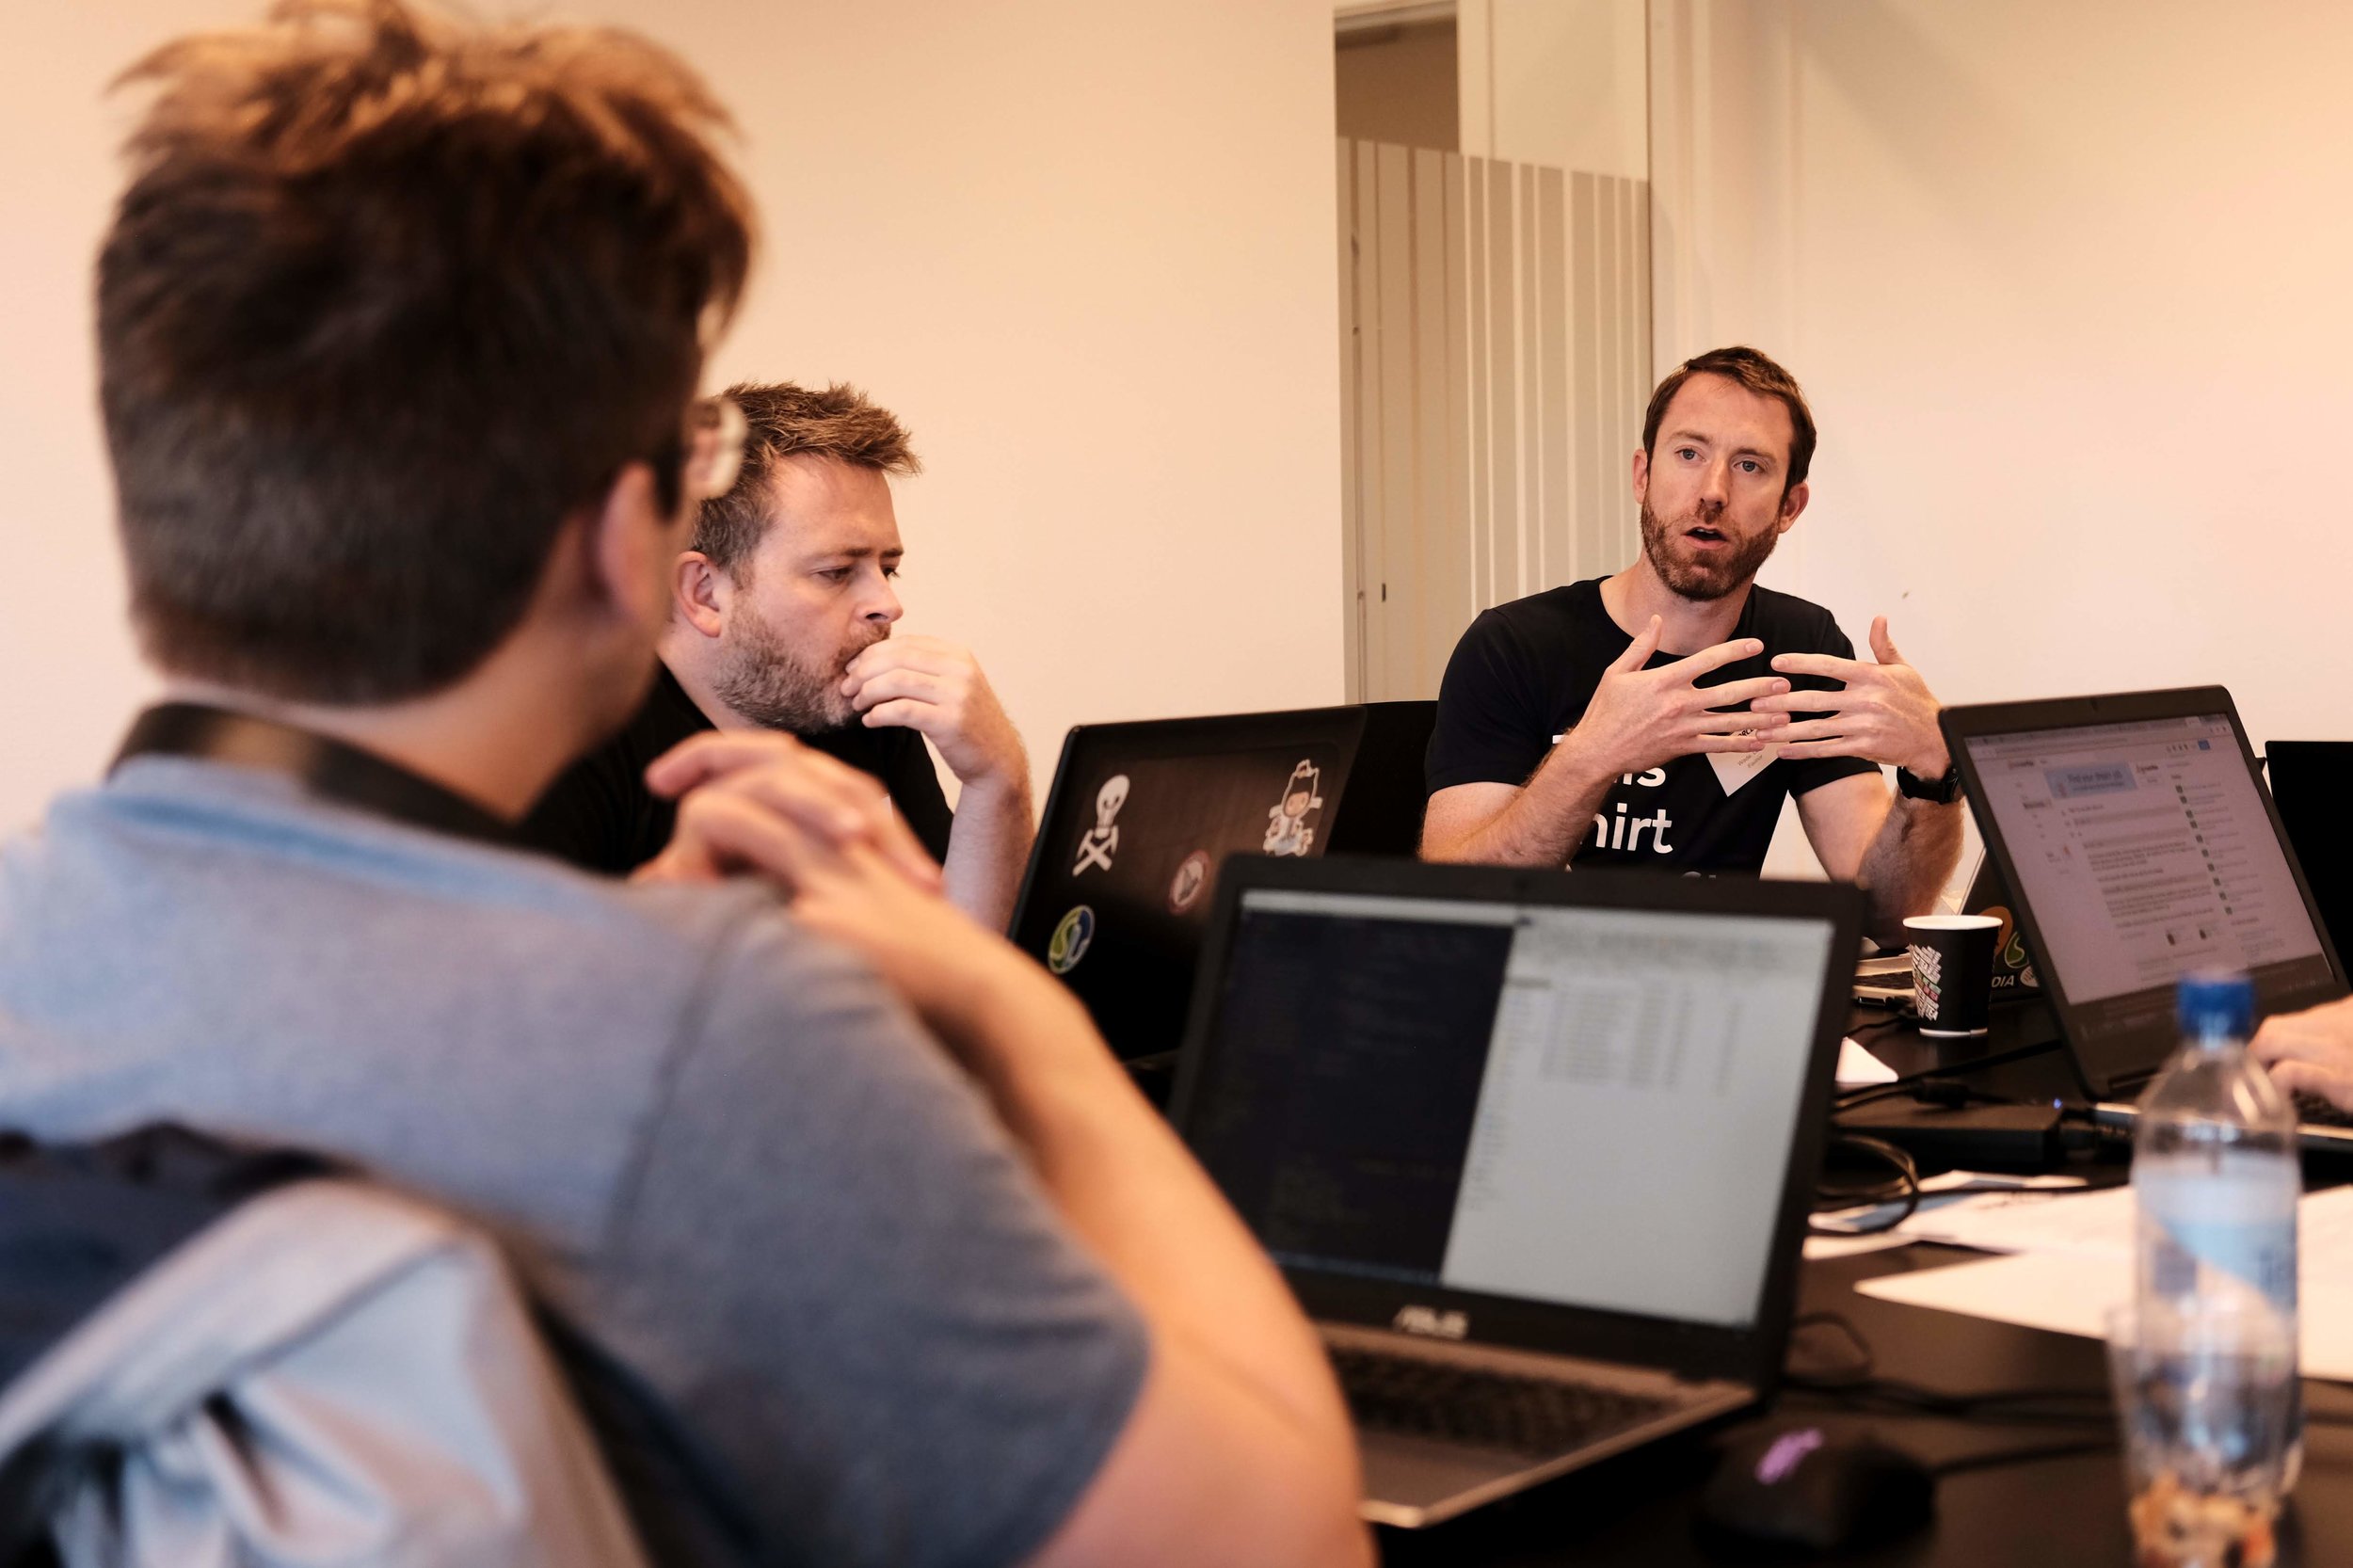
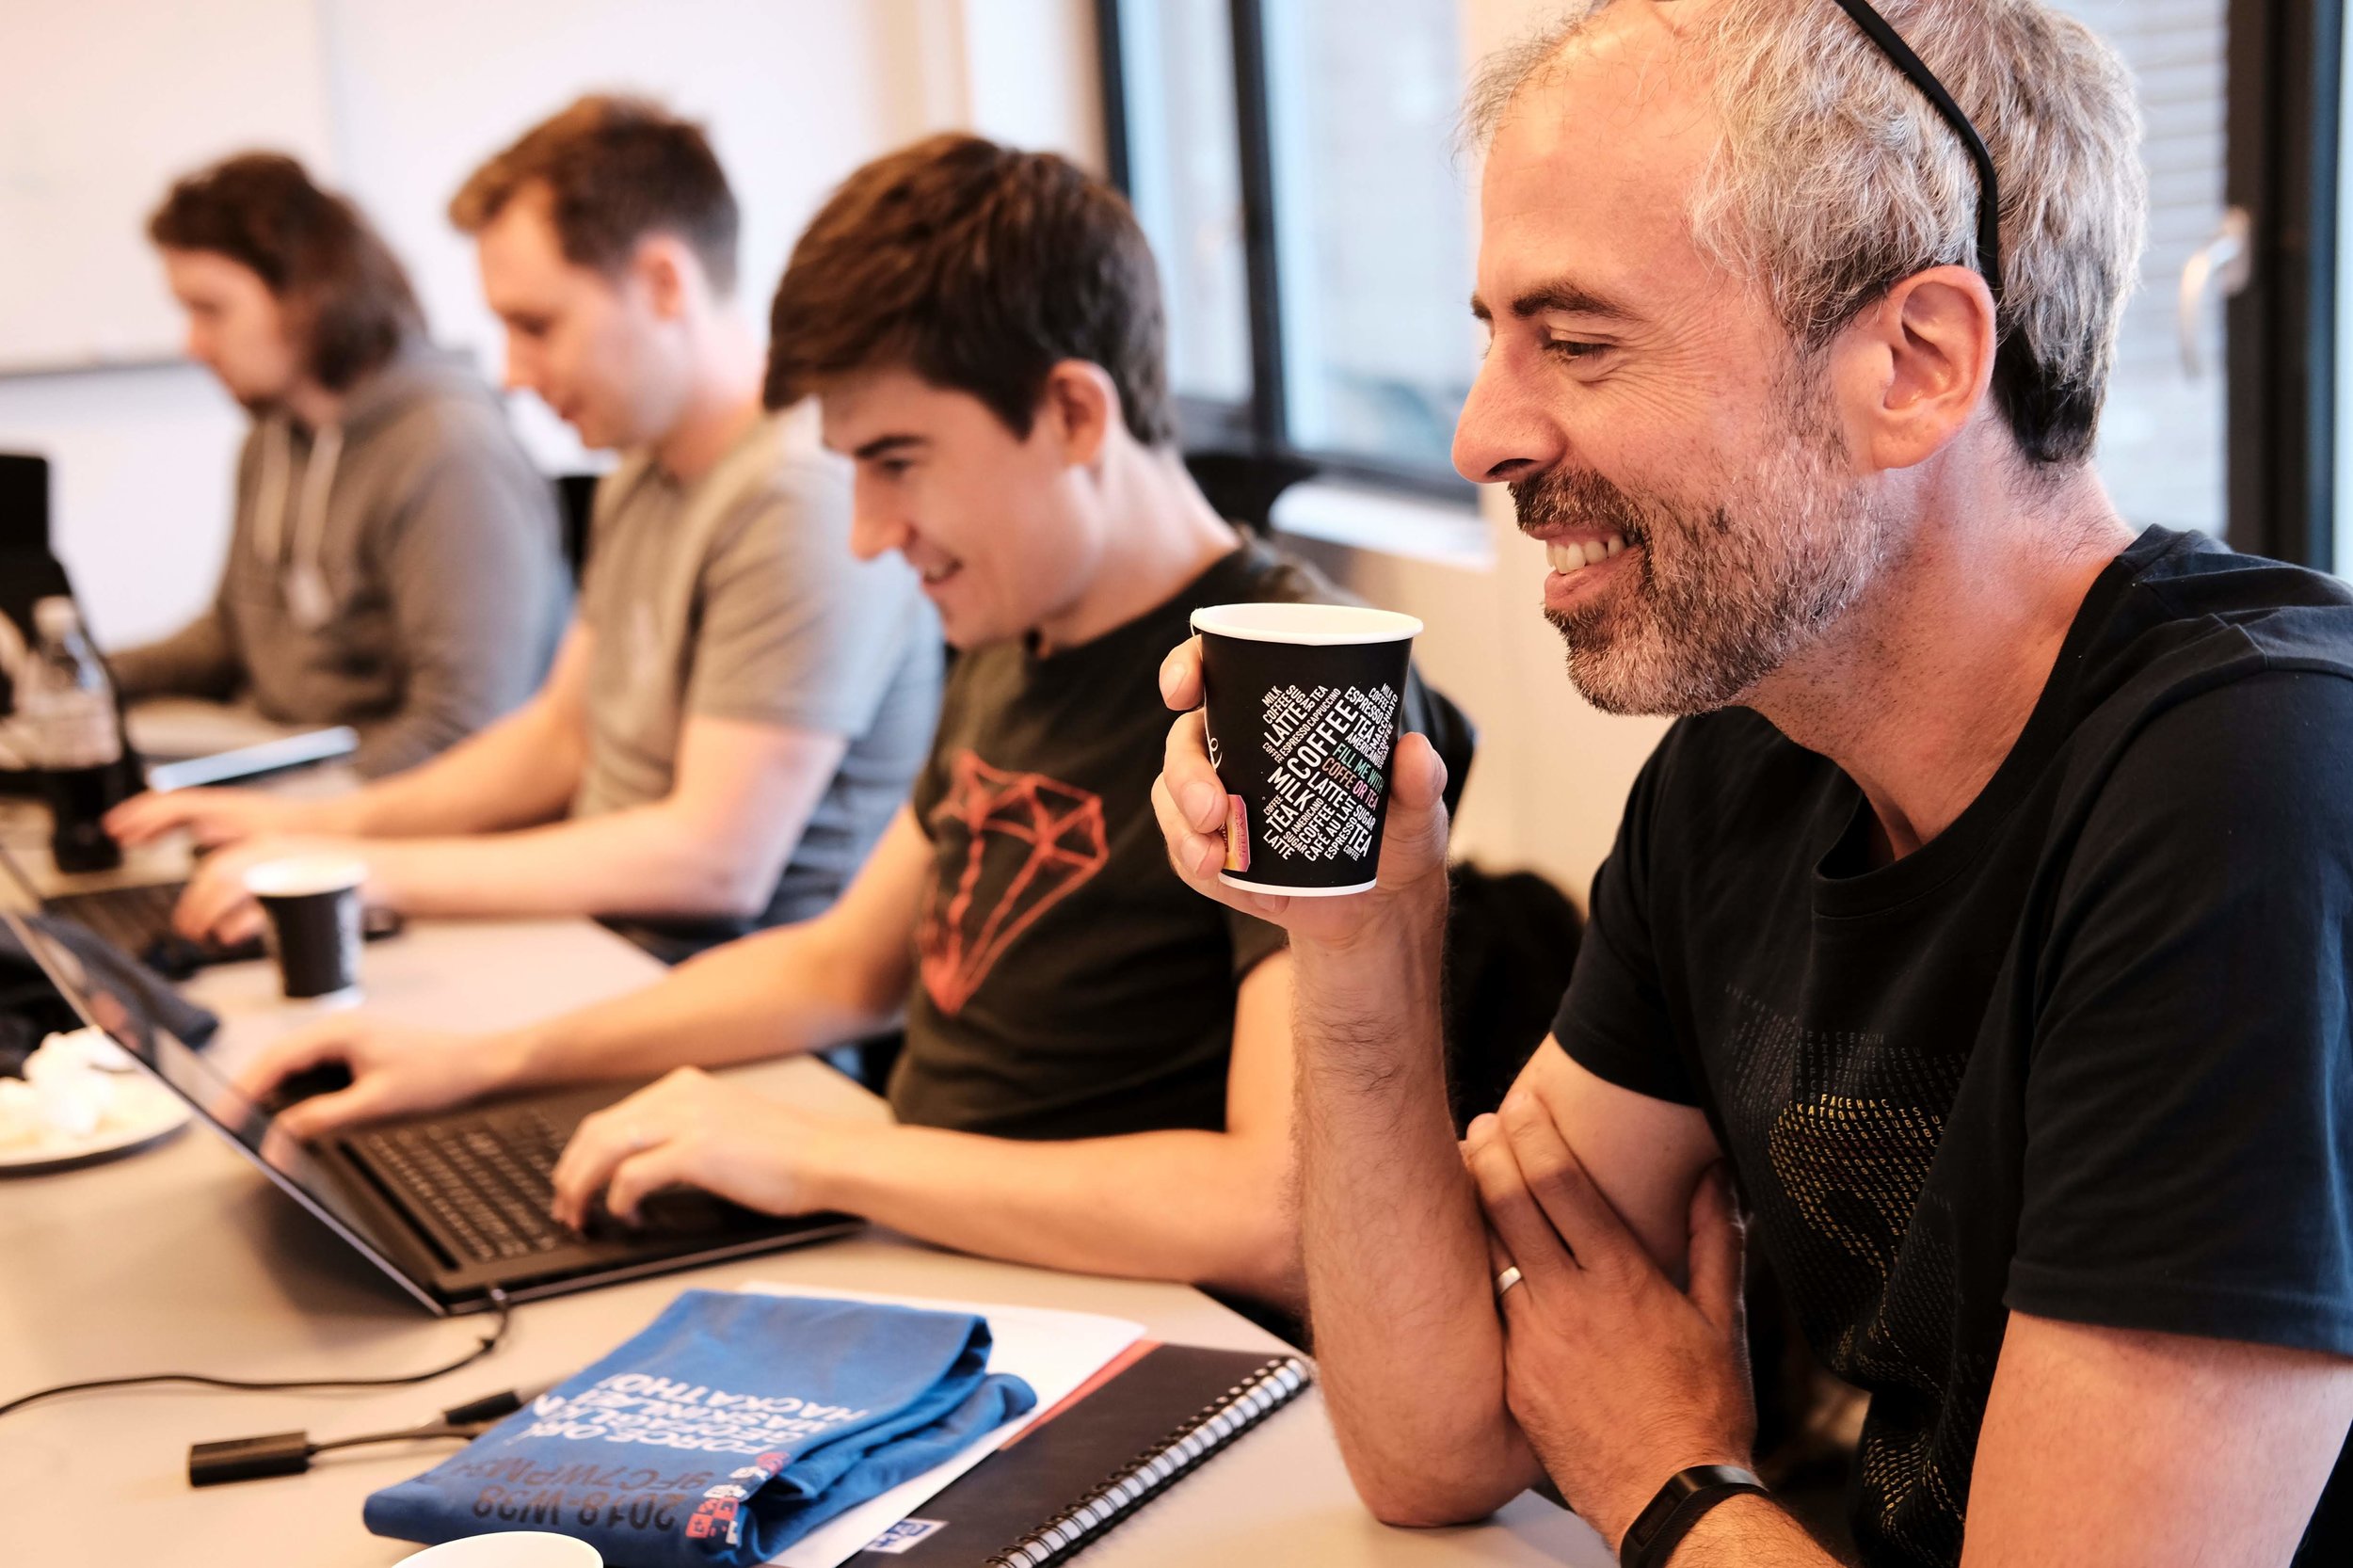
Thirty-seven digital geoscientists participated in the event at Robert Gordon University; most of them appear below. Many of them had not coded at all before the bootcamp on Friday, so a lot of people were well outside their comfort zones when we sat down on Saturday. Kudos to everyone!

The projects included the usual mix of seismic-based tasks, automated well log picking, a bit of natural language processing, some geospatial processing, and seals (of the mammalian variety). Here’s a rundown of what people got up to:


Counting seals on Scottish islands

Seal Team 6: Julien Moreau, James Mullins, Alex Schaaf, Balazs Kertesz, Hassan Tolba, Tom Buckley.

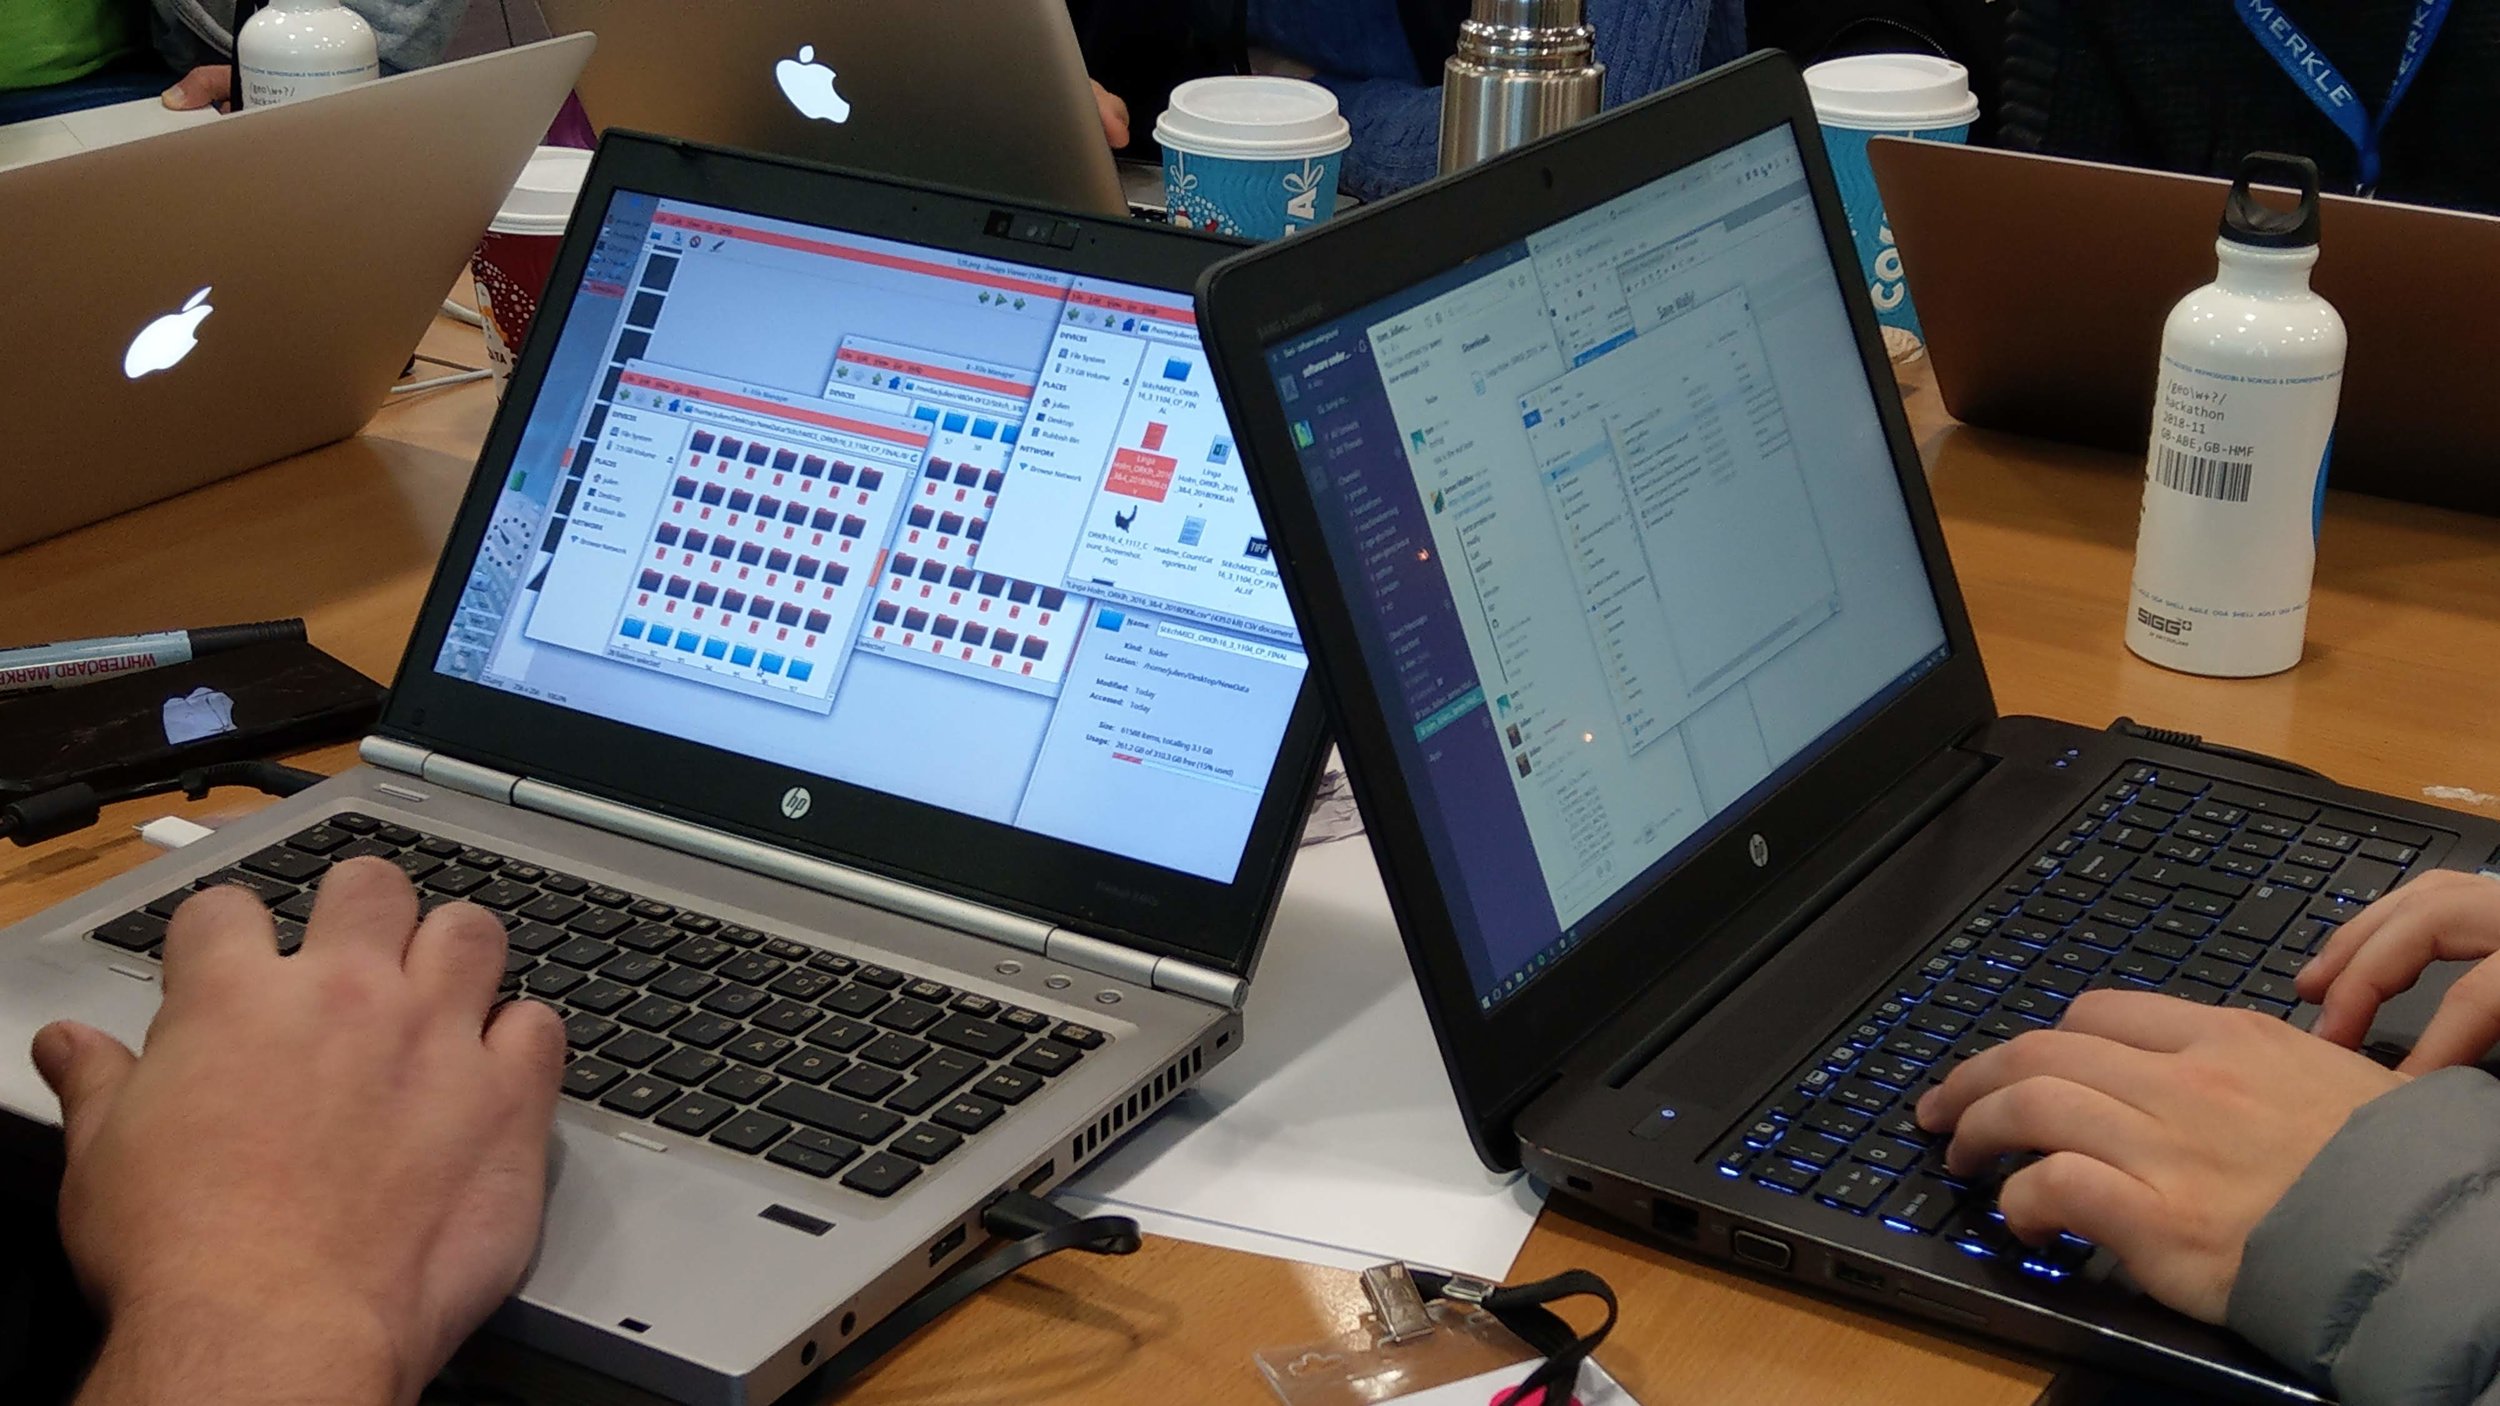
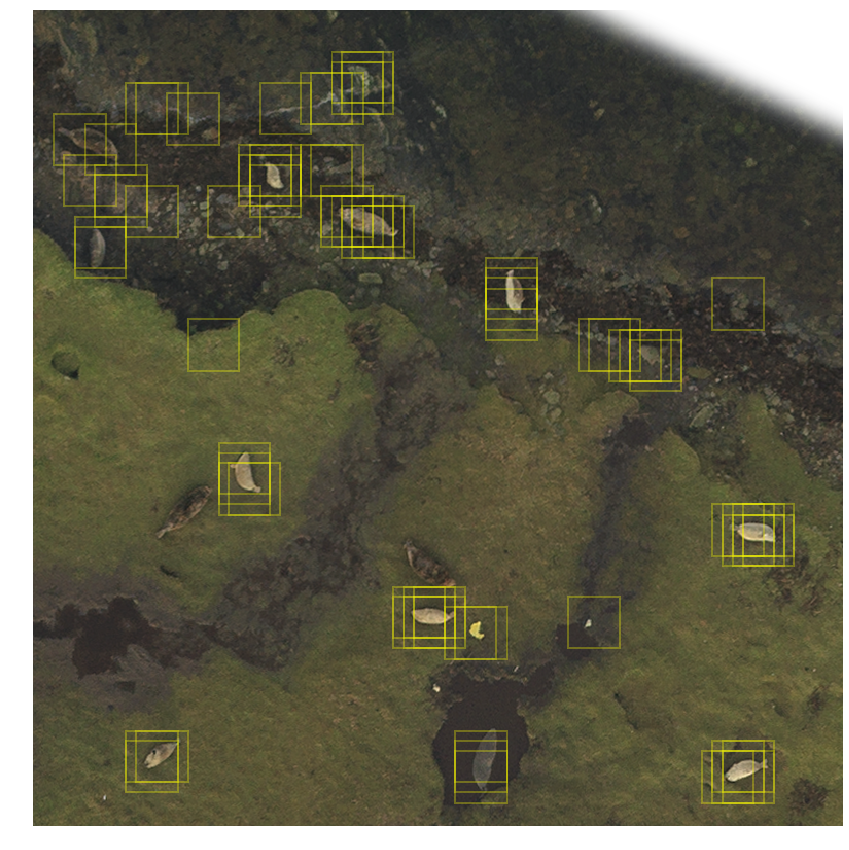
Project: Julien arrived with a cool dataset: over 6000 seals located on two large TIFFs images of Linga Holm, an island off Stronsay in the Orkneys. The challenge: locate the seals automatically. The team came up with a pipeline to generate HOG descriptors, train a support vector machine on about 20,000 labelled image tiles, then scan the large TIFFs to try to identify seals. Shown here is the output of one such scan, with a few false positive and false negatives. GitHub repo.

This project won the Most Impact award.

seals_test_image.png

Automatic classification of seismic sections

Team Seis Class: Jo Bagguley, Laura Bardsley, Chio Martinez, Peter Rowbotham, Mike Atkins, Niall Rowantree, James Beckwith.

Project: Can you tell if a section has been spectrally whitened? Or AGC’d? This team set out to attempt to teach a neural network the difference. As a first step, they reduced it to a binary classification problem, and showed 110 ‘final’ and 110 ‘raw’ lines from the OGA ESP 2D 2016 dataset to a convolutional neural net. The AI achieved an accuracy of 98% on this task. GitHub repro.

This project won recognition for a Job Well Done.


Why do get blocks relinquished?

Team Relinquishment Surprise: Tanya Knowles, Obiamaka Agbaneje, Kachalla Aliyuda, Daniel Camacho, David Wilkinson (not pictured).

Project: Recognizing the vast trove of latent information locked up in the several thousand reports submitted to the OGA. Despite focusing on relinquishment, they quickly discovered that most of the task is to cope with the heterogeneity of the dataset, but they did manage to extract term frequencies from the various Conclusions sections, and made an ArcGIS web app to map them.

relinquishment_team.jpg

Recognizing reflection styles on seismic

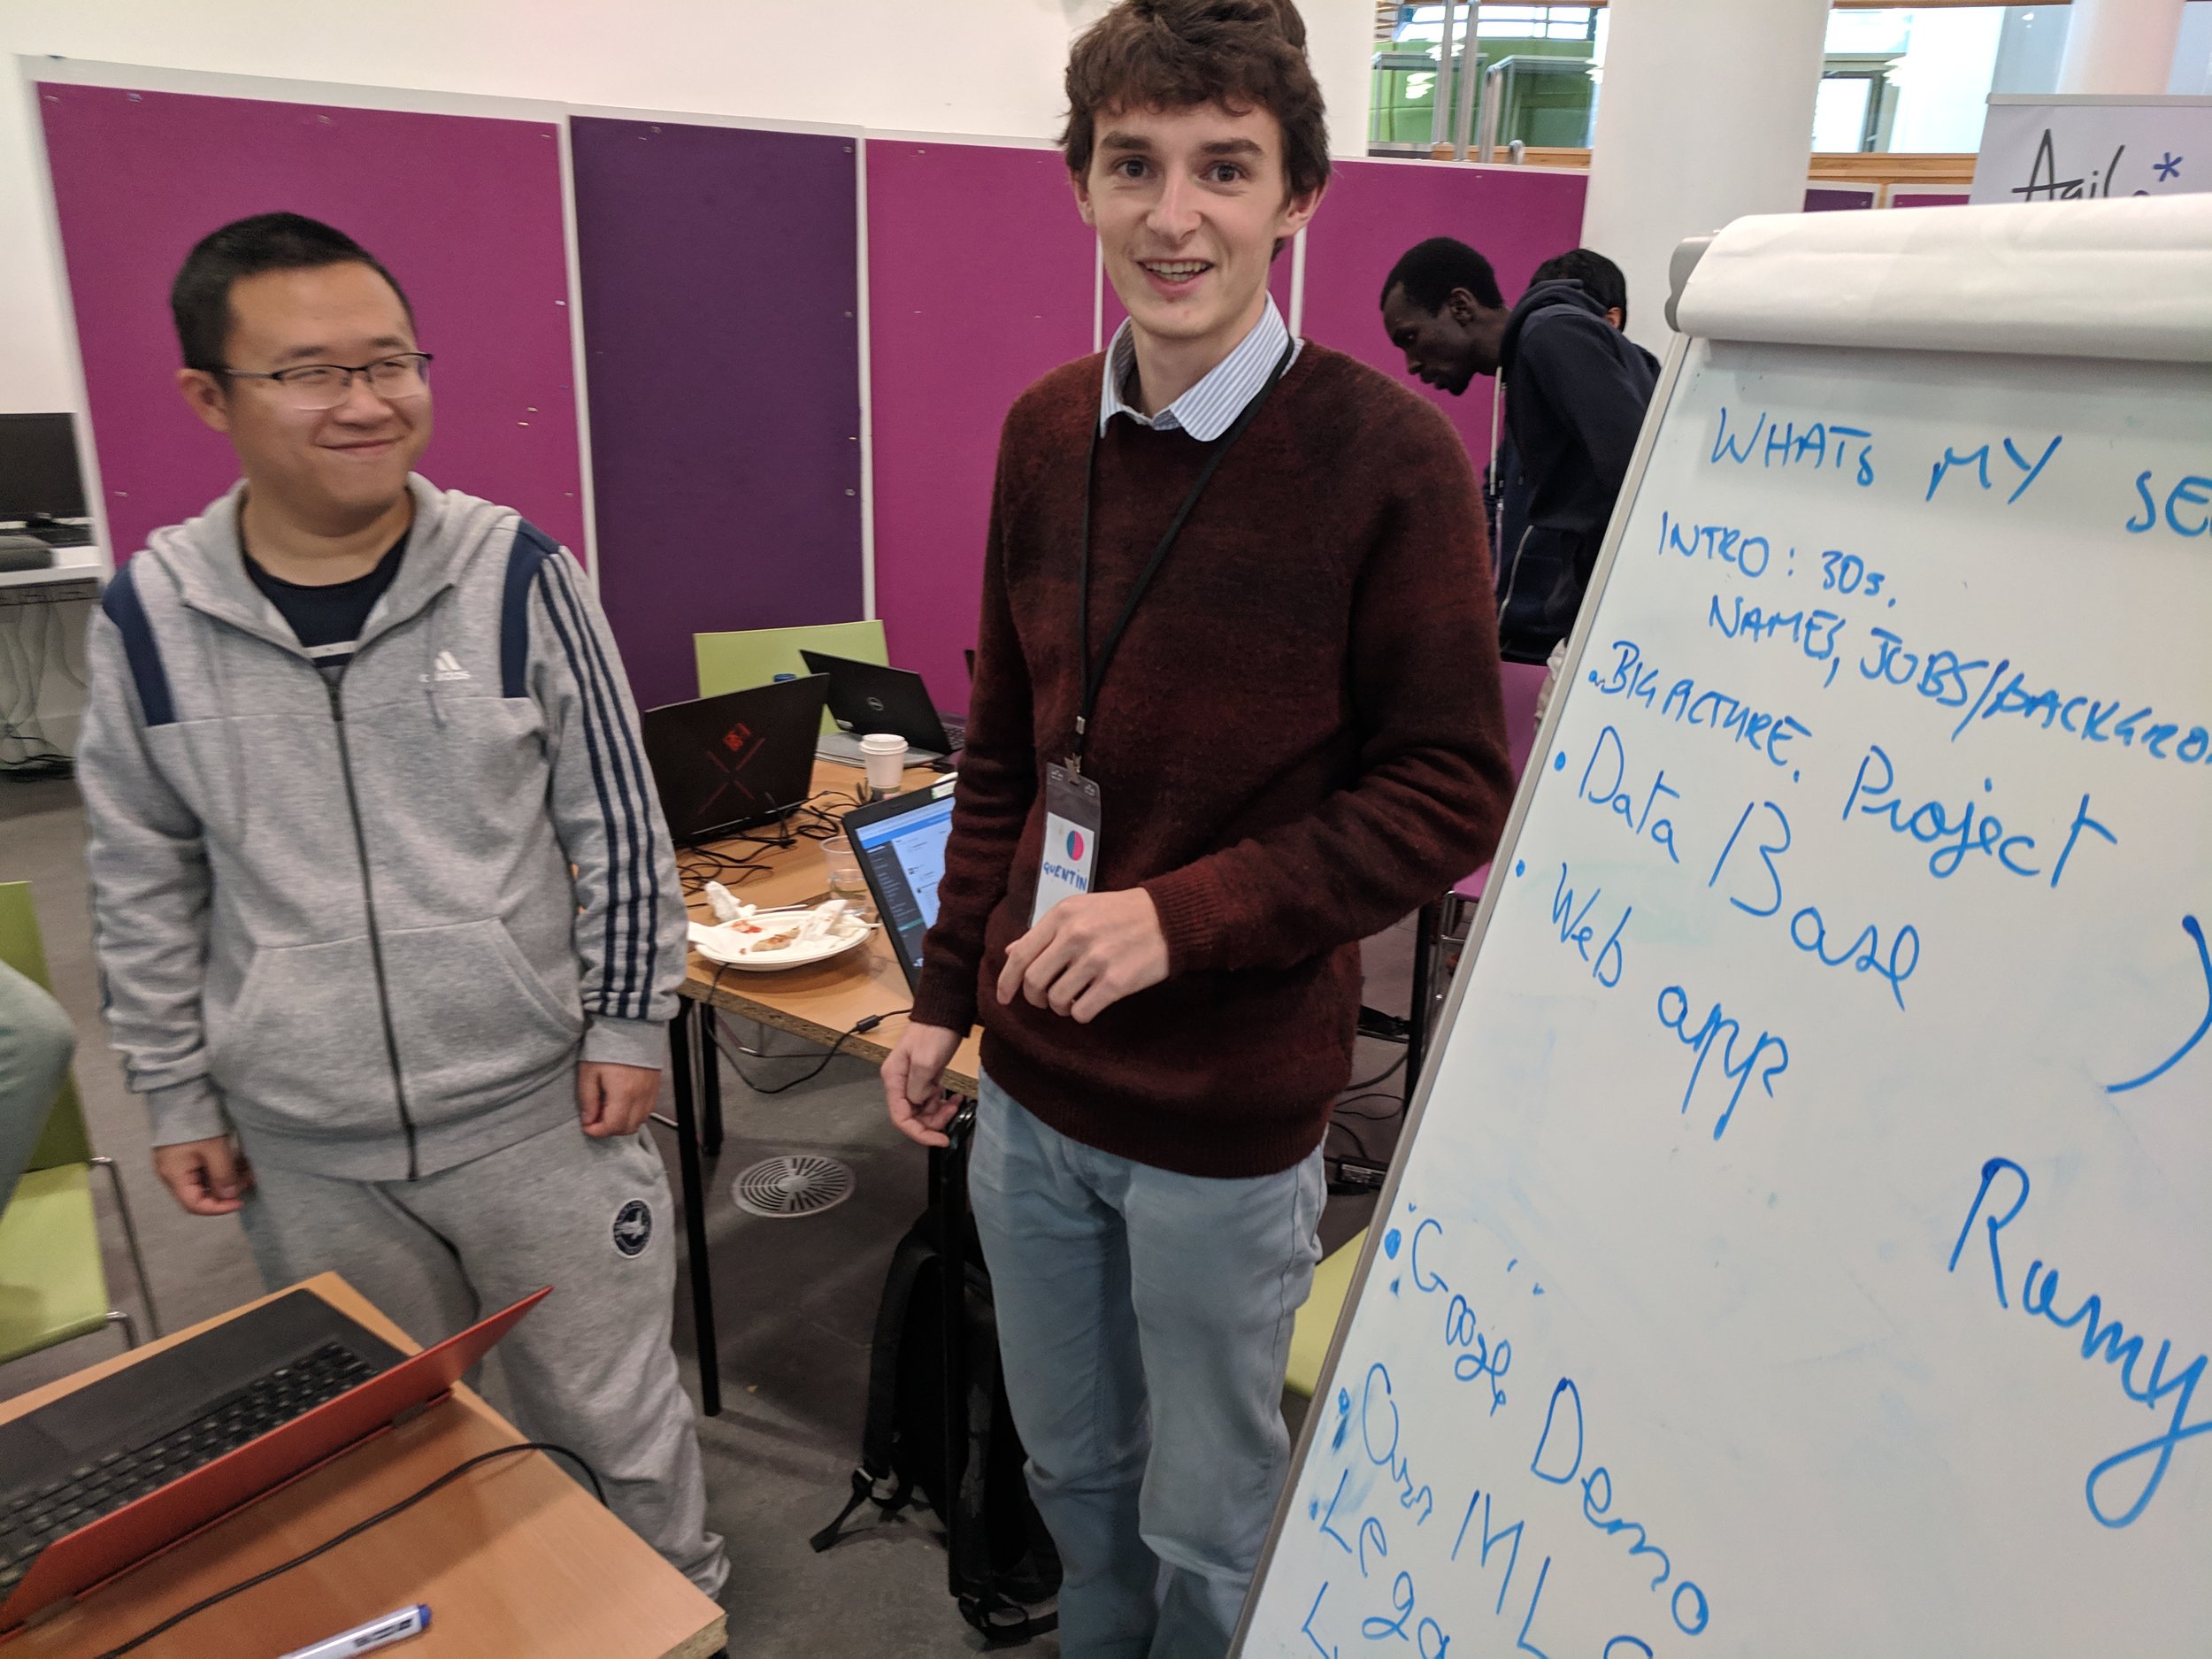
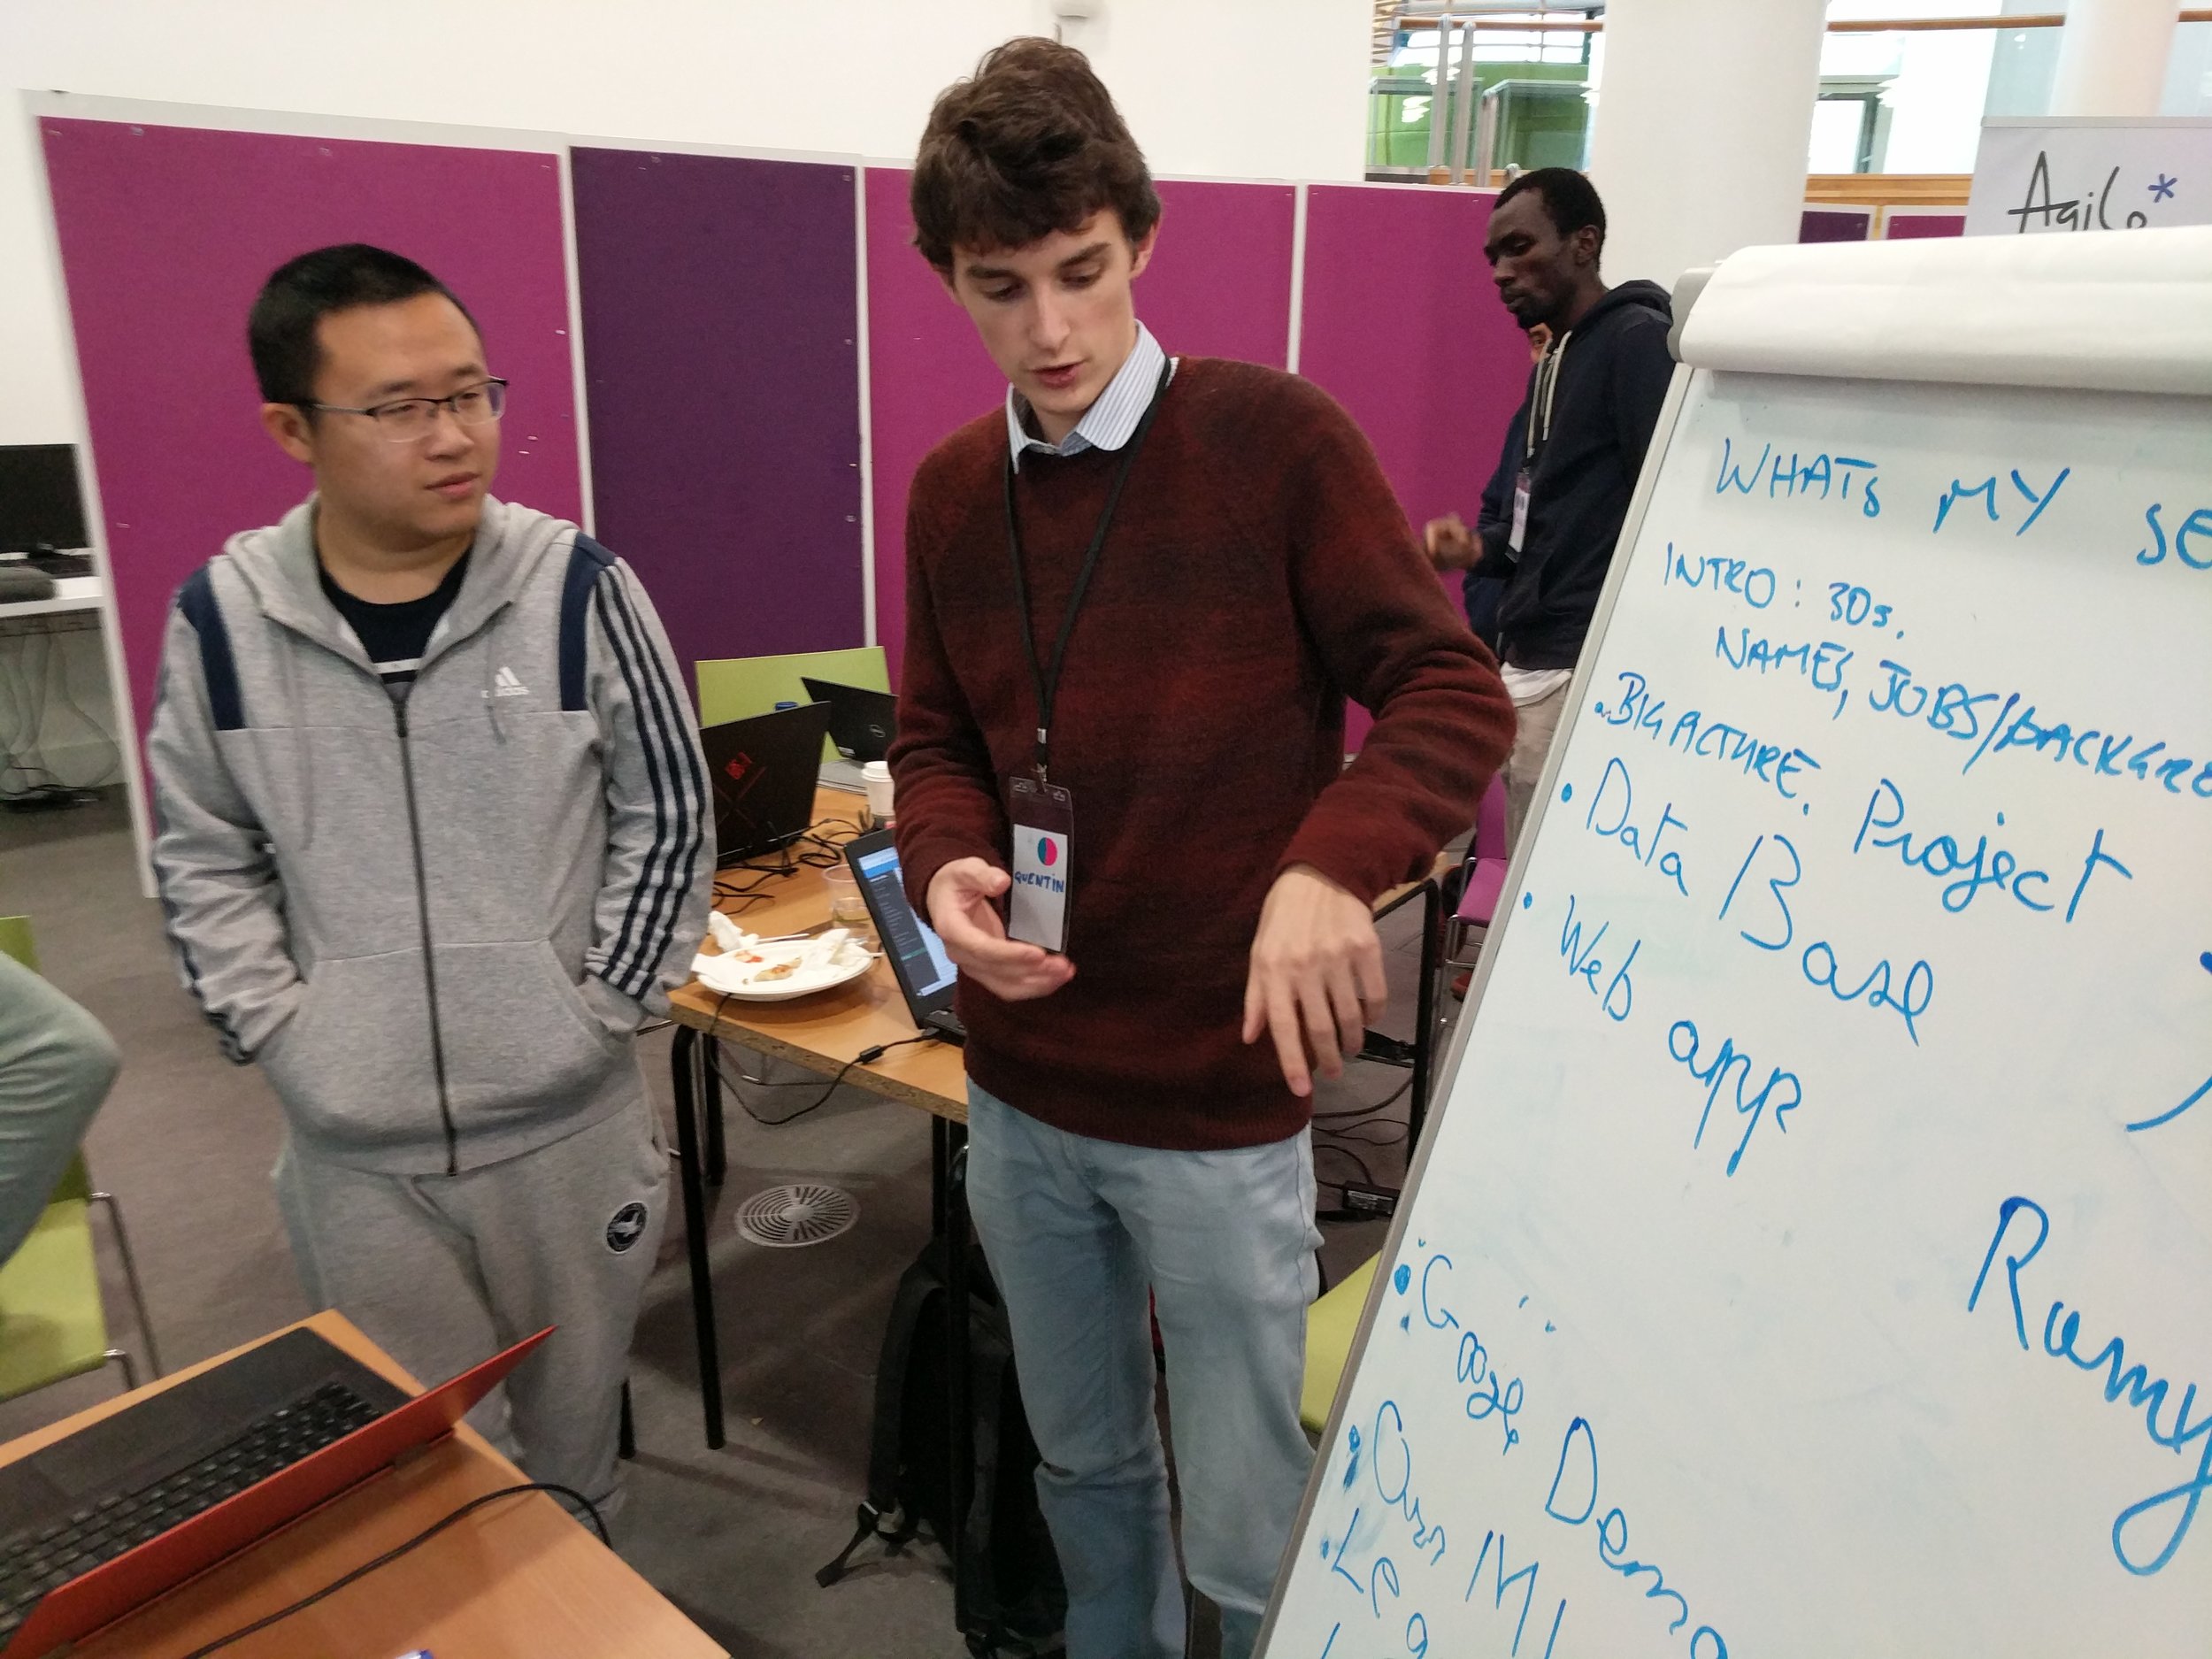
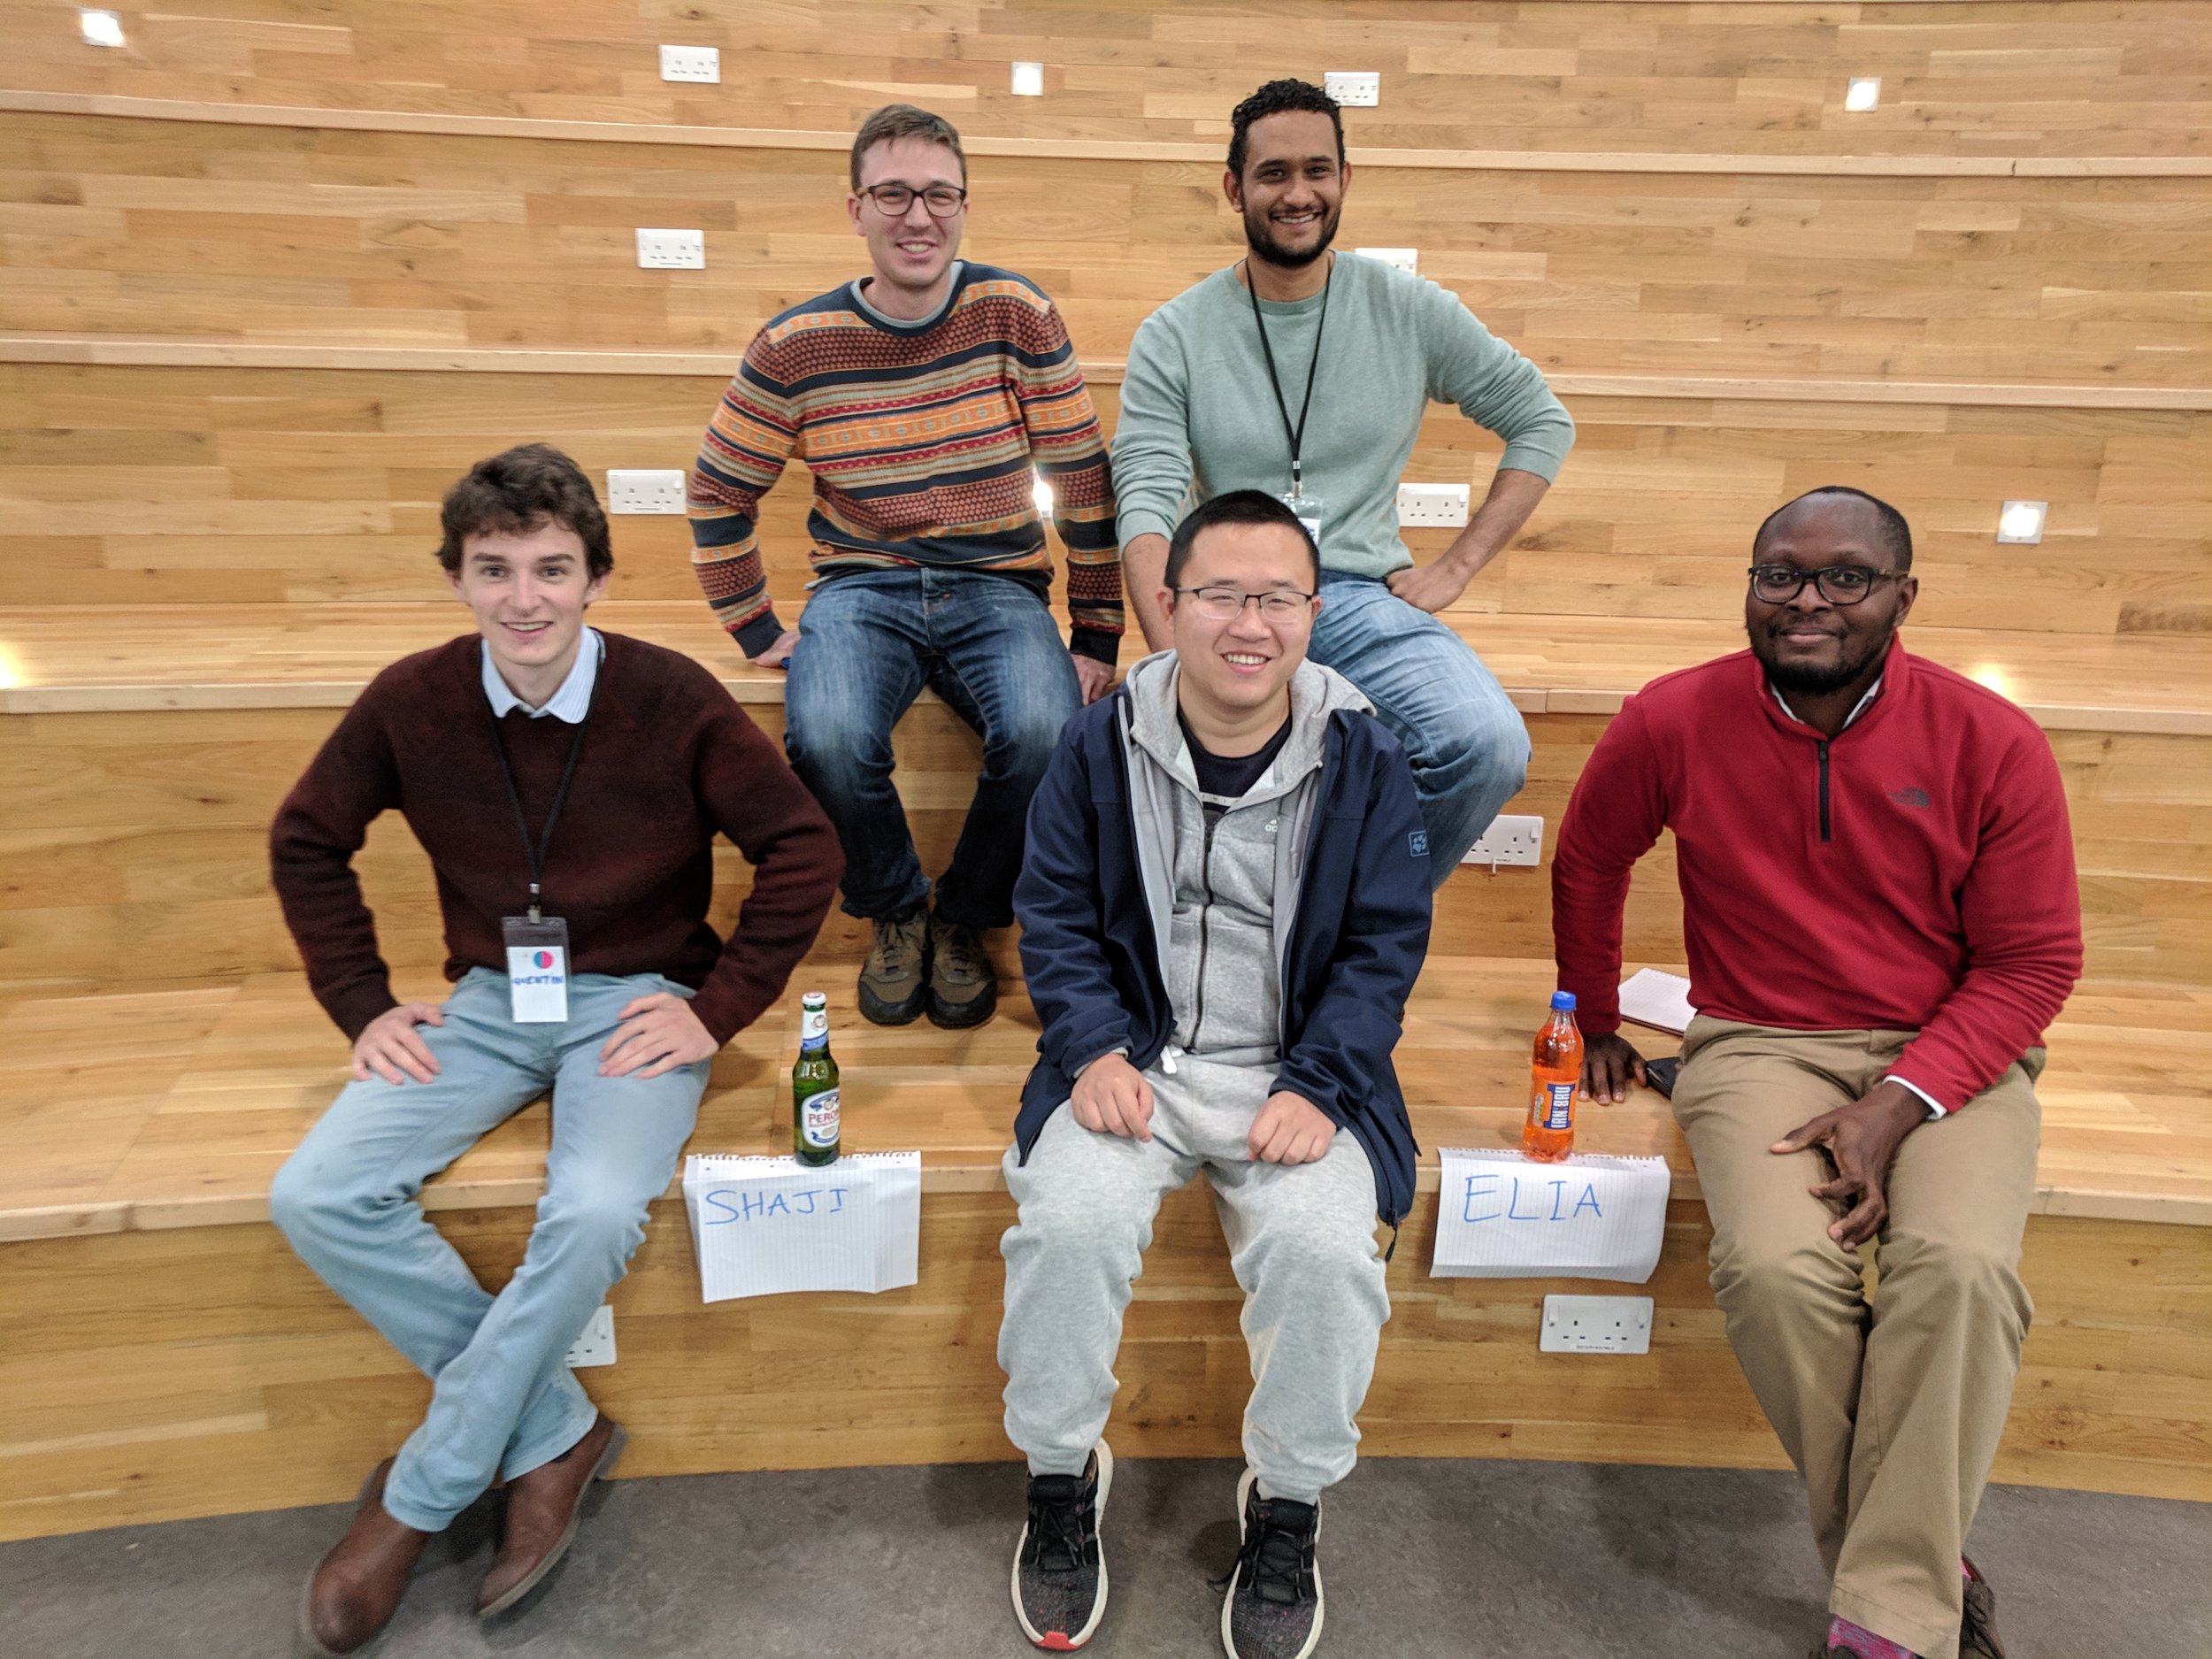
Team What’s My Seismic? Quentin Corlay, Tony Hallam, Ramy Abdallah, Zhihua Cui, Elia Gubbala, Amechi Halim.

Project: The team wanted to detect the presence of various seismic facies in a small segment of seismic data (with a view to later interpreting entire datasets). They quickly generated a training dataset, then explored three classifiers: XGBoost, Google’s AutoML, and a CNN. All of the methods gave reasonable results and were promising enough that the team vowed to continue investigating the problem. Project website. GitHub repo.

This project won the Best Execution award.

whats-my-seismic.png

Stretchy-squeezey well log correlation

Team Dynamic Depth Warping: Jacqueline Booth, Sarah Weihmann, Khaled Muhammad, Sadiq Sani, Rahman Mukras, Trent Piaralall, Julio Rodriguez.

Project: Making picks and correlations in wireline data is hard, partly because the stratigraphic signal changes spatially — thinning and thickening, and with missing or extra sections. To try to cope with this, the team applied a dynamic time (well, depth) warping algorithm to the logs, then looking for similar sections in adjacent wells. The image shows a target GR log (left) with the 5 most similar sections. Two, maybe four, of them seem reasonable. Next the team planned to incorporate more logs, and attach probabilities to the correlations. Early results looked promising. GitHub repo.


Making lithostrat picks

Team Marker Maker: Nick Hayward, Frédéric Ramon, Can Yang, Peter Crafts, Malcolm Gall

Project: The team took on the task of sorting out lithostratigraphic well tops in a mature basin. But there are speedbumps on the road to glory, e.g. recognizing which picks are lithological (as opposed to chronological), and which pick names are equivalent. The team spent time on various subproblems, but there’s a long road ahead.

This project won recognition for a Job Well Done.

marker-maker.jpg

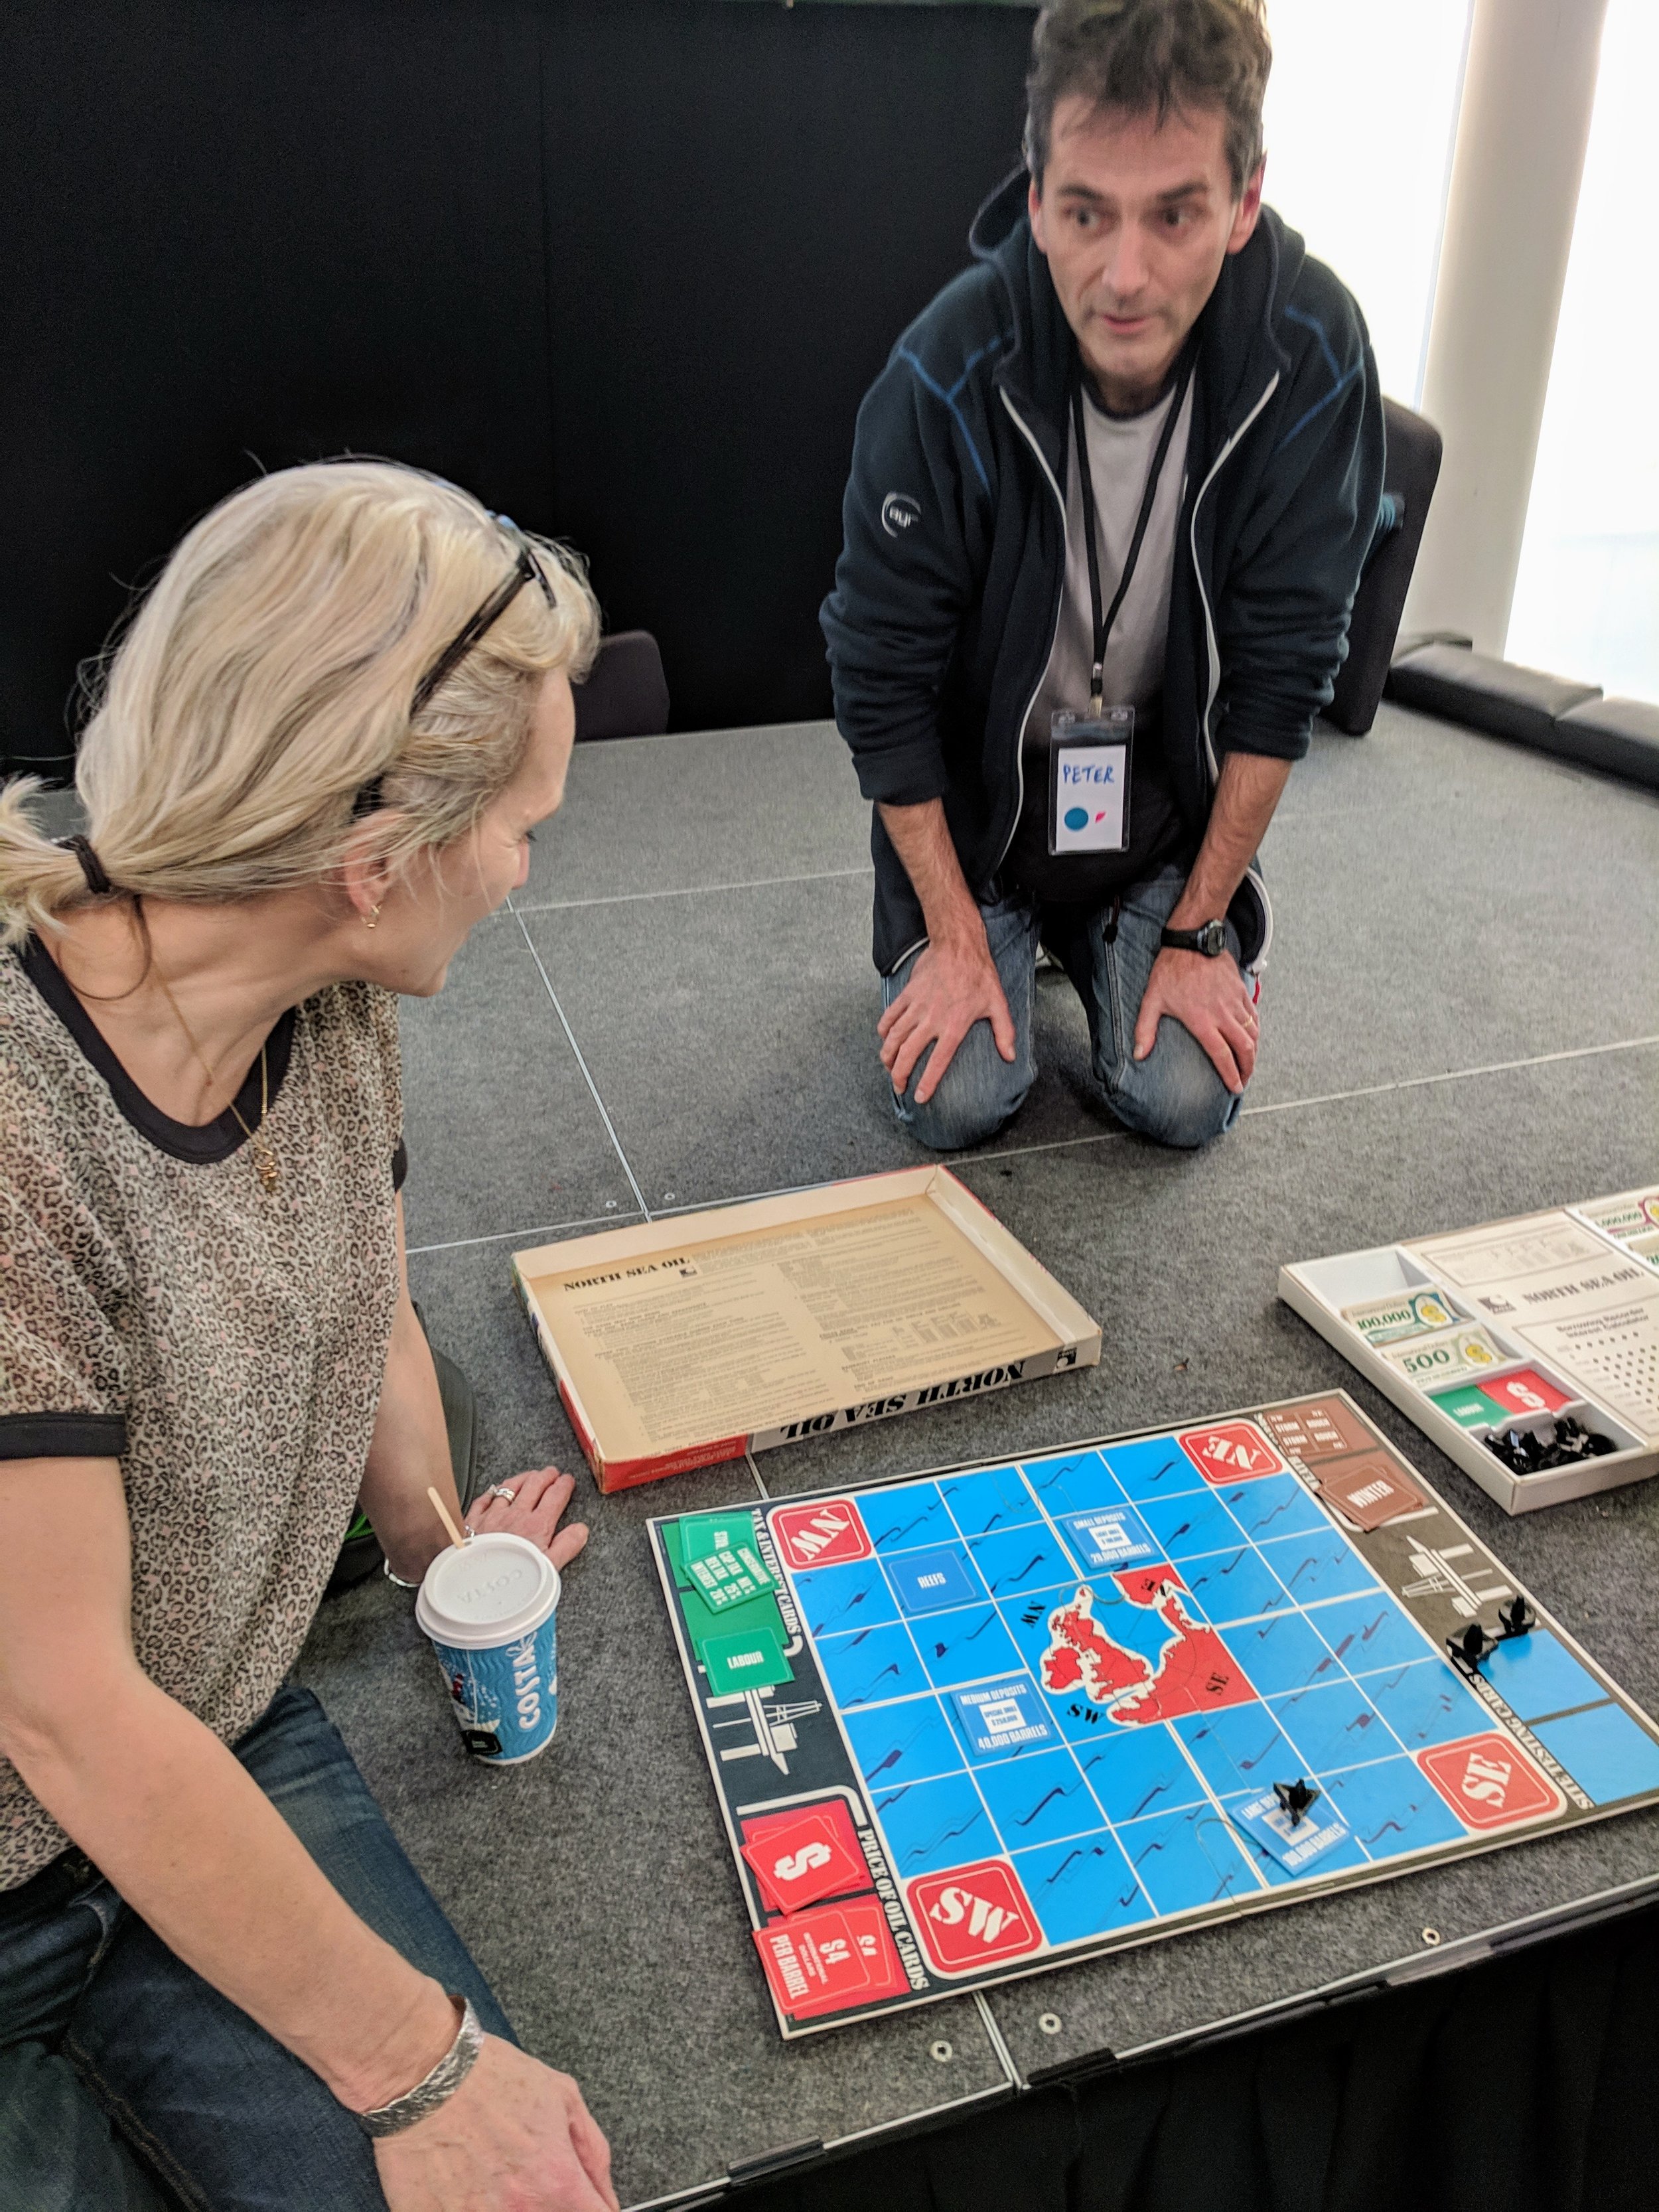
Alongside these projects, Rob and I floated around trying to help, and James Beckwith hacked on a cool project of his own for a while — Paint By Seismic, a look at unsupervised classification on seismic sections. In between generating attributes and clustering, he somehow managed to help and mentor most of the other teams — thanks James!

Thank you!

Thank you to The OGA for these events, and in particular to Jo Bagguley, whose organizational skills I much appreciated over the last few weeks (as my own skills gradually fell apart). The OGA’s own Nick Richardson, the OGTC’s Gillian White, and Robert Gordon Universty’s Eyad Elyan acted as judges.

These organizations contributed to the success of these events — please say Thank You to them when you can!

oga-sponsors.png

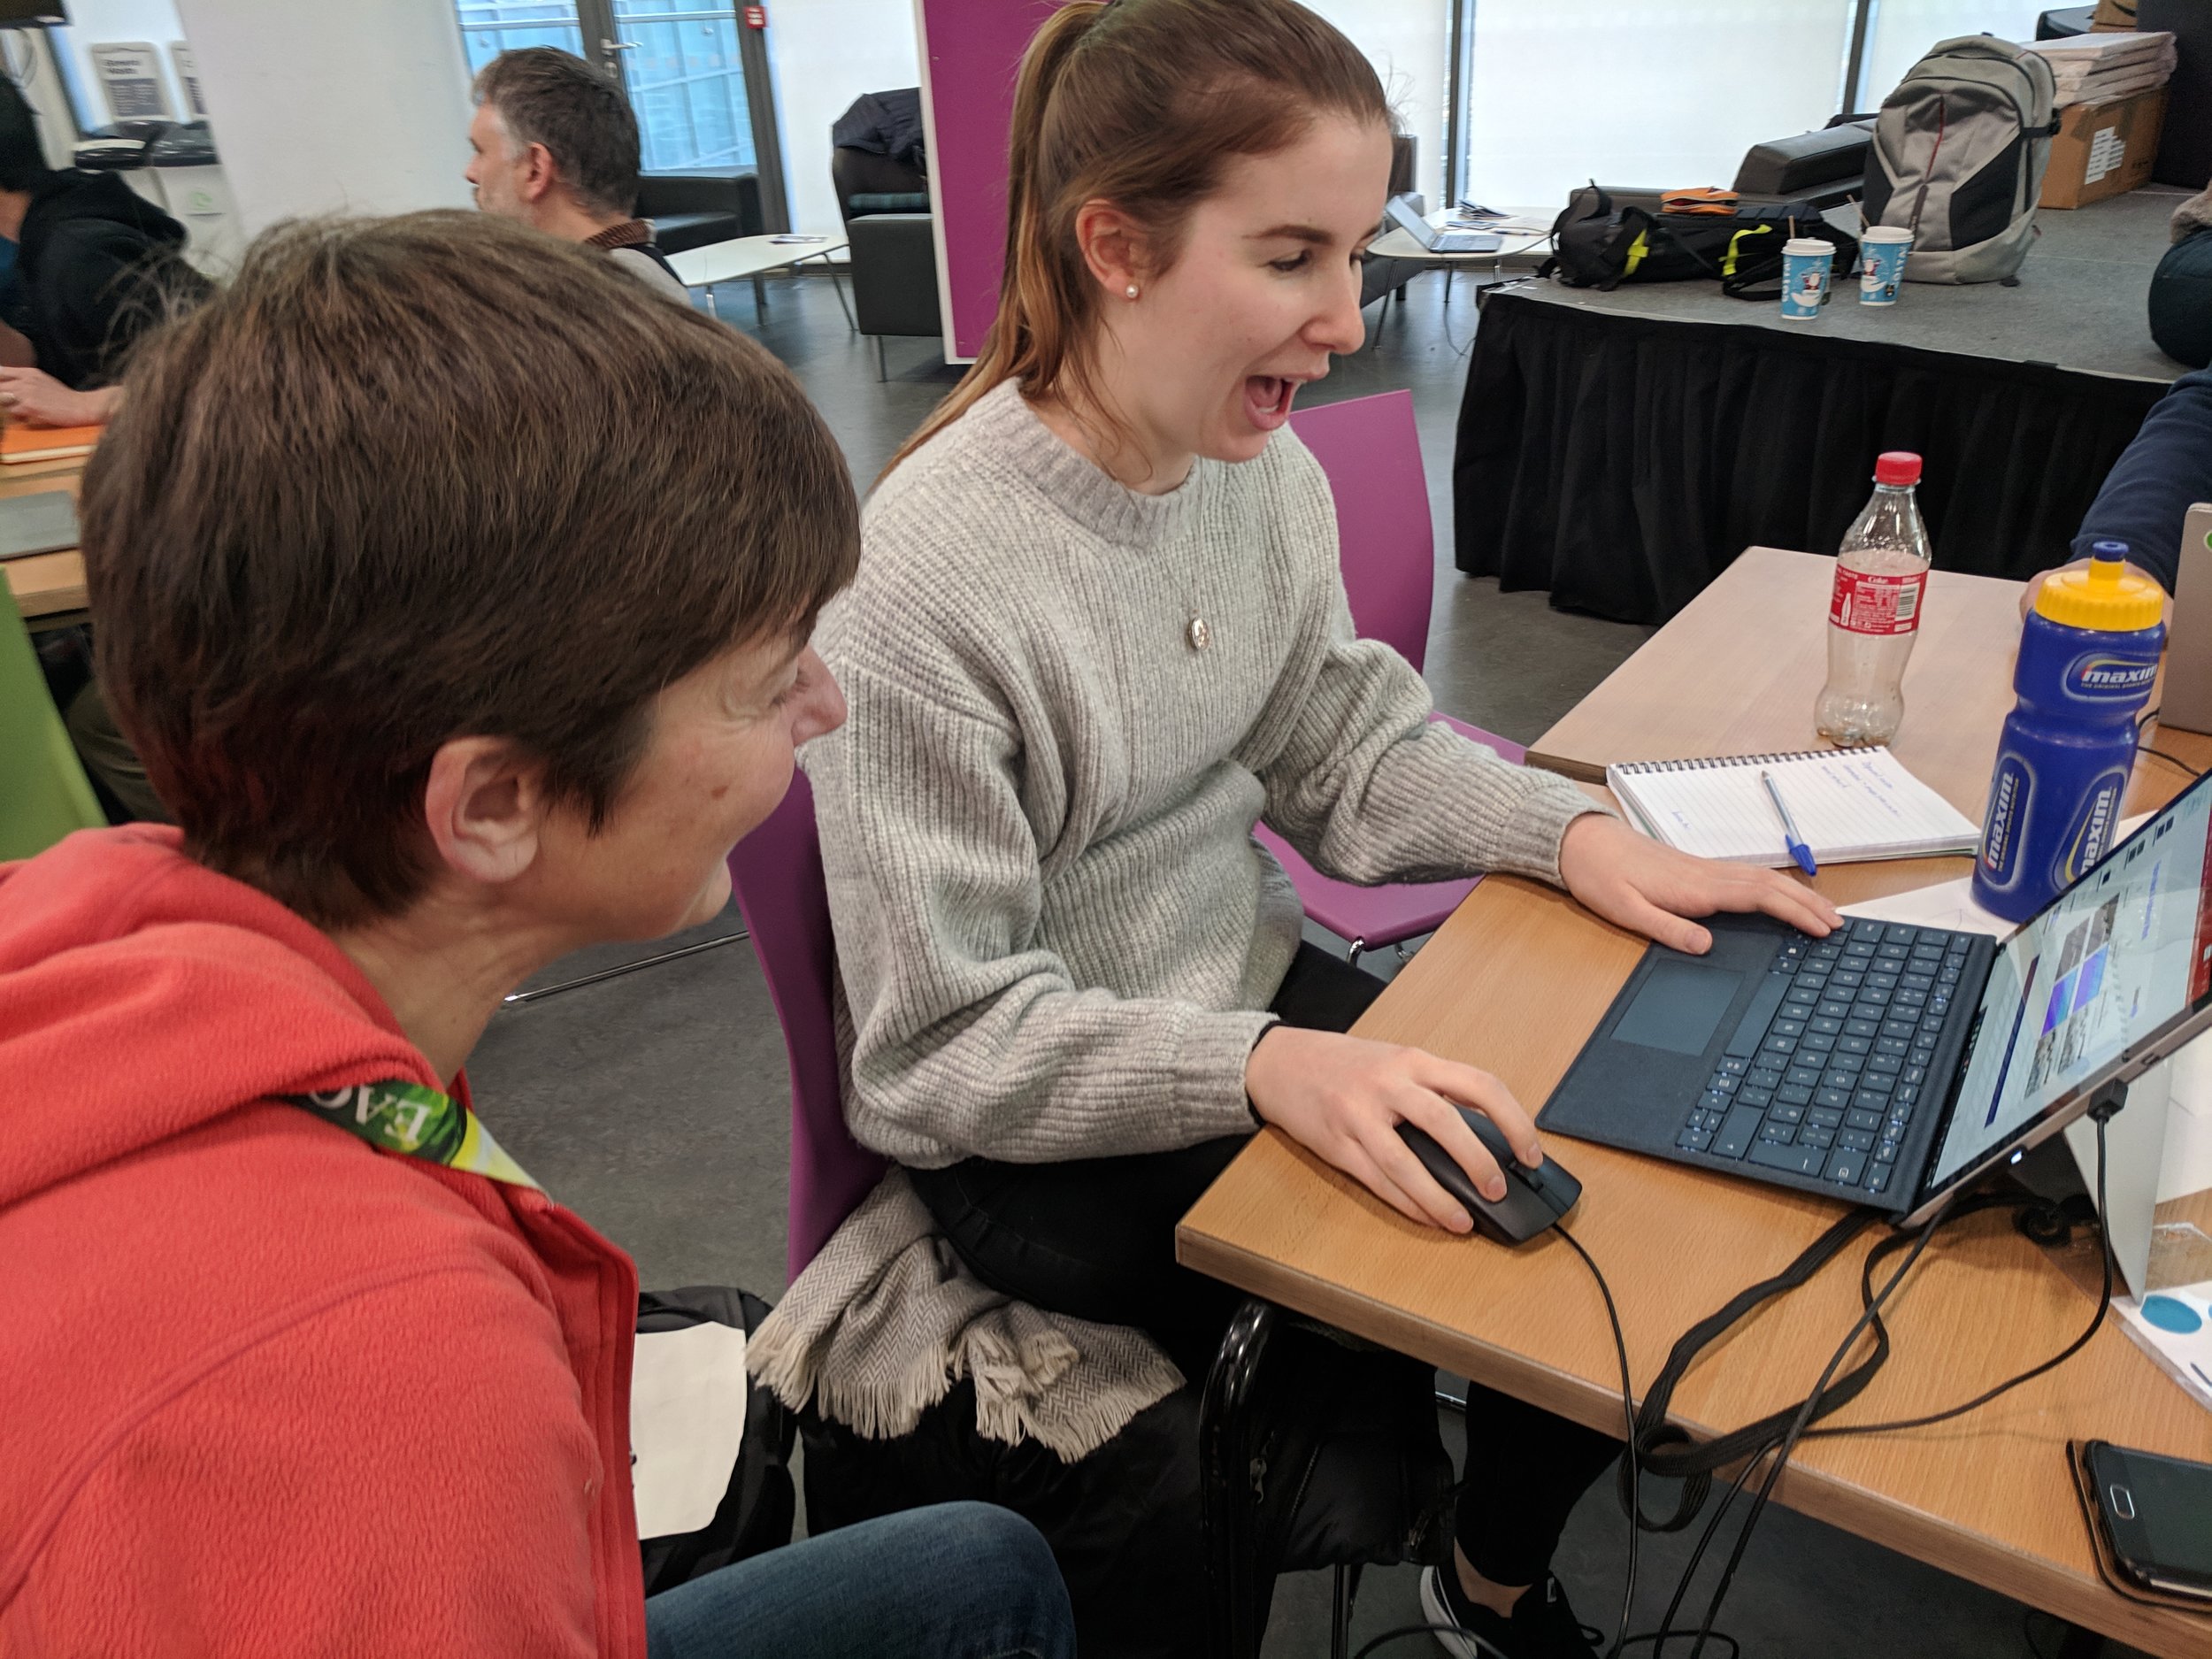
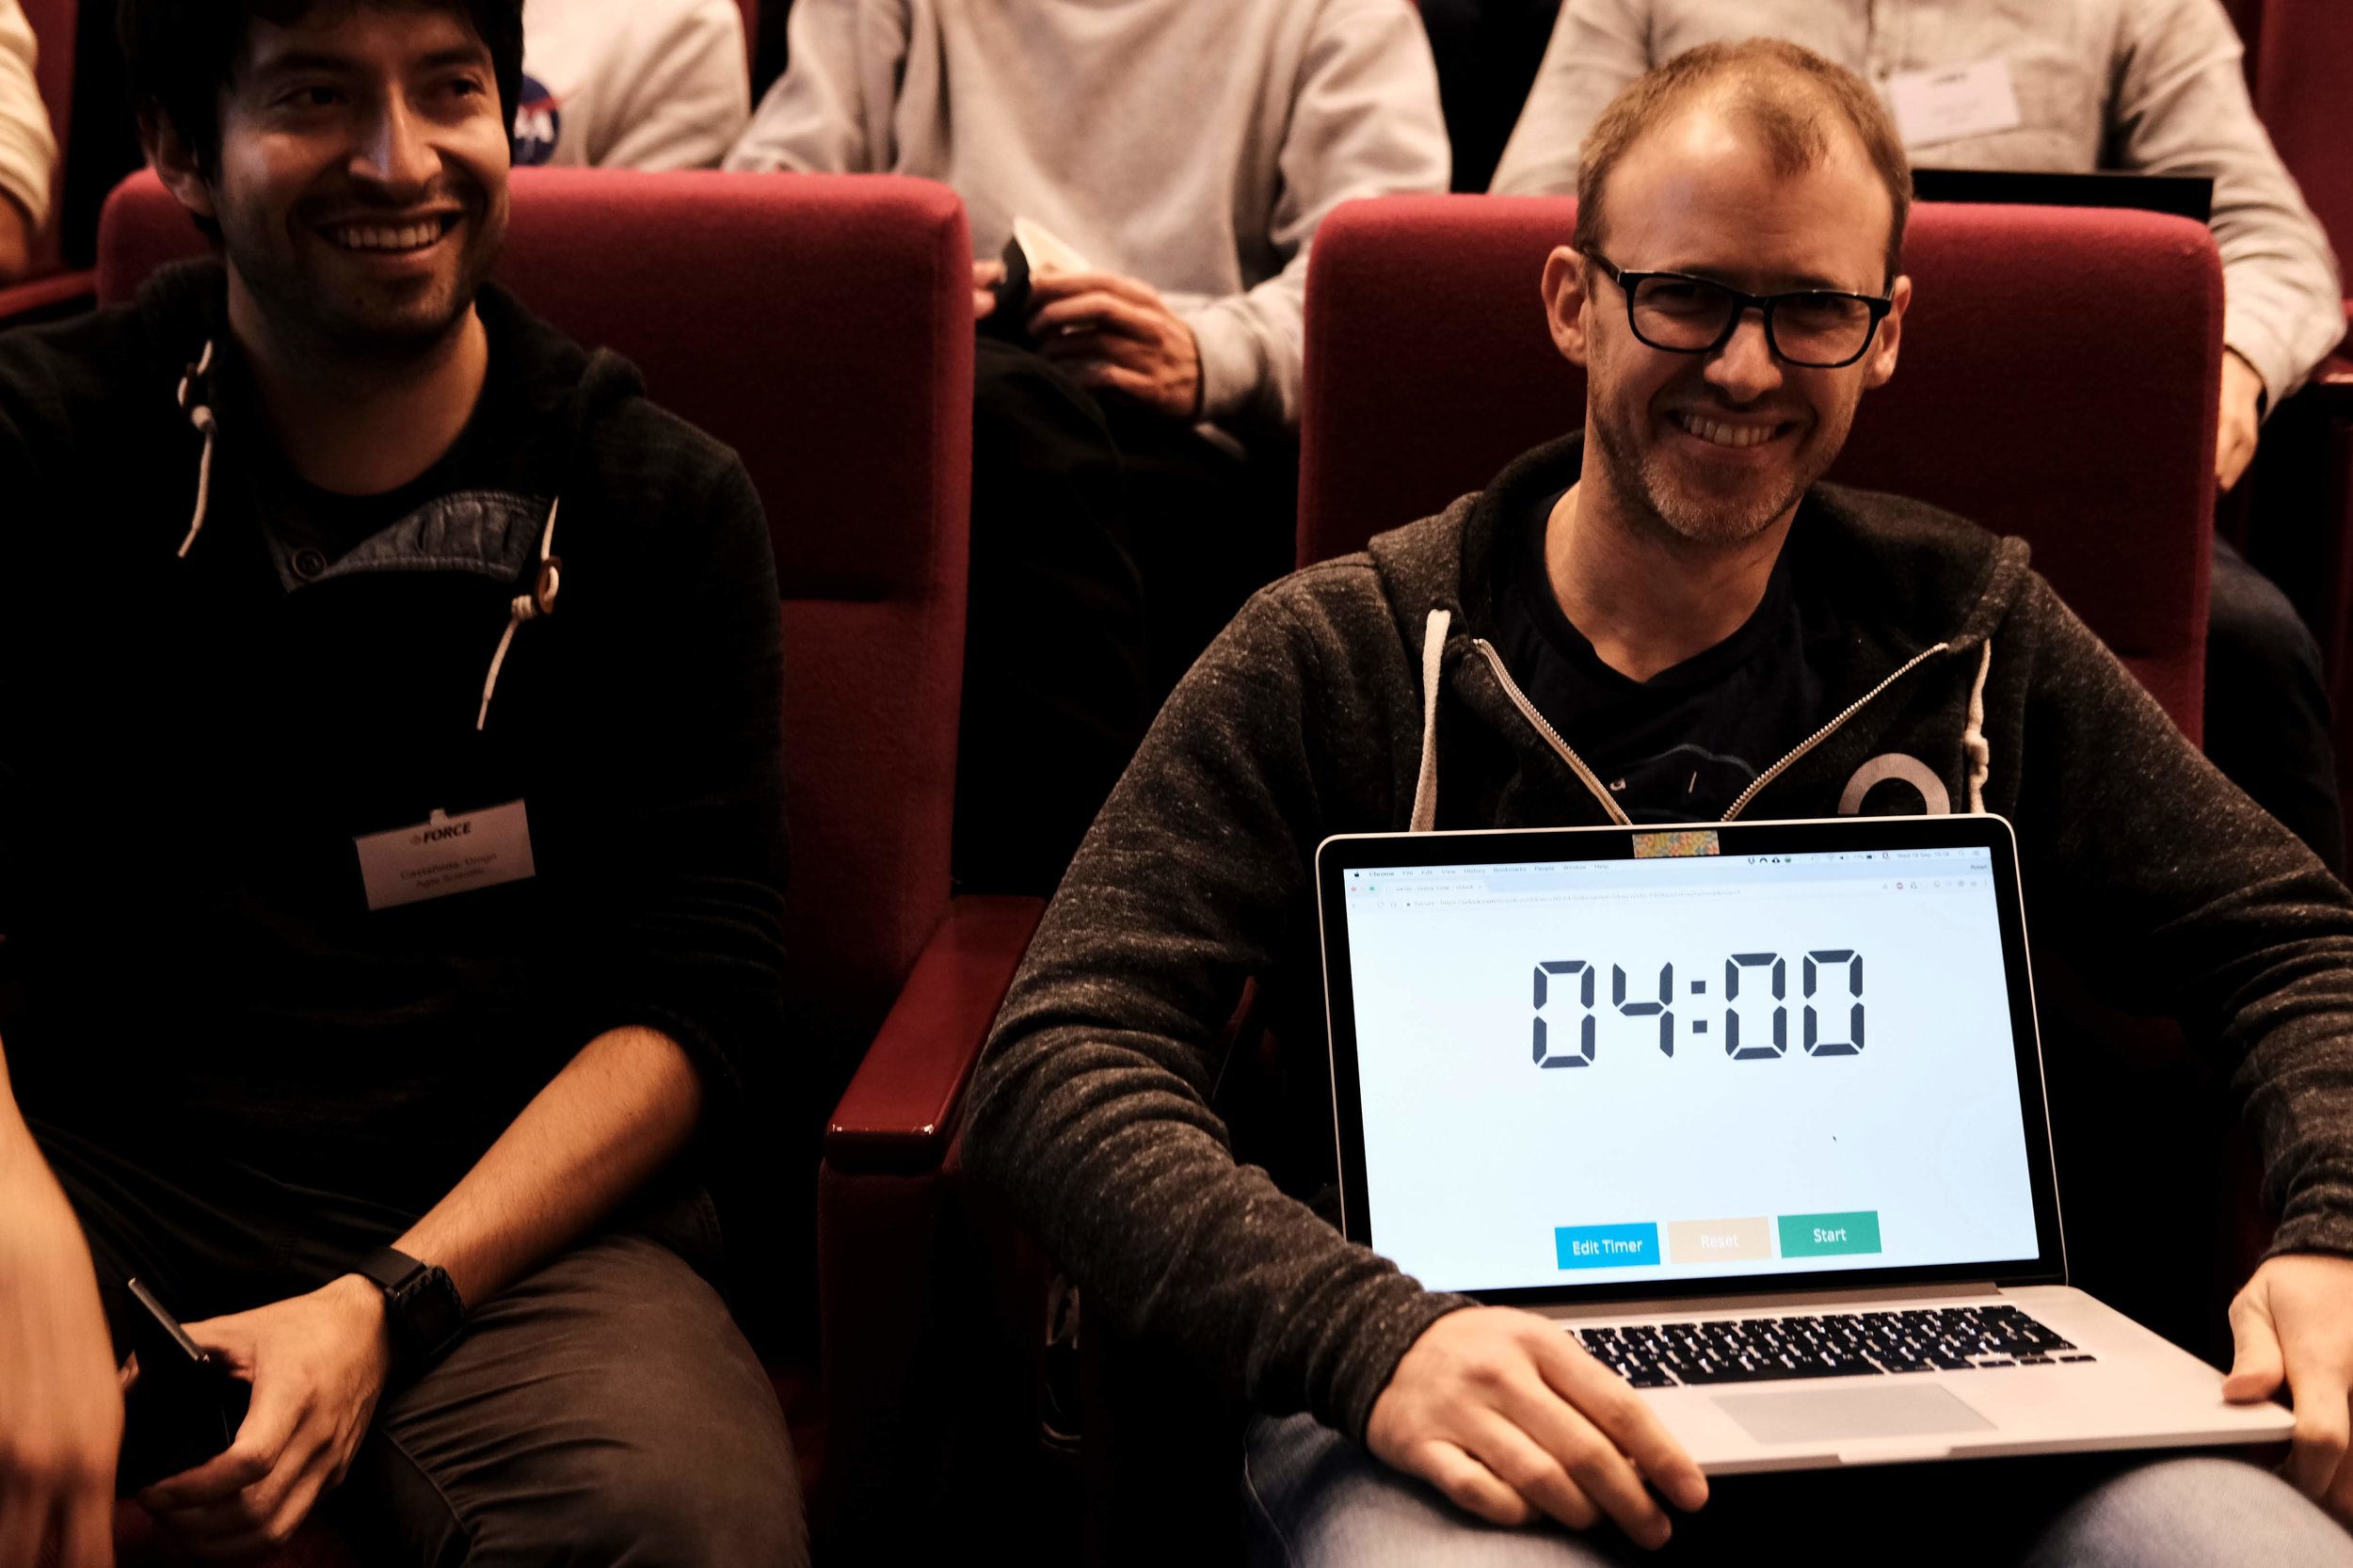
I’ll leave you with some more photos from the event. Enjoy!
Volve: not open after all

Back in June, Equinor made the bold and exciting decision to release all its data from the decommissioned Volve oil field in the North Sea. Although the intent of the release seemed clear, the dataset did not carry a license of any kind. Since you cannot use unlicensed content without permission, this was a problem. I wrote about this at the time.

To its credit, Equinor listened to the concerns from me and others, and considered its options. Sensibly, it chose an off-the-shelf license. It announced its decision a few days ago, and the dataset now carries a Creative Commons Attribution-NonCommercial-ShareAlike license.

Unfortunately, this license is not ‘open’ by any reasonable definition. The non-commercial stipulation means that a lot of people, perhaps most people, will not be able to legally use the data (which is why non-commercial licenses are not open licenses). And the ShareAlike part means that we’re in for some interesting discussion about what derived products are, because any work based on Volve will have to carry the CC BY-NC-SA license too.

Non-commercial licenses are not open

Here are some of the problems with the non-commercial clause:

NC licenses come at a high societal cost: they provide a broad protection for the copyright owner, but strongly limit the potential for re-use, collaboration and sharing in ways unexpected by many users

  • NC licenses are incompatible with CC-BY-SA. This means that the data cannot be used on Wikipedia, SEG Wiki, or AAPG Wiki, or in any openly licensed work carrying that license.

  • NC-licensed data cannot be used commercially. This is obvious, but far-reaching. It means, for example, that nobody can use the data in a course or event for which they charge a fee. It means nobody can use the data as a demo or training data in commercial software. It means nobody can use the data in a book that they sell.

  • The boundaries of the license are unclear. It's arguable whether any business can use the data for any purpose at all, because many of the boundaries of the scope have not been tested legally. What about a course run by AAPG or SEG? What about a private university? What about a government, if it stands to realize monetary gain from, say, a land sale? All of these uses would be illiegal, because it’s the use that matters, not the commercial status of the user.

Now, it seems likely, given the language around the release, that Equinor will not sue people for most of these use cases. They may even say this. Goodness knows, we have enough nudge-nudge-wink-wink agreements like that already in the world of subsurface data. But these arrangements just shift the onus onto the end use and, as we’ve seen with GSI, things can change and one day you wake up with lawsuits.

ShareAlike means you must share too

Creative Commons licenses are, as the name suggests, intended for works of creativity. Indeed, the whole concept of copyright, depends on creativity: copyright protects works of creative expression. If there’s no creativity, there’s no basis for copyright. So for example, a gamma-ray log is unlikely to be copyrightable, but seismic data is (follow the GSI link above to find out why). Non-copyrightable works are not covered by Creative Commons licenses.

All of which is just to help explain some of the language in the CC BY-NC-SA license agreement, which you should read. But the key part is in paragraph 4(b):

You may distribute, publicly display, publicly perform, or publicly digitally perform a Derivative Work only under the terms of this License

What’s a ‘derivative work’? It’s anything ‘based upon’ the licensed material, which is pretty vague and therefore all-encompassing. In short, if you use or show Volve data in your work, no matter how non-commercial it is, then you must attach a CC BY-NC-SA license to your work. This is why SA licenses are sometimes called ‘viral’.

By the way, the much-loved F3 and Penobscot datasets also carry the ShareAlike clause, so any work (e.g. a scientific paper) that uses them is open-access and carries the CC BY-SA license, whether the author of that work likes it or not. I’m pretty sure no-one in academic publishing knows this.

By the way again, everything in Wikipedia is CC BY-SA too. Maybe go and check your papers and presentations now :)

problems-dont-have.png

What should Equinor do?

My impression is that Equinor is trying to satisfy some business partner or legal edge case, but they are forgetting that they have orders of magnitude more capacity to deal with edge cases than the potential users of the dataset do. The principle at work here should be “Don’t solve problems you don’t have”.

Encumbering this amazing dataset with such tight restrictions effectively kills it. It more or less guarantees it cannot have the impact I assume they were looking for. I hope they reconsider their options. The best choice for any open data is CC-BY.

FORCE ML Hackathon: project round-up

The FORCE Machine Learning Hackathon last week generated hundreds of new relationships and nine new projects, including seven new open source tools. Here’s the full run-down, in no particular order…


Predicting well rates in real time

Team Virtual Flow Metering: Nils Barlaug, Trygve Karper, Stian Laagstad, Erlend Vollset (all from Cognite) and Emil Hansen (AkerBP).

Tech: Cognite Data Platform, scikit-learn. GitHub repo.

Project: An engineer from AkerBP brought a problem: testing the rate from a well reduces the pressure and therefore reduces the production rate for a short time, costing about $10k per day. His team investigated whether they could instead predict the rate from other known variables, thereby reducing the number of expensive tests.

This project won the Most Commercial Potential award.

The predicted flow rate (blue) compared to the true flow rate (orange). The team used various models, from multilinear regression to boosted trees.


Reinforcement learning tackles interpretation

Team Gully Attack: Steve Purves, Eirik Larsen, JB Bonas (all Earth Analytics), Aina Bugge (Kalkulo), Thormod Myrvang (NTNU), Peder Aursand (AkerBP).

Tech: keras-rl. GitHub repo.

Project: Deep reinforcement learning has proven adept at learning, and winning, games, and at other tasks including image segmentation. The team tried training an agent to pick these channels in the Parihaka 3D, as well as some other automatic interpretation approaches.

The agent learned something, but in the end it did not prevail. The team learned lots, and did prevail!

This project won the Most Creative Idea award.

Early in training, the learning agent wanders around the image (top left). After an hour of training, the agent tends to stick to the gullies (right).


A new kind of AVO crossplot?

Team ASAP: Per Avseth (Dig), Lucy MacGregor (Rock Solid Images), Lukas Mosser (Imperial), Sandeep Shelke (Emerson), Anders Draege (Equinor), Jostein Heredsvela (DEA), Alessandro Amato del Monte (ENI).

Tech: t-SNE, UMAP, VAE. GitHub repo.

Project: If you were trying to come up with a new approach to AVO analysis, these are the scientists you’d look for. The idea was to reduce the dimensionality of the input traces — using first t-SNE and UMAP then a VAE. This resulted in a new 2-space in which interesting clusters could be probed, chiefly by processing synthetics with known variations (e.g. in thickness or porosity).

This project won the Best In Show award. Look out for the developments that come from this work!

Top: Illustration of the variational autoencoder, which reduces the input data (top left) into some abstract representation — a crossplot, essentially (top middle) — and can also reconstruct the data, but without the features that did not discriminate between the datasets, effectively reducing noise (top right).

The lower image shows the interpreted crossplot (left) and the implied distribution of rock properties (right).


Acquiring seismic with crayons

Team: Jesper Dramsch (Technical University of Denmark), Thilo Wrona (University of Bergen), Victor Aare (Schlumberger), Arno Lettman (DEA), Alf Veland (NPD).

Tech: pix2pix GAN (TensorFlow). GitHub repo.

Project: Not everything tht looks like a toy is a toy. The team spent a few hours drawing cartoons of small seismic sections, then re-trained the pix2pix GAN on them. The result — an app (try it!) that turns sketches into seismic!

This project won the People’s Choice award.

A sketch of a salt diapir penetrating geological layers (left) and the inferred seismic expression, generated by the neural network. In principal, the model could also be trained to work in the other direction.

A sketch of a salt diapir penetrating geological layers (left) and the inferred seismic expression, generated by the neural network. In principal, the model could also be trained to work in the other direction.


Extracting show depths and confidence from PDFs

Team: Florian Basier (Emerson), Jesse Lord (Kadme), Chris Olsen (ConocoPhillips), Anne Estoppey (student), Kaouther Hadji (Accenture).

Tech: sklearn, PyPDF2, NLTK, JavaScript. GitHub repo.

Project: A couple of decades ago, the last great digital revolution gave us PDFs. Lots of PDFs. But these pseudodigital documents still need to be wrangled into Proper Data. This team took on that project, trying in particular to extract both the depth of a show, and the confidence in its identification, from well reports.

This project won the Best Presentation award.

Kaouther Hadji (left), Florian Basier, Jesse Lord, and Anne Estoppey (right).

Kaouther Hadji (left), Florian Basier, Jesse Lord, and Anne Estoppey (right).


Grain size and structure from core images

Team: Eirik Time, Xiaopeng Liao, Fahad Dilib (all Equinor), Nathan Jones (California Resource Corp), Steve Braun (ExxonMobil), Silje Moeller (Cegal).

Tech: sklearn, skimage, fast.ai. GitHub repo.

Project: One of the many teams composed of professionals from all over the industry — it’s amazing to see this kind of collaboration. The team did a great job of breaking the problem down, going after what they could and getting some decent results. An epic task, but so many interesting avenues — we need more teams on these problems!

The pipeline was as ambitious as it looks. But this is a hard problem that will take some time to get good at. Kudos to this team for starting to dig into it and for making amazing progress in just 2 days.


Learning geological age from bugs

Team: David Wade (Equinor), Per Olav Svendsen (Equinor), Bjoern Harald Fotland (Schlumberger), Tore Aadland (University of Bergen), Christopher Rege (Cegal).

Tech: scikit-learn (random forest). GitHub repo.

Project: The team used DEX files from five wells from the recently released Volve dataset from Equinor. The goal was to learn to predict geological age from biostratigraphic species counts. They made substantial progress — and highlighted what a great resource Volve will be as the community explores it and publishes results like these.

David Wade and Per Olav Svendsen of Equinor (top), and some results (bottom)


Lost in 4D space!

Team: Andres Hatloey, Doug Hakkarinen, Mike Brhlik (all ConocoPhillips), Espen Knudsen, Raul Kist, Robin Chalmers (all Cegal), Einar Kjos (AkerBP).

Tech: scikit-learn (random forest regressor). GitHub repo.

Project: Another cross-industry collaboration. In their own words, the team set out to “identify trends between 4D seismic and well measurements in order to calculate reservoir pressures and/or thickness between well control”. They were motivated by real data from Valhall, and did a great job making sense of a lot of real-world data. One nice innovation: using the seismic quality as a weighting factor to try to understand the role of uncertainty. See the team’s presentation.

4D-pressure.png

Clustering reveals patterns in 4D maps

Team: Tetyana Kholodna, Simon Stavland, Nithya Mohan, Saktipada Maity, Jone Kristoffersen Bakkevig (all CapGemini), Reidar Devold Midtun (ConocoPhillips).

Project: The team worked on real 4D data from an operating field. Reidar provided a lot of maps computed with multiple seismic attributes. Groups of maps represent different reservoir layers, and thirteen different time-lapse acquisitions. So… a lot of maps. The team attempted to correlate 4D effects across all of these dimensions — attributes, layers, and production time. Reidar, the only geoscientist on a team of data scientists, also provided one of the quotes of the hackathon: “I’m the geophysicist, and I represent the problem”.

4D-layers.png

That’s it for the FORCE Hackathon for 2018. I daresay there may be more in the coming months and years. If they can build on what we started last week, I think more remarkable things are on the way!

all_small.png

One more thing…

I mentioned the UK hackathons last time, but I went and forgot to include the links to the events. So here they are again, in case you couldn’t find them online…

What are you waiting for? Get signed up and tell your friends!
Machine learning goes mainstream

At our first machine-learning-themed hackathon, in New Orleans in 2015, we had fifteen hackers. TImes were hard in the industry. Few were willing or able to compe out and play. Well, it’s now clear that times have changed! After two epic ML hacks last year (in Paris and Houston), at which we hosted about 115 scientists, it’s clear this year is continuing the trend. Indeed, by the end of 2018 we expect to have welcomed at least 240 more digital scientists to hackathons in the US and Europe.

Conclusion: something remarkable is happening in our field.

The FORCE hackathon

Last Tuesday and Wednesday, Agile co-organized the FORCE Machine Learning Hackathon in Stavanger, Norway. FORCE is a cross-industry geoscience organization, coordinating meetings and research in subsurface. The event preceeded a 1-day symposium on the same theme: machine learning in geoscience. And it was spectacular.

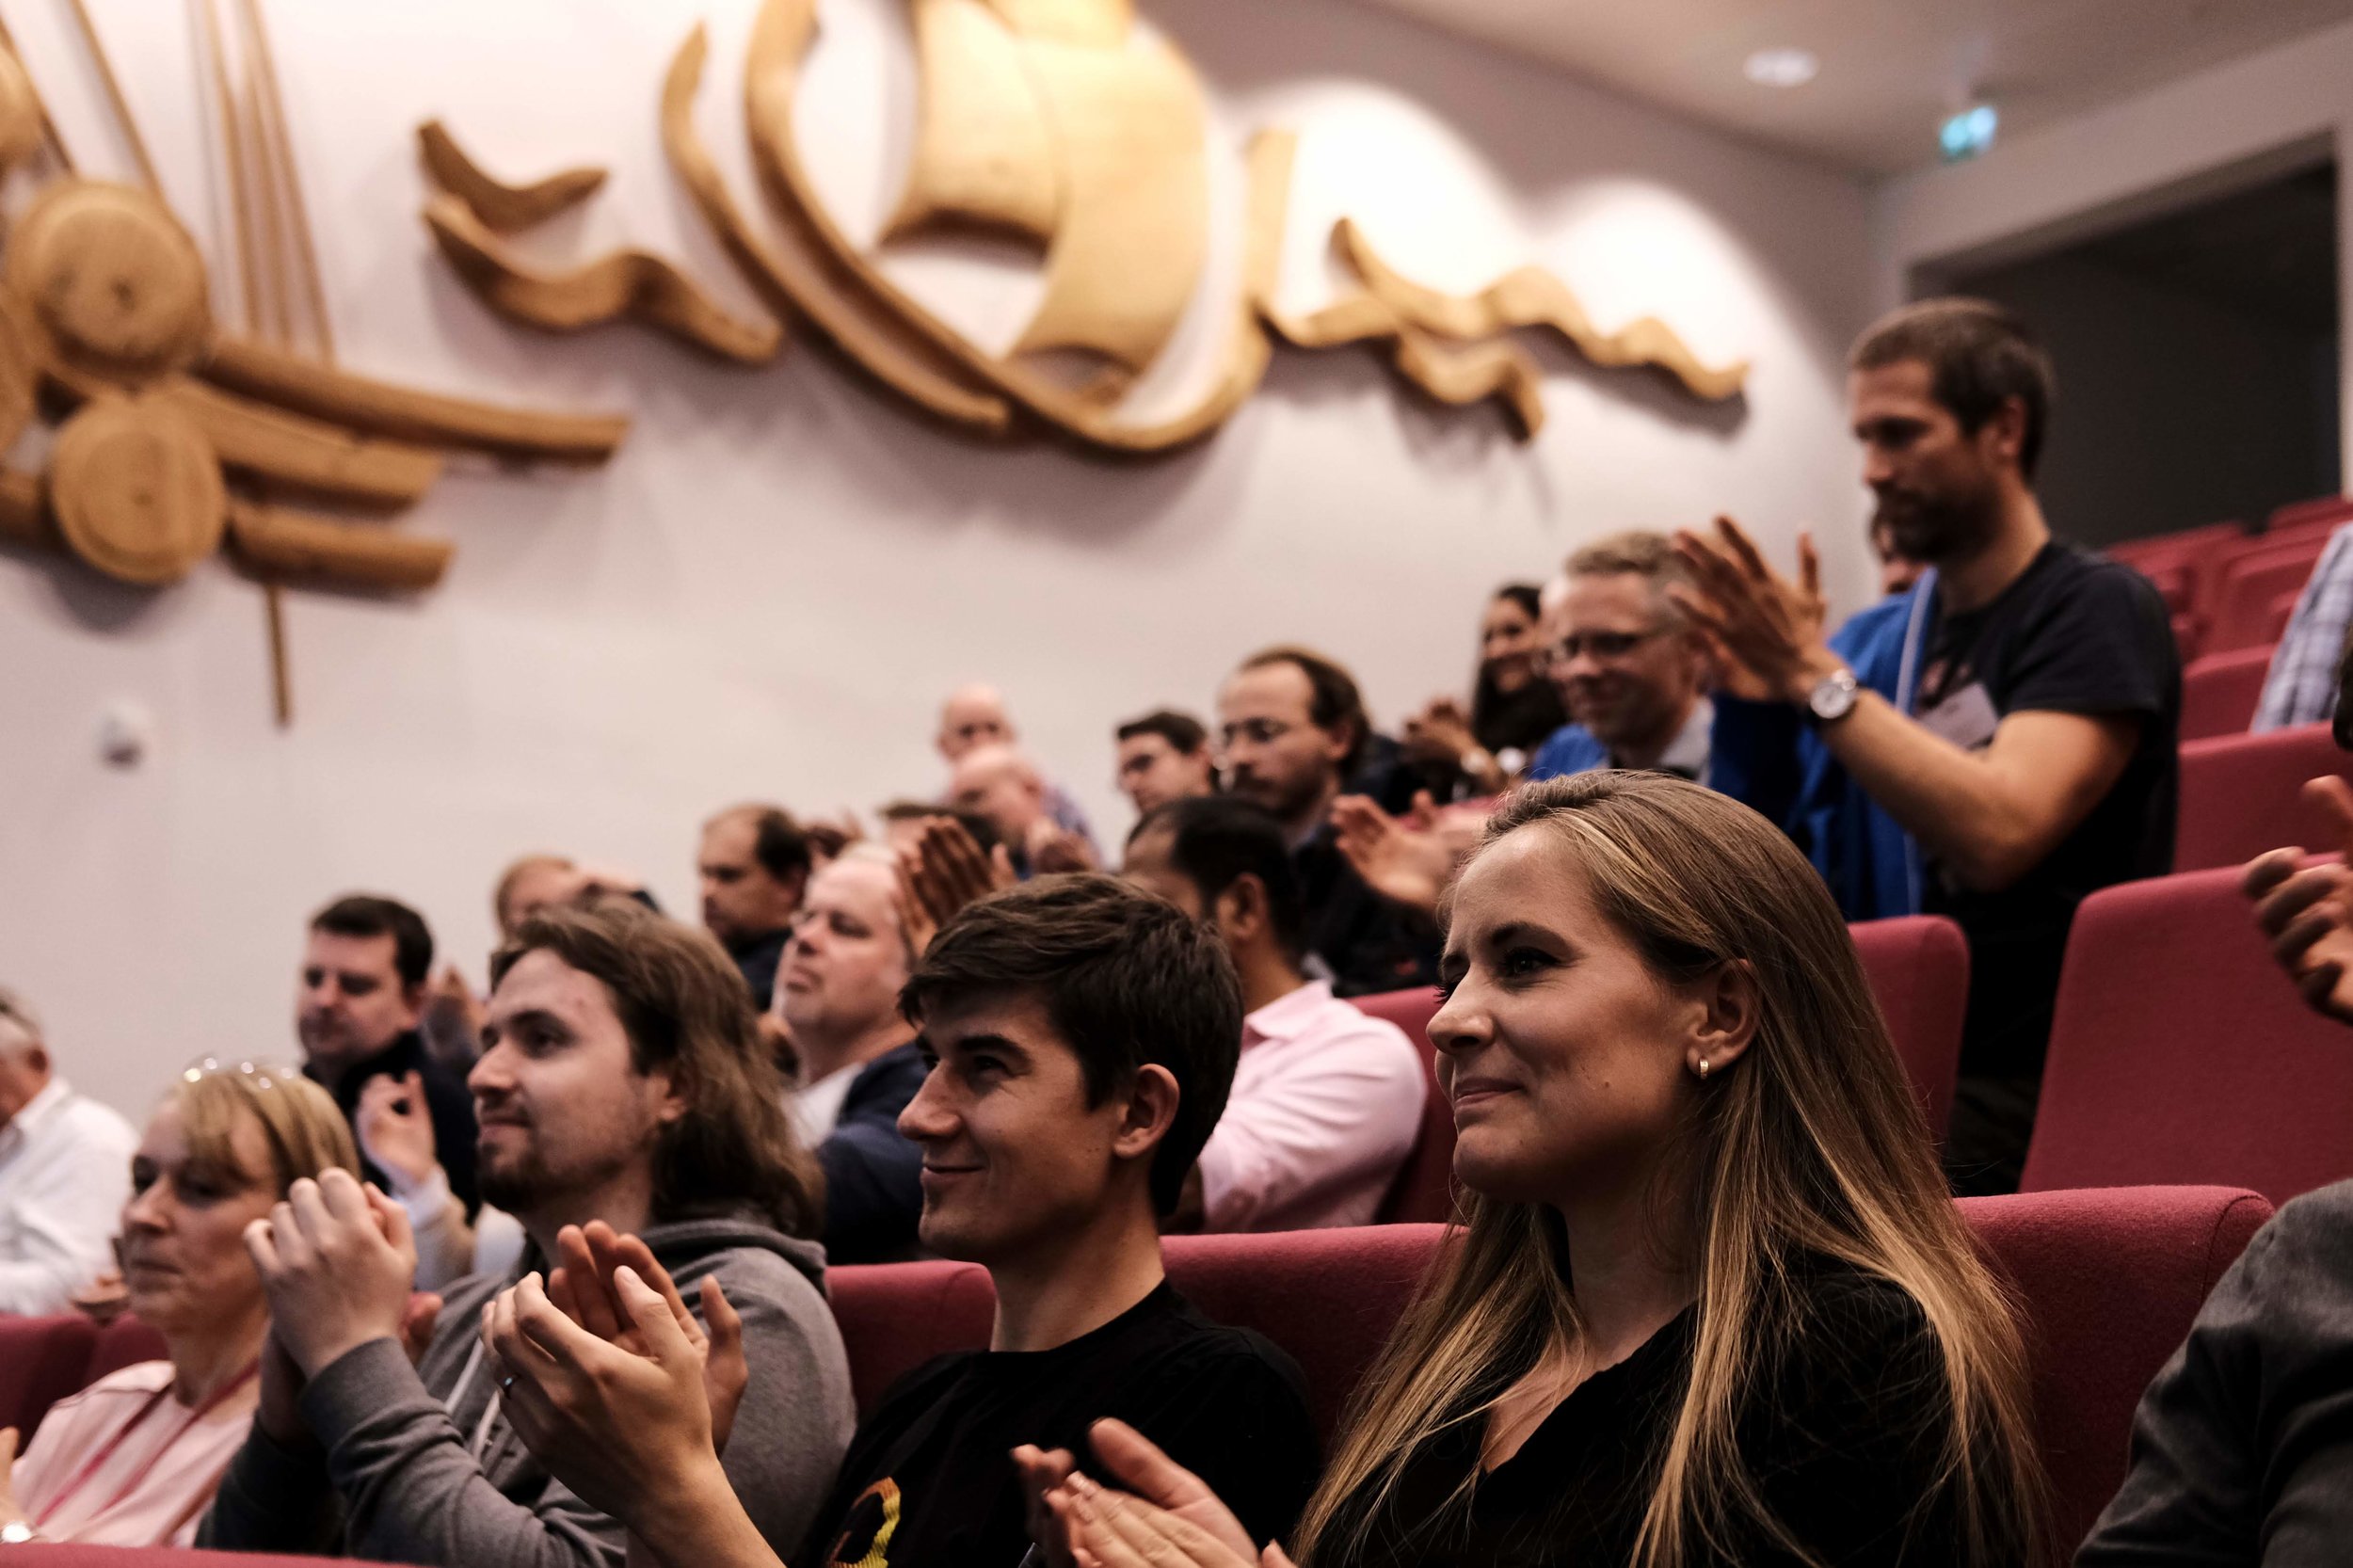
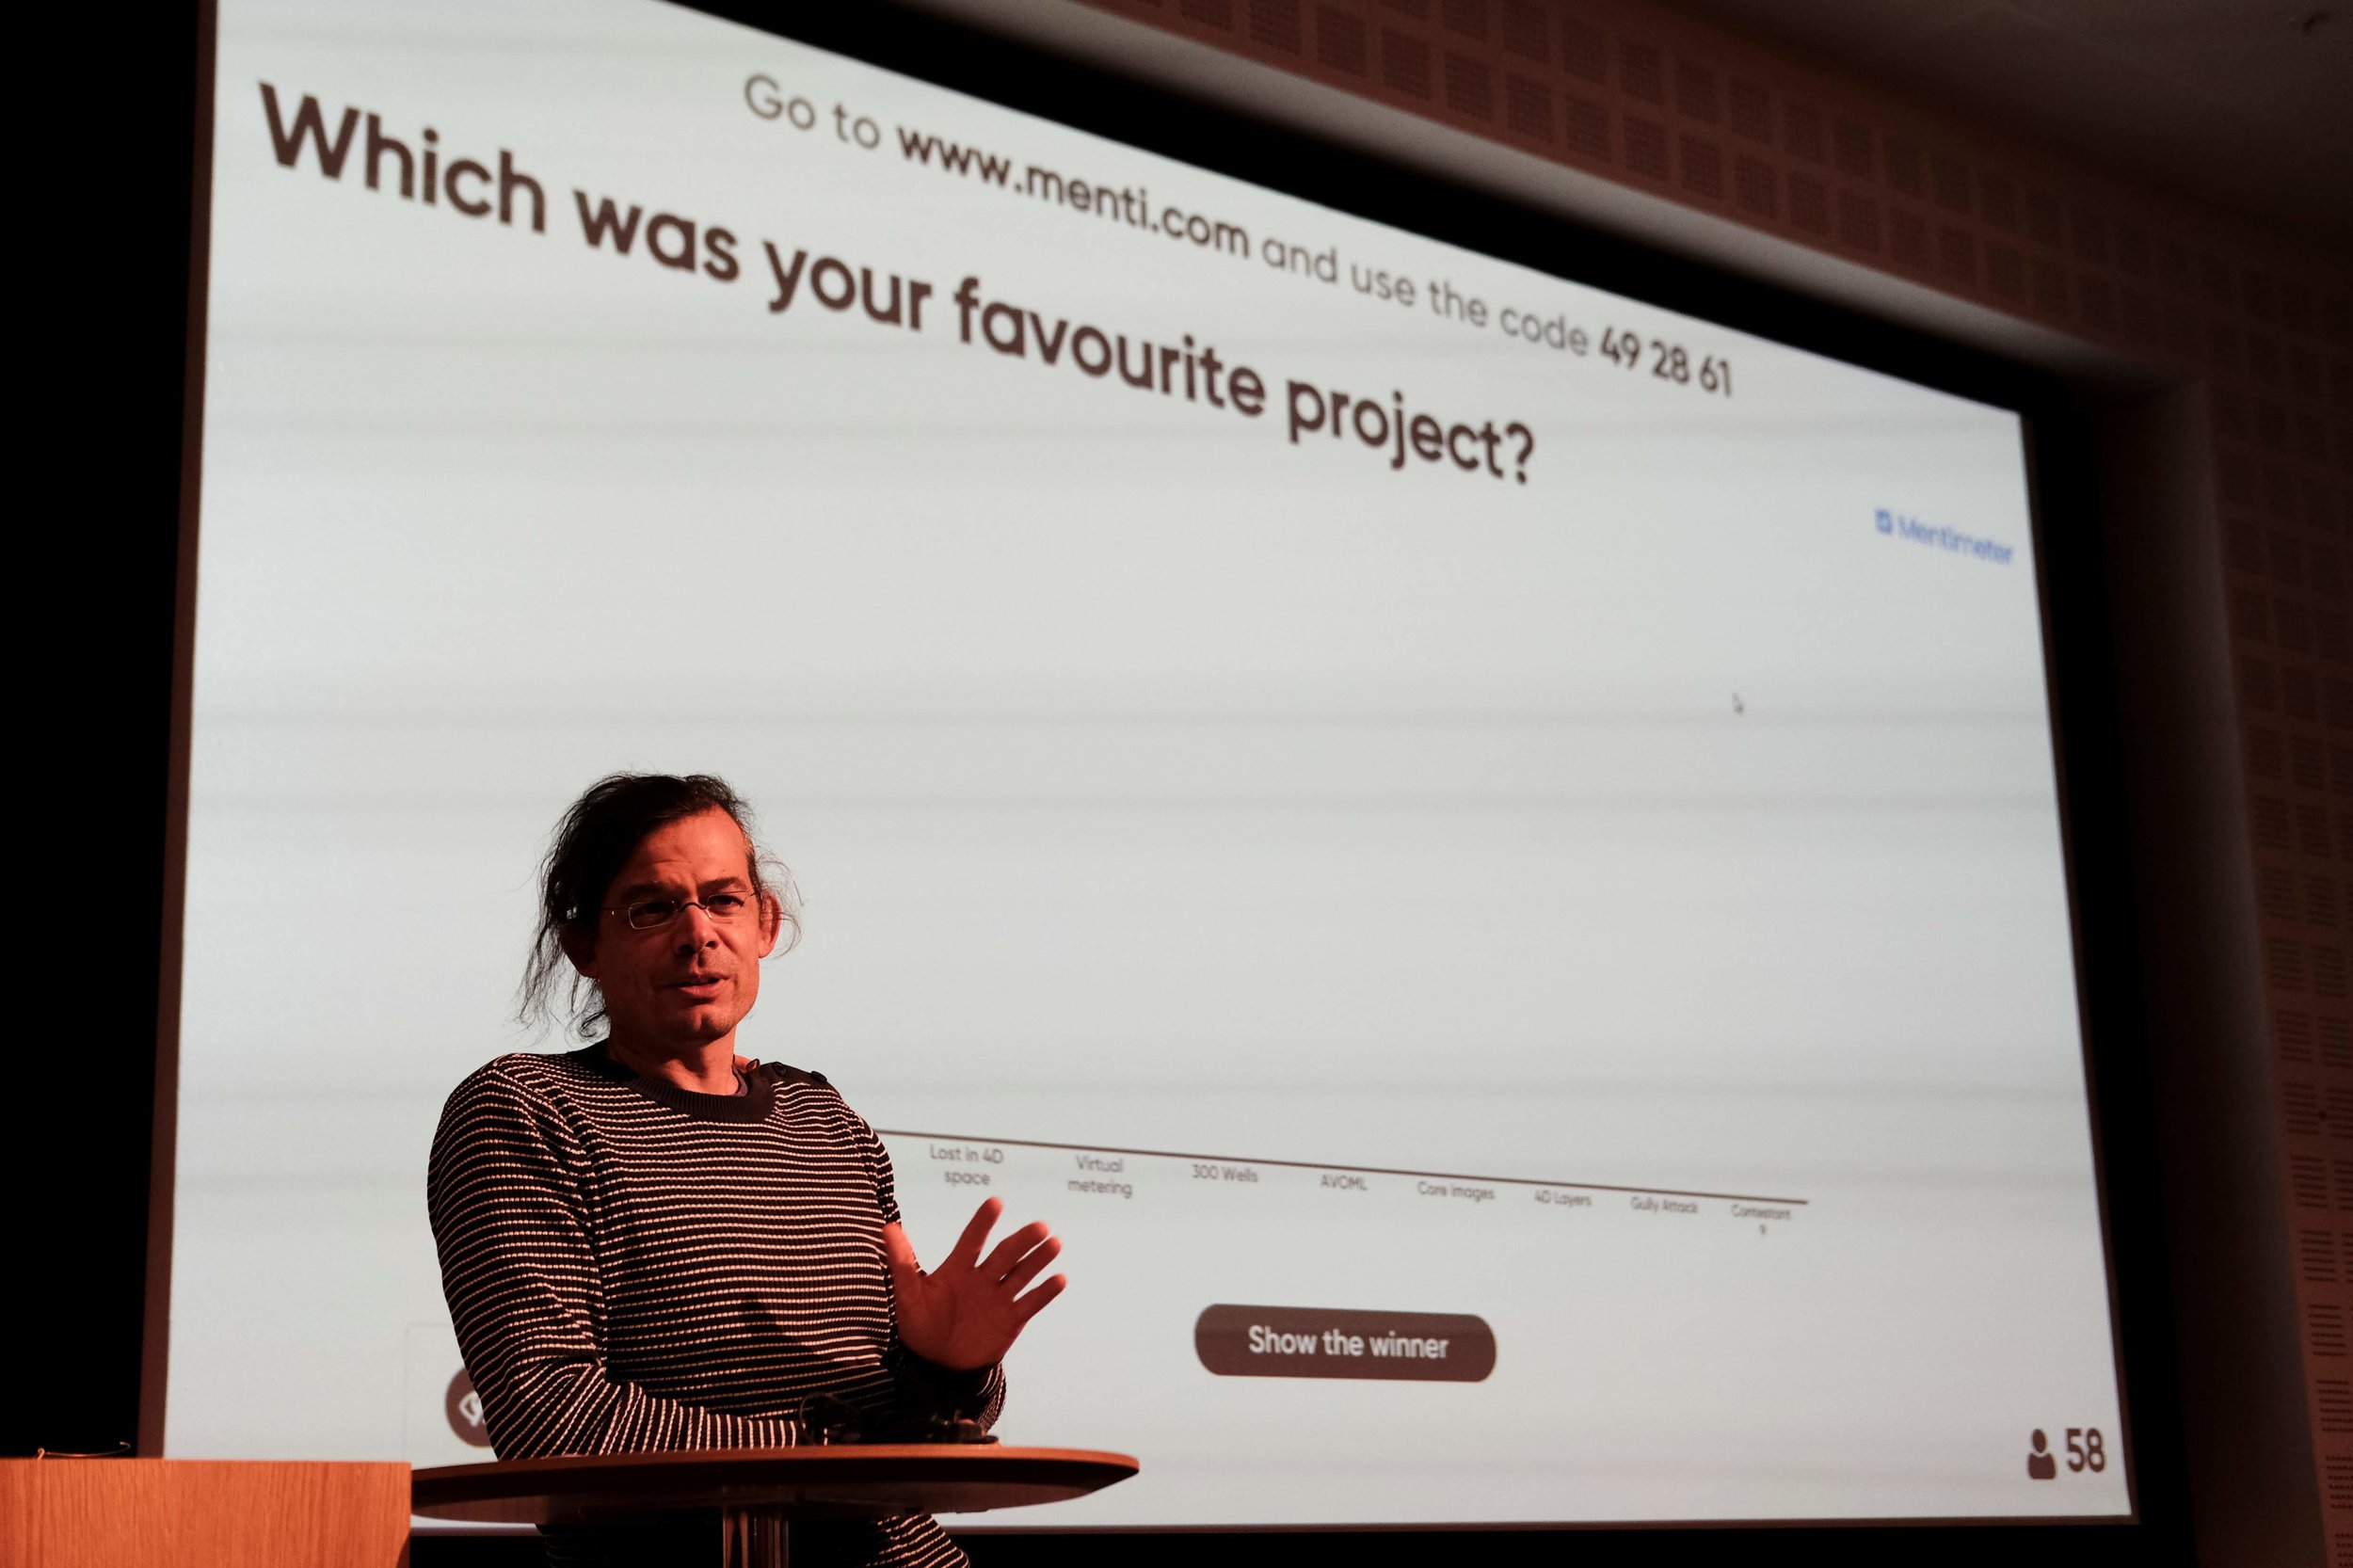
Get a flavour of the spectacularness in Alessandro Amato’s beautiful photographs:

Fifty geoscientists and engineers spent two days at the Norwegian Petroleum Directorate (NPD) in Stavanger. Our hosts were welcoming, accommodating, and generous with the waffles. As usual, we gently nudged the participants into teams, and encouraged them to define projects and find data to work on. It always amazes me how smoothly this potentially daunting task goes; I think this says something about the purposefulness and resourcefulness of our community.

Here’s a quick run-down of the projects:

  • Biostrat! Geological ages from species counts.

  • Lost in 4D Space. Pressure drawdown prediction.

  • Virtual Metering. Predicting wellhead pressure in real time.

  • 300 Wells. Extracting shows and uncertainty from well reports.

  • AVO ML. Unsupervised machine learning for more geological AVO.

  • Core Images. Grain size and lithology from core photos.

  • 4D Layers. Classification engine for 4D seismic data.

  • Gully Attack. Strat trap picking with deep reinforcement learning.

  • sketch2seis. Turning geological cartoons into seismic with pix2pix.

I will do a complete review of the projects in the coming few days, but notice the diversity here. Five of the projects straddle geological topics, and five are geophysical. Two or three involve petroleum engineering issues, while two or three move into sed/strat. We saw natural language processing. We saw random forests. We saw GANs, VAEs, and deep reinforcement learning. In terms of input data, we saw core photos, PDF reports, synthetic seismograms, real-time production data, and hastily assembled label sets. In short — we saw everything.

Takk skal du ha

Many thanks to everyone that helped the event come together:

  • Peter Bormann, the mastermind behind the symposium, was instrumental in making the hackathon happen.

  • Grete Block Vargle (AkerBP) and Pernille Hammernes (Equinor) kept everyone organized and inspired.

  • Tone Helene Mydland (NPD) and Soelvi Amundrud (NPD) made sure everything was logistically honed.

  • Eva Halland (NPD) supported the event throughout and helped with the judging.

  • Alessandro Amato del Monte (Eni) took some fantastic photos — as seen in this post.

  • Diego Castaneda and Rob Leckenby helped me on the Agile side of things, and helped several teams.

And a huge thank you to the sponsors of the event — too many to name, but here they all are:

all_small.png

There’s more to come!

If you’re reading this thinking, “I’d love to go to a geoscience hackathon”, and you happen to live in or near the UK, you’re in luck! There are two machine learning geoscience hackathons coming up this fall:

Don’t miss out! Get signed up and we’ll see you there.

How good is what?

Geology is a descriptive science, which is to say, geologists are label-makers. We record observations by assigning labels to data. Labels can either be numbers or they can be words. As such, of the numerous tasks that machine learning is fit for attacking, supervised classification problems are perhaps the most accessible – the most intuitive – for geoscientists. Take data that already has labels. Build a model that learns the relationships between the data and labels. Use that model to make labels for new data. The concept is the same whether a geologist or an algorithm is doing it, and in both cases we want to test how well our classifier is at doing its label-making.

2d_2class_classifier_left.png

Say we have a classifier that will tell us whether a given combination of rock properties is either a dolomite (purple) or a sandstone (orange). Our classifier could be a person named Sally, who has seen a lot of rocks, or it could be a statistical model trained on a lot of rocks (e.g. this one on the right). For the sake of illustration, say we only have two tools to measure our rocks – that will make visualizing things easier. Maybe we have the gamma-ray tool that measures natural radioactivity, and the density tool that measures bulk density. Give these two measurements to our classifier, and they return to you a label. 

How good is my classifier?

Once you've trained your classifier – you've done the machine learning and all that – you've got yourself an automatic label maker. But that's not even the best part. The best part is that we get to analyze our system and get a handle on how good we can expect our predictions to be. We do this by seeing if the classifier returns the correct labels for samples that it has never seen before, using a dataset for which we know the labels. This dataset is called validation data.

Using the validation data, we can generate a suite of statistical scores to tell us unambiguously how this particular classifier is performing. In scikit-learn, this information compiled into a so-called classification report, and it’s available to you with a few simple lines of code. It’s a window into the behaviour of the classifier that warrants deeper inquiry.

To describe various elements in a classification report, it will be helpful to refer to some validation data:

Our Two-class Classifier (left) has not seen the Validation Data (middle). We can calculate a classification report by Analyzing the intersection of the two (right).

Our Two-class Classifier (left) has not seen the Validation Data (middle). We can calculate a classification report by Analyzing the intersection of the two (right).

Accuracy is not enough

When people straight up ask about a model’s accuracy, it could be that they aren't thinking deeply enough about the performance of the classifier. Accuracy is a measure of the entire classifier. It tells us nothing about how well we are doing with one class compared to another, but there are other metrics that tell us this:

metric_definitions2.png

Support — how many instances there were of that label in the validation set.

Precision — the fraction of correct predictions for a given label. Also known as positive predictive value.

Recall — the proportion of the class that we correctly predicted. Also known as sensitivity.

F1 score — the harmonic mean of precision and recall. It's a combined metric for each class.

Accuracy – the total fraction of correct predictions for all classes. You can calculate this for each class, but it will be the same value for each of the class.   

DIY classification report

If you're like me and you find the grammar of true positives and false negatives confusing, it might help to to treat each class within the classifier as its own mini diagnostic test, and build up data for the classification report row by row. Then it's as simple as counting hits and misses from the validation data and computing some fractions. Inspired by this diagram on the Wikipedia page for the F1 score, I've given both text and pictorial versions of the equations:

dolomite_and_classifier_report_sheet.png

Have a go at filling in the scores for the two classes above. After that, fill in your answers into your own hand-drawn version of the empty table below. Notice that there is only a single score for accuracy for the entire classifier, and that there may be a richer story between the various other scores in the table. Do you want to optimize accuracy overall? Or perhaps you care about maximizing recall in one class above all else? What matters most to you? Should you penalize some mistakes stronger than others?

clf_report.png

When data sets get larger – by either increasing the number of samples, or increasing the dimensionality of the data – even though this scoring-by-hand technique becomes impractical, the implementation stays the same. In classification problems that have more than two classes we can add in a confusion matrix to our reporting, which is something that deserves a whole other post. 

Upon finishing logging a slab of core, if you were to ask Sally the stratigrapher, "How accurate are your facies?", she may dismiss your inquiry outright, or maybe point to some samples she's not completely confident in. Or she might tell you that she was extra diligent in the transition zones, or point to regions where this is very sandy sand, or this is very hydrothermally altered. Sadly, we in geoscience – emphasis on the science – seldom take the extra steps to test and report our own performance. But we totally could.

The ANSWERS. Upside Down. To two Decimal places.

The ANSWERS. Upside Down. To two Decimal places.

Life lessons from a neural network

The latest Geophysical Tutorial came out this week in The Leading Edge. It's by my friend Gram Ganssle, and it's about neural networks. Although the example in the article is not, strictly speaking, a deep net (it only has one hidden layer), it concisely illustrates many of the features of deep learning.

Whilst editing the article, it struck me that some of the features of deep learning are really features of life. Maybe humans can learn a few life lessons from neural networks! 

Seek nonlinearity

Activation functions are one of the most important ingredients in a neural network. They are the reason neural nets are able to learn complex, nonlinear relationships without a gigantic number of parameters.

Life lesson: look for nonlinearities in your life. Go to an event aimed at another profession. Take a new route to work. Buy a random volume at your local bookshop. Pick that ice-cream flavour you've never dared try (durian, anyone?).

Iterate

Neural networks learn by repetition. They start with random guesses about what might work, then they process each data point a hundred, maybe 100,000 times, check the answer, adjust weights, and get a little better each time. 

Life lesson: practice makes perfect. You won't get anything right the first time (if you do, celebrate!). The important thing is that you pay attention, figure out what to change, and tweak it. Then try again.

More data

One of the things we know for sure about neural networks is that they work best when they train on a lot of data. They need to see as much of the problem domain as possible, including the edge cases and the worst cases.

Life lesson: seek data. If you're a geologist, get out into the field and see more rocks. Geophysicists: look at more seismic. Whoever you are, read more. Afterwards, share what you find with others, and listen to what they have learned.

Stretch metaphors

Yes, well, I could probably go on. Convolutional networks teach us to create new things by mixing ideas from different parts of our experience. Long training times for neural nets teach us to be patient, and invest in GPUs. Hidden layers with many units teach us to... er, expect a lot of parameters in our lives...?

Anyway, the point is that life is like a neural net. Or maybe, no less interestingly, neural nets are like life. My impression is that most of the innovations in deep learning have come from people looking at their own interpretive and discriminatory powers and asking, "What do I do here? How do I make these decisions?" — and then trying to approximate that heuristic or thought process in code.

What's the lesson here? I have no idea. Enjoy your weekend!


Thumbnail image by Flickr user latteda, licensed CC-BY. The Leading Edge cover is copyright of SEG, fair use terms.

Results from the AAPG Machine Learning Unsession

Click here to visit the Google Doc write-up

Click here to visit the Google Doc write-up

Back in May, I co-hosted a different kind of conference session — an 'unsession' — at the AAPG Annual Conference and Exhibition in Salt Lake City, Utah. It was successful in achieving its main goal, which was to show the geoscience community and AAPG organizers a new way of collaborating, networking, and producing tangible outcomes from conference sessions.

It also succeeded in drawing out hundreds of ideas and questions around machine learning in geoscience. We have now combed over what the 120 people (roughly) produced on that afternoon, written it up in a Google Doc (right), and present some highlights right here in this post.

Click here to visit the Flickr photo album.

Click here to visit the Flickr photo album.

The unsession had three phases:

  1. Exploring current and future skills for geoscientists.

  2. Asking about the big questions in machine learning in geoscience.

  3. Digging into some of those questions.

Let's look at each one in turn.


skills_blog.jpg

Current and future skills

As an icebreaker, we asked everyone to list three skills they have that set them apart from others in their teams or organizations — their superpowers, if you will. They wrote these on green Post-It notes. We also asked for three more skills they didn't have today, but wanted to acquire in the next decade or so. These went on orange Post-Its. We were especially interested in those skills that felt intimidating or urgent. The 8 or 10 people at each table then shared these with each other, by way of introducing themselves.

The skills are listed in this Google Sheets document.

Unsurprisingly, the most common 'skills I have' were around geoscience: seismic interpretation, seismic analysis, stratigraphy, engineering, modeling, sedimentology, petrophysics, and programming. And computational methods dominated the 'skills I want' category: machine learning, Python, coding or programming, deep learning, statistics, and mathematics.

We followed this up with a more general question — How would you rate the industry's preparedness for this picture of the future, as implied by the skill gap we've identified?. People could substitute 'industry' for whatever similar scale institution felt meaningful to them. As shown (right), this resulted in a bimodal distribution: apparently there are two ways to think about the future of applied geoscience — this may merit more investigation with a more thorough survey.

Get the histogram data.

preparedness_histogram.png

Big questions in ML

After the icebreaker, we asked the tables to respond to a big question:

What are the most pressing questions in applied geoscience that can probably be tackled with machine learning?

We realized that this sounds a bit 'hammer looking for a nail', but justified asking the question this way by drawing an anology with other important new tools of the past — well logging, or 3D seismic, or sequence stratigrapghy. The point is that we have this powerful new (to us) set of tools; what are we going to look at first? At this point, we wanted people to brainstorm, without applying constraints like time or money.

This yielded approximately 280 ideas, all documented in the Google Sheet. Once the problems had been captured, the tables rotated so that each team walked to a neighboring table, leaving all their problems behind... and adopting new ones. We then asked them to score the new problems on two axes: scope (local vs global problems) and tractability (easy vs hard problems). This provided the basis for each table to choose one problem to take to the room for voting (each person had 9 votes to cast). This filtering process resulted in the following list:

  1. How do we communicate error and uncertainty when using machine learning models and solutions? 85 votes.

  2. How do we account for data integration, integrity, and provenance in our models? 78 votes.

  3. How do we revamp the geoscience curriculum for future geoscientists? 71 votes.

  4. What does guided, searchable, legacy data integration look like? 68 votes.

  5. How can machine learning improve seismic data quality, or provide assistive technology on poor data? 65 votes.

  6. How does the interpretability of machine learning model predictions affect their acceptance? 54 votes.

  7. How do we train a model to assign value to prospects? 51 votes.

  8. How do we teach artificial intelligences foundational geology? 45 votes.

  9. How can we implement automatic core description? 42 votes.

  10. How can we contain bad uses of AI? 40 votes.

  11. Is self-steering well drilling possible? 21 votes.

I am paraphrasing most of those, but you can read the originals in the Google Sheet data harvest.


Exploring the questions

In the final stage of the afternoon, we took the top 6 questions from the list above, and dug into them a little deeper. Tables picked their way through our Solution Sketchpads — especially updated for machine learning problems — to help them navigate the problems. Clearly, these questions were too enormous to make much progress in the hour or so left in the day, but the point here was to sound out some ideas, identify some possible actions, and connect with others interested in working on the problem.

One of the solution sketches is shown here (right), for the Revamp the geoscience curriculum problem. They discussed the problem animatedly for an hour.

This team included — among others — an academic geostatistician, an industry geostatistician, a PhD student, a DOE geophysicist, an SEC geologist, and a young machine learning brainbox. Amazingly, this kind of diversity was typical of the tables.

See the rest of the solution sketches in Flickr.


That's it! Many thanks to Evan Bianco for the labour of capturing and digitizing the data from the event. Thanks also to AAPG for the great photos, and for granting them an open license. And thank you to my co-chairs Brendon Hall and Yan Zaretskiy of Enthought, and all the other folks who helped make the event happen — see the Productive chaos post for details.

To dig deeper, look for the complete write up in Google Docs, and the photos in Flickr


calendar.png

Just a reminder... if it's Python and machine learning skills you want, we're running a Summer School in downtown Houston the week of 13 August. Come along and get your hands on the latest in geocomputing methods. Suitable for beginners or intermediate programmers.

Don't miss out! Find out more or register now.

Big open data... or is it?

Huge news for data scientists and educators. Equinor, the company formerly known as Statoil, has taken a bold step into the open data arena. On Thursday last week, it 'disclosed' all of its subsurface and production data for the Volve oil field, located in the North Sea. 

What's in the data package?

A lot! The 40,000-file package contains 5TB of data, that's 5,000GB!

volve_data.png

This collection is substantially larger, both deeper and broader, than any other open subsurface dataset I know of. Most excitingly, Equinor has released a broad range of data types, from reports to reservoir models: 3D and 4D seismic, well logs and real-time drilling records, and everything in between. The only slight problem is that the seismic data are bundled in very large files at the moment; we've asked for them to be split up.

Questions about usage rights

Regular readers of this blog will know that I like open data. One of the cornerstones of open data is access, and there's no doubt that Equinor have done something incredible here. It would be preferable not to have to register at all, but free access to this dataset — which I'm guessing cost more than USD500 million to acquire — is an absolutely amazing gift to the subsurface community.

Another cornerstone is the right to use the data for any purpose. This involves the owner granting certain privileges, such as the right to redistribute the data (say, for a class exercise) or to share derived products (say, in a paper). I'm almost certain that Equinor intends the data to be used this way, but I can't find anything actually granting those rights. Unfortunately, if they aren't explicitly granted, the only safe assumption is that you cannot share or adapt the data.

For reference, here's the language in the CC-BY 4.0 licence:


Subject to the terms and conditions of this Public License, the Licensor hereby grants You a worldwide, royalty-free, non-sublicensable, non-exclusive, irrevocable license to exercise the Licensed Rights in the Licensed Material to:

  1. reproduce and Share the Licensed Material, in whole or in part; and
  2. produce, reproduce, and Share Adapted Material.
 

You can dig further into the requirements for open data in the Open Data Handbook.

The last thing we need is yet another industry dataset with unclear terms, so I hope Equinor attaches a clear licence to this dataset soon. Or, better still, just uses a well-known licence such as CC-BY (this is what I'd recommend). This will clear up the matter and we can get on with making the most of this amazing resource.

More about Volve

The Volve field was discovered in 1993, but not developed until 15 years later. It produced oil and gas for 8.5 years, starting on 12 February 2008 and ending on 17 September 2016, though about half of that came in the first 2 years (see below). The facility was the Maersk Inspirer jack-up rig, standing in 80 m of water, with an oil storage vessel in attendance. Gas was piped to Sleipner A. In all, the field produced 10 million Sm³ (63 million barrels) of oil, so is small by most standards, with a peak rate of 56,000 barrels per day.

Volve production over time in standard m³ (i.e. at 20°C). Multiply by 6.29 for barrels.

Volve production over time in standard m³ (i.e. at 20°C). Multiply by 6.29 for barrels.

The production was from the Jurassic Hugin Formation, a shallow-marine sandstone with good reservoir properties, at a depth of about 3000 m. The top reservoir depth map from the discovery report in the data package is shown here. (I joined Statoil in 1997, not long after this report was written, and the sight of this page brings back a lot of memories.)


The top reservoir depth map from the discovery report. The Volve field (my label) is the small closure directly north of Sleipner East, with 15/9-19 well on it.


Get the data

To explore the dataset, you must register in the 'data village', which Equinor has committed to maintaining for 2 years. It only takes a moment. You can get to it through this link.

Let us know in the comments what you think of this move, and do share what you get up to with the data!

An invitation to start something

Most sessions at your average conference are about results — the conclusions and insights from completed research projects. But at AAPG this year, there's another kind of session, about beginnings. The 'Unsession' is back!

   Machine Learning Unsession
   Room 251 B/C, 1:15 pm, Wednesday 23 May

The topic is machine learning in geoscience. My hope is that there's a lot of emphasis on geological problems, especially in stratigraphy. But we don't know exactly where it will go, because the participants themselves will determine the topic and direction of the session.

Importantly, most of the session will not involve technical discussion. It's not a computational geology session. It's a session for everyone — we absolutely need input from anyone who's interested in how computers can help us do geoscience.

What to expect

Echoing our previous unconference-style sessions, here's the vibe my co-hosts (Brendon Hall and Yan Zaretskiy of Enthought) and I are going for:

  • Conferences are too one-way, too passive. We want more action, more tangible outcomes.
  • We want open, honest, inclusive conversations about our science, and our technical challenges. Bring your most courageous, opinionated, candid self. The stuff you’re scared to mention, or you’d normally only talk about over a beer? Bring that.
  • Listen with an open mind. The minute you think you’re right, you’ve checked out of the conversation.
  • Whoever shows up — they are the right people. (This is a rule of Open Space Technology.)
  • What happens is the only thing that could have happened. (This is a rule of Open Space Technology.)
  • There is no finish line; when it's over, it's over.
  • What we are doing is not definitive. It's just a thing that we're doing.

The session is an experiment. Failure is most definitely an option, just the least desirable one. Conversely, perfection is the least likely outcome.

If you're going to AAPG this year, I hope you'll come along to this conversation. Bring a friend!


Here's a reminder of the very first Unsession that Evan and I facilitated, way back in 2013. Argh, that's 5 years ago...

Digitalization... of what?

I've been hearing a lot about 'digitalization', or 'digital transformation', recently. What is this buzzword?

The general idea seems to be: exploit lots and lots of data (which we already have), with analytics and machine learning probably, to do a better job finding and producing fuel and energy safely and responsibly.

At the centre of it all is usually data. Lots of data, usually in a lake. And this is where it all goes wrong. Digitalization is not about data. And it's not about technology either. Or cloud. Or IoT.

Interest in the terms "digital transformation" and "digitalization" since 2004, according to Google Trends. The data reveal a slight preference for the term "digitalization" in central and northern Europe. Google Ngram Viewer indicates that the…

Interest in the terms "digital transformation" and "digitalization" since 2004, according to Google Trends. The data reveal a slight preference for the term "digitalization" in central and northern Europe. Google Ngram Viewer indicates that the term "digitalization" has been around for over 100 years, but it is also a medical term connected with the therapeutic use of digitalis. Just to be clear, that's not what we're talking about.

It's about people

Oh no, here I go with the hand-wavy, apple-pie "people not process" nonsense... well, yes. I'm convinced that it's humans we're transforming, not data or technology. Or clouds. Or Things.

I think it's worth spelling out, because I think most corporations have not grasped the human aspect yet. And I don't think it's unreasonable to say that petroleum has a track record of not putting people at the centre of its activities, so I worry that this will happen again. This would be bad, because it might mean that digitalization not only fails to get traction — which would be bad enough because this revolution is long overdue — but also that it causes unintended problems.

Without people, digital transformation is just another top-down 'push' effort, with too much emphasis on supply. I think it's smarter to create demand, or 'pull', so that professionals are asking for support, and tools, and databases, and are engaged in how those things are created.

Put technical professionals at the heart of the revolution, and the rest will follow. The inverse is not true.

Strategies

This is far from an exhaustive list, but here are some ideas for ways to get ahead in digital transformation:

  • Make it easy for digitally curious people to dip a toe in. Build a beginner-friendly computing environment, and encourage people to use it. Challenge your IT people to support a culture of experimentation and creativity. 
  • Give those curious professionals access to professional development channels, whether it's our courses, other courses, online channels like Lynda.com or Coursera, or whatever. 
  • Build a community of practice for 'scientific computing'. Whether it's a Yammer group or something more formal, be sure to encourage frequent face-to-face meetups, and perhaps an intranet portal.
  • Start to connect subsurface professionals with software engineers, especially web programmers and data scientists, elsewhere in the organization. I think the best way is to embed programmers into technical teams. 
  • Encourage participation in external channels like conferences and publications, data science contests, hackathons, open source projects, and so on. I guarantee you'll see a step change in skills and enthusiasm.

The bottom line is that we're looking for a profound culutral change. It will be slow. More than that, it needs to be slow. It might only take a year or two to get traction for an idea like "digital first". But deeper concepts, like "machine readable microservices" or "data-driven decisions" or "reproducible workflows", must take longer because you can't build that high without a solid foundation. Successfully applying specific technologies like deep learning, augmented reality, or blockchain, will certainly require a high level of technology literacy, and will take years to get right.

What's going on with scientific computing in your organization? Are you 'digitally curious'? Do you feel well-supported? Do you know others in your organization like you?


The circuit board image in the thumbnail for this post is by Carl Drougge, licensed CC-BY-SA.