
K is for Wavenumber
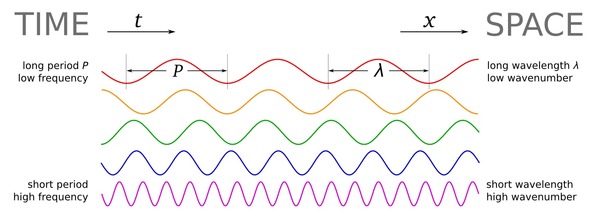
/Wavenumber, sometimes called the propagation number, is in broad terms a measure of spatial scale. It can be thought of as a spatial analog to the temporal frequency, and is often called spatial frequency. It is often defined as the number of wavelengths per unit distance, or in terms of wavelength, λ:
$$k = \frac{1}{\lambda}$$
The units are \(\mathrm{m}^{–1}\), which are nameless in the International System, though \(\mathrm{cm}^{–1}\) are called kaysers in the cgs system. The concept is analogous to frequency \(f\), measured in \(\mathrm{s}^{–1}\) or Hertz, which is the reciprocal of period \(T\); that is, \(f = 1/T\). In a sense, period can be thought of as a temporal 'wavelength' — the length of an oscillation in time.
If you've explored the applications of frequency in geophysics, you'll have noticed that we sometimes don't use ordinary frequency f, in Hertz. Because geophysics deals with oscillating waveforms, ones that vary around a central value (think of a wiggle trace of seismic data), we often use the angular frequency. This way we can also express the close relationship between frequency and phase, which is an angle. So in many geophysical applications, we want the angular wavenumber. It is expressed in radians per metre:
$$k = \frac{2\pi}{\lambda}$$
The relationship between angular wavenumber and angular frequency is analogous to that between wavelength and ordinary frequency — they are related by the velocity V:
$$k = \frac{\omega}{V}$$
It's unfortunate that there are two definitions of wavenumber. Some people reserve the term spatial frequency for the ordinary wavenumber, or use ν (that's a Greek nu, not a vee — another potential source of confusion!), or even σ for it. But just as many call it the wavenumber and use k, so the only sure way through the jargon is to specify what you mean by the terms you use. As usual!
Just as for temporal frequency, the portal to wavenumber is the Fourier transform, computed along each spatial axis. Here are two images and their 2D spectra — a photo of some ripples, a binary image of some particles, and their fast Fourier transforms. Notice how the more organized image has a more organized spectrum (as well as some artifacts from post-processing on the image), while the noisy image's spectrum is nearly 'white':

Explore our other posts about scale.
The particle image is from the sample images in FIJI. The FFTs were produced in FIJI.
Update
on 2012-05-03 16:41 by Matt Hall
Following up on Brian's suggesstion in the comments, I added a brief workflow to the SubSurfWiki page on wavenumber. Please feel free to add to it or correct it if I messed anything up.


 Except where noted, this content is licensed