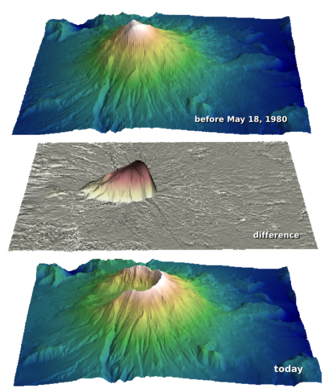
How much rock was erupted from Mt St Helens?
/ One of the reasons we struggle when learning a new skill is not necessarily because this thing is inherently hard, or that we are dim. We just don't yet have enough context for all the connecting ideas to, well, connect. With this in mind I wrote this introductory demo for my Creative Geocomputing class, and tried it out in the garage attached to START Houston, when we ran the course there a few weeks ago.
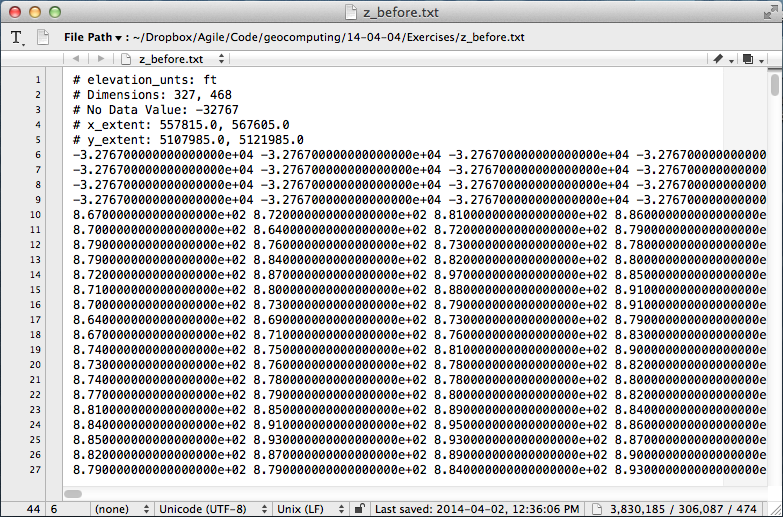
I walked through the process of transforming USGS text files to data graphics. The motivation was to try to answer the question: How much rock was erupted from Mount St Helens?
This gorgeous data set can be reworked to serve a lot of programming and data manipulation practice, and just have fun solving problems. My goal was to maintain a coherent stream of instructions, especially for folks who have never written a line of code before. The challenge, I found, is anticipating when words, phrases, and syntax are being heard like a foriegn language (as indeed they are), and to cope by augmenting with spoken narrative.
Text file to 3D plot
 To start, we'll import a code library called NumPy that's great for crunching numbers, and we'll abbreviate it with the nickname
 np:
>>> import numpy as np
Then we can use one of its functions to load the text file into an array we'll call data:
>>> data = np.loadtxt('z_after.txt')
The variable data is a 2-dimensional array (matrix) of numbers. It has an attribute that we can call upon, called shape, that holds the number of elements it has in each dimension,
>>> data.shape
(1370, 949)
If we want to make a plot of this data, we might want to take a look at the range of the elements in the array, we can call the peak-to-peak method on data,
>>> data.ptp()
41134.0
Whoa, something's not right, there's not a surface on earth that has a min to max elevation that large. Let's dig a little deeper. The highest point on the surface is,
>>> np.amax(data)
8367.0
Which looks to the adequately trained eye like a reasonable elevation value with units of feet. Let's look at the minimum value of the array,
>>> np.amin(data)
-32767.0
 OK, here's the problem. GIS people might recognize this as a null value for elevation data, but since we aren't assuming any knowledge of GIS formats and data standards, we can simply replace the values in the array with not-a-number (NaN), so they won't contaminate our plot.
>>> data[data==-32767.0] = np.nan
To view this surface in 3D we can import the mlab module from Mayavi,
>>> from mayavi import mlab
Finally we call the surface function from mlab, and pass the input data, and a colormap keyword to activate a geographically inspired colormap, and a vertical scale coefficient.
>>> mlab.surf(data,
              colormap='gist_earth',
              warp_scale=0.05)
After applying the same procedure to the pre-eruption digits, we're ready to do some calculations and visualize the result to reveal the output and its fascinating characteristics. Read more in the IPython Notebook.
If this 10 minute introduction is compelling and you'd like to learn how to wrangle data like this, sign up for the two-day version of this course next week in Calgary.


 Except where noted, this content is licensed