
Source rocks from seismic
/ A couple of years ago, Statoil's head of exploration research, Ole Martinsen, told AAPG Explorer magazine about a new seismic analysis method. Not just another way to discriminate between sand and shale, or water and gas, this was a way to assess source rock potential. Very useful in under-explored basins, and Statoil developed it for that purpose, but only the very last sentence of the Explorer article hints at its real utility today: shale gas exploration.
Calling the method Source Rocks from Seismic, Martinsen was cagey about details, but the article made it clear that it's not rocket surgery: “We’re using technology that would normally be used, say, to predict sandstone and fluid content in sandstone,” said Marita Gading, a Statoil researcher. Last October Helge Løseth, along with Gading and others, published a complete account of the method (Løseth et al, 2011).
Because they are actively generating hydrocarbons, source rocks are usually overpressured. Geophysicists have used this fact to explore for overpressured zones and even shale before. For example, Mukerji et al (2002) outlined the rock physics basis for low velocities in overpressured zones. Applying the physics to shales, Liu et al (2007) suggested a three-step process for evaluating source rock potential in new basins: 1 Sequence stratigraphic interpretation; 2 Seismic velocity analysis to determine source rock thickness; 3 Source rock maturity prediction from seismic. Their method is also a little hazy, but the point is that people are looking for ways to get at source rock potential via seismic data.
The Løseth et al article was exciting to see because it was the first explanation of the method that Statoil had offered. This was exciting enough that the publication was even covered by Greenwire, by Paul Voosen (@voooos on Twitter). It turns out to be fairly straightforward: acoustic impedance (AI) is inversely and non-linearly correlated with total organic carbon (TOC) in shales, though the relationship is rather noisy in the paper's examples (Kimmeridge Clay and Hekkingen Shale). This means that an AI inversion can be transformed to TOC, if the local relationship is known—local calibration is a must. This is similar to how companies estimate bitumen potential in the Athabasca oil sands (e.g. Dumitrescu 2009).
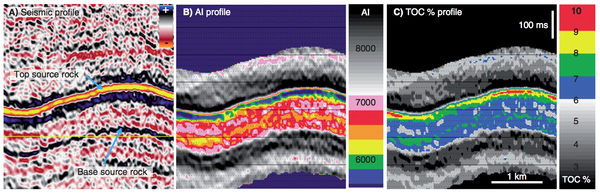 Figure 6 from Løseth et al (2011). A Seismic section. B Acoustic impedance. C Inverted seismic section where source rock interval is converted to total organic carbon (TOC) percent. Seismically derived TOC percent values in source rock intervals can be imported to basin modeling software to evaluate hydrocarbon generation potential of a basin. Click for full size..The result is that thick rich source rocks tend to have strong negative amplitude at the top, at least in subsiding mud-rich basins like the North Sea and the Gulf of Mexico. Of course, amplitudes also depend on stratigraphy, tuning, and so on. The authors expect amplitudes to dim with offset, because of elastic and anisotropic effects, giving a Class 4 AVO response.
This is a nice piece of work and should find application worldwide. There's a twist though: if you're interested in trying it out yourself, you might be interested to know that it is patent-pending:
WO/2011/026996
INVENTORS: Løseth, H; Wensaas, L; Gading, M; Duffaut, K; Springer, HM
Method of assessing hydrocarbon source rock candidate
A method of assessing a hydrocarbon source rock candidate uses seismic data for a region of the Earth. The data are analysed to determine the presence, thickness and lateral extent of candidate source rock based on the knowledge of the seismic behaviour of hydrocarbon source rocks. An estimate is provided of the organic content of the candidate source rock from acoustic impedance. An estimate of the hydrocarbon generation potential of the candidate source rock is then provided from the thickness and lateral extent of the candidate source rock and from the estimate of the organic content.
References
Dumitrescu, C (2009). Case study of a heavy oil reservoir interpretation using Vp/Vs ratio and other seismic attributes. Proceedings of SEG Annual Meeting, Houston. Abstract is online.
Liu, Z, M Chang, Y Zhang, Y Li, and H Shen (2007). Method of early prediction on source rocks in basins with low exploration activity. Earth Science Frontiers 14 (4), p 159–167. DOI 10.1016/S1872-5791(07)60031-1
Løseth, H, L Wensaas, M Gading, K Duffaut, and M Springer (2011). Can hydrocarbon source rocks be identified on seismic data? Geology 39 (12) p 1167–1170. First published online 21 October 2011. DOI 10.1130/G32328.1
Mukerji, T, Dutta, M Prasad, J Dvorkin (2002). Seismic detection and estimation of overpressures. CSEG Recorder, September 2002. Part 1 and Part 2 (Dutta et al, same issue).
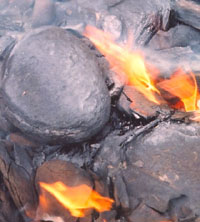
The figure is reproduced from Løseth et al (2011) according to The Geological Society of America's fair use guidelines. Thank you GSA! The flaming Kimmeridge Clay photograph is public domain.


 Except where noted, this content is licensed