
The geospatial sport
/An orienteer leaving a control site.
If you love studying maps or solving puzzles, and you love being outside, then orienteering — the thinking runner's sport — might be the sport you've been looking for.
There are many, many flavours of orienteering (on foot, on skis, in kayaks, etc), but here's how it generally works:
- Competitors make their way to an event, perhaps on a weekday evening, maybe a weekend morning.
- Several courses are offered, varying in length (usually 2 to 12 km) and difficulty (from walk-in-the-park to he's-still-not-back-call-search-and-rescue).
- A course consists of about 20 or so 'controls', which must be visited in order. Visits are recorded on an electronic 'dibber' carried by the orienteer, or by shapes punched on a card.
- Each person chooses a course , and is allotted a start time.
- You can't see your course — or the map — until you start. You have 0 seconds to prepare.
- You walk or run or ski or bike around the controls, at various speeds and in various (occasionally incorrect) directions.
- After making it to the finish, everyone engages in at least 30 minutes of analysis and dissection of route choices and split times, while eating everything in sight.
The catch is that your navigation system is entirely analog: you are only allowed a paper map and an analog compass, plus a whistle for safety. The only digital components are the timing system and the map-making process — which starts with LiDAR and ends in a software package like OCAD or OOM.
Orienteering maps are especially awesome. They are usually made especially for the sport, typically at 1:5000 or 1:7500, with a 2.5 m or 5 m contour interval. Many small features are mapped, for example walls and fences, small pits and mounds, and even individual trees and boulders.
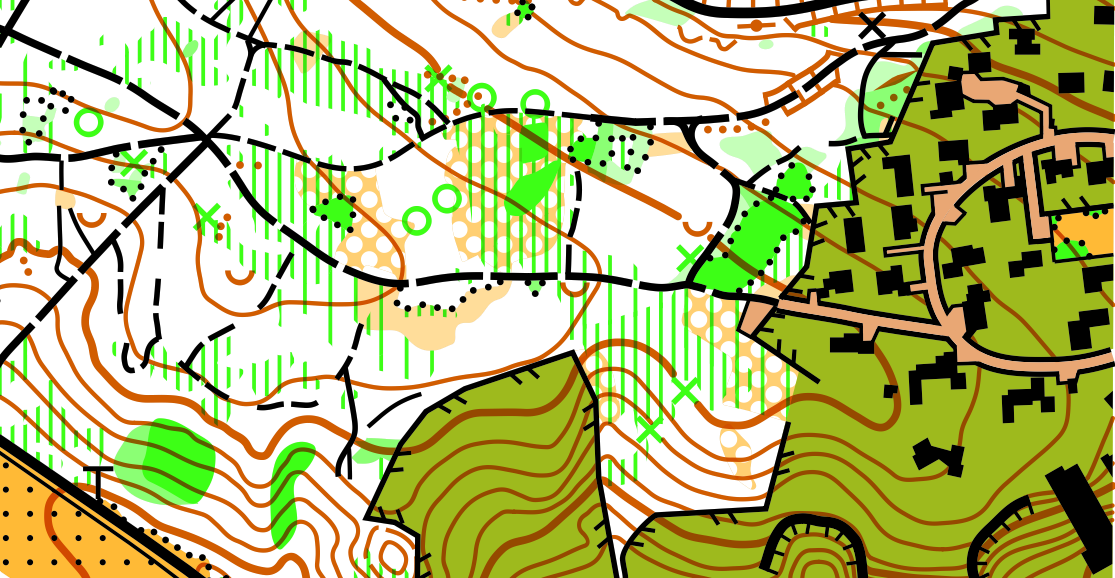
The sample orienteering map from the Open Orienteering Mapper software, licensed GNU GPL. White areas correspond to open, runnable (high velocity) woodland, with darker shades of green indicating slower running. Yellow areas are open. Olive green areas are out of bounds.
Other than the contours and paths, the most salient feature is usually the vegetation, which is always carefully mapped. Geophysicists will like this: the colours correspond more to the speed with which you can run than to the type of vegetation. Orienteering maps are velocity maps!
Here's part of another map, this one from Debert, Nova Scotia:

So, sporty cartophile friends, I urge you to get out and give it a try. My family loves it because it's something we can do together — we all get to compete on our own terms, with our own peers, and there's a course for everyone. I'm coming up on 26 years in the sport, and every event is still a new adventure!
World Orienteering Day — really a whole week — is in the last week in May. It's a great time to give orienteering a try. There are events all over the world, but especially in Europe. If you can't find one near you, track down your national organization and check for events near you.


 Except where noted, this content is licensed