Survival of the fittest or overcrowding?

If you’ve been involved in drilling boreholes in your career, you’ll be familiar with desurvey. Desurvey is the process of converting a directional well survey — which provides measured depth, inclination and azimuth points from the borehole — into a position log. The position log is an arbitrarily finely sampled set of (x, y, z) points along the wellbore. We need this to convert from measured depth (distance along the borehole path) to depth in the earth, which is usually given relative to mean sea-level.

I hunted around recently and found no fewer than nine Python packages that contain desurvey code. They are of various vintages and licences:

Other larger tools that contain desurvey code but not as re-usable

This is amazing — look at all the activity in the last 2 years or so! I think this is a strong sign that we've hit a new era in geocomputing. Fifteen years ago a big chunk of the open source geoscience stuff out there was the ten-or-so seismic processing libraries. Then about 7 or 8 years ago there was a proliferation of geophysical modeling and inversion tools. Now perhaps we're seeing the geological and wells communities entering the same stage of evolution. This is encouraging.

What now?

But there’s a problem here too. — this is a small community, with limited resources. Can we afford this diversity? I accept that there might be a sort of Cambrian explosion event that has to happen with new technology. But how can we ensure that it results in an advantageous “survival of the fittest” ecology, and avoid it becoming just another way for the community to spread itself too thinly? To put it another way, how can we accelerate the evolutionary process, so that we don’t drain the ecosystem of valuable resources?

There’s also the problem of how to know which of these tools is the fittest. As far as I’m aware, there are no well trajectory benchmarks to compare against. Some of the libraries I listed above do not have rigorous tests, certainly they all have bugs (it’s software) — how can we ensure quality emerges from this amazing pool of technology?

I don’t know, but I think this is a soluble problem. We’ve done the hard part! Nine times :D


swung_round_135px.png

There was another sign of subsurface technology maturity in the TRANSFORM conference this year. Several of the tutorials and hackathon projects were focused on integrating tools like GemPy, Devito, segyio, and the lasio/welly/striplog family. This is exciting to see — 2021 could be an important year in the history of the open subsurface Python stack. Stay tuned!

Openness is a two-way street

Last week the Data Analysis Study Group of the SPE Gulf Coast Section announced a new machine learning contest (I’m afraid registration is now closed, even though the contest has not started yet). The task is to predict shear-wave sonic from other logs, similar to the SPWLA PDDA contest last year. This is a valuable problem in the subsurface, because shear sonic log is essential for computing elastic properties of rocks and therefore in predicting rock and fluid properties or processing seismic. Indeed, TGS have built a business on predicted logs with their ARLAS product. There’s money in log prediction!

The task looks great, but there’s one big problem: the dataset is not open.

Why is this a problem?

Before answering that, let’s look at some context.

What’s a machine learning contest?

Good question. Typically, an organization releases a dataset (financial timeseries, Netflix viewer data, medical images, or whatever). They invite people to predict some valuable property (when to sell, which show to recommend, how to treat the illness, or whatever). And they pick the best, measured against known labels on a hidden dataset.

Kaggle is one of the largest platforms hosting such challenges, and they often attract thousands of participants — competing for large prizes. TGS ran a seismic salt-picking contest on the platform, attracting almost 74,000 submissions from 3220 teams with a $100k prize purse. Other contests are more grass-roots, like the one I ran with Brendon Hall in 2016 on lithology prediction, and like this SPE contest. It’s being run by a team of enthusiasts without a lot of resources from SPE, and the prize purse is only $1000 — representing about 3 hours of the fully loaded G&A of an oil industry professional.

What has this got to do with reproducibility?

Contests that award a large prize in return for solving a hard problem are essentially just a kind of RFP-combined-with-consulting-job. It’s brutally inefficient: hundreds or even thousands of people spend hours on the problem for free, and a handful are financially rewarded. These contests attract a lot of attention, but I’m not that interested in them.

Community-oriented events like this SPE contest — and the recent FORCE one that Xeek hosted — are more interesting and I believe they are more impactful. They have lots of great outcomes:

  • Lots of people have fun working on a hard problem and connecting with each other.

  • Solutions are often shared after, or even during, the contest, so that everyone learns and grows their toolbox.

  • A new open dataset that might even become a much-needed benchmark for the task in hand.

  • Researchers can publish what they did, or do later. (The SEG ML contest tutorial and results article have 136 citations between them, largely from people revisiting the dataset to show new solutions.)

A lot of new open-source machine learning code is always exciting, but if the data is not open then the work is by definition not reproducible. It seems especially unfair — cheeky, even — to ask participants to open-source their code, but to keep the data proprietary. For sure TGS is interested in how these free solutions compare to their own product.

Well, life’s not fair. Why is this a problem?

The data is being shared with the contest participants on the condition that they may not share it. In other words it’s proprietary. That means:

  • Participants are encumbered with the liability of a proprietary dataset. Sure, TGS is sharing this data in good faith today, but who knows how future TGS lawyers will see it after someone accidentally commits it to their GitHub repo? TGS is a billion-dollar company, they will win a legal argument with you. (Having said that, there’s no NDA or anything, just a checkbox in a form. I don’t know how binding it really is… but I don’t want to be the one that finds out.)

  • Participants can’t publish reproducible papers on their own work. They can publish classic oil-indsutry, non-reproducible work — I did this thing but no-one can check it because I can’t give you the data — but do we really need more of that? (In the contest introductory Zoom, someone asked about publishing plots of the data. The answer: “It should be fine.” Are we really still this naive about data?)

If anyone from TGS is reading this and thinking, “Come on, we’re not going to sue anyone — we’re not GSI! — it’s fine :)” then my response is: Wonderful! In that case, why not just formalize everything by releasing the data under an open licence — preferably Creative Commons Attribution 4.0? (Unmodified! Don’t make the licensing mistakes that Equinor and NAM have made recently.) That way, everyone knows their rights, everyone can safely download the data, and the community can advance. And TGS looks pretty great for contributing an awesome dataset to the subsurface machine learning community.

I hope TGS decides to release the data with an open licence. If they don’t, it feels like a rather one-sided deal to me. And with the arrangement as it stands, there’s no way I would enter this contest.

x lines of Python: load curves from LAS

Welcome to the latest x lines of Python post, in which we have a crack at some fundamental subsurface workflows... in as few lines of code as possible. Ideally, x < 10.

We've met curves once before in the series — in the machine learning edition, in which we cheated by loading the data from a CSV file. Today, we're going to get it from an LAS file — the popular standard for wireline log data.

Just as we previously used the pandas library to load CSVs, we're going to save ourselves a lot of bother by using an existing library — lasio by Kent Inverarity. Indeed, we'll go even further by also using Agile's library welly, which uses lasio behind the scenes.

The actual data loading is only 1 line of Python, so we have plenty of extra lines to try something more ambitious. Here's what I go over in the Jupyter notebook that goes with this post:

  1. Load an LAS file with lasio.
  2. Look at its header.
  3. Look at its curve data.
  4. Inspect the curves as a pandas DataFrame.
  5. Load the LAS file with welly.
  6. Look at welly's Curve objects.
  7. Plot part of a curve.
  8. Smooth a curve.
  9. Export a set of curves as a matrix.
  10. BONUS: fix some broken things in the file header.

Each one of those steps is a single line of Python. Together, I think they cover many of the things we'd like to do with well data once we get our hands on it. Have a play with the notebook and explore what you can do.

Next time we'll take things a step further and dive into some seismic petrophysics.

x lines of Python: read and write a shapefile

Shapefiles are a sort-of-open format for geospatial vector data. They can encode points, lines, and polygons, plus attributes of those objects, optionally bundled into groups. I say 'sort-of-open' because the format is well-known and widely used, but it is maintained and policed, so to speak, by ESRI, the company behind ArcGIS. It's a slightly weird (annoying) format because 'a shapefile' is actually a collection of files, only one of which is the eponymous SHP file. 

Today we're going to read a SHP file, change its Coordinate Reference System (CRS), add a new attribute, and save a new file in two different formats. All in x lines of Python, where x is a small number. To do all this, we need to add a new toolbox to our xlines virtual environment: geopandas, which is a geospatial flavour of the popular data management tool pandas.

Here's the full rundown of the workflow, where each item is a line of Python:

  1. Open the shapefile with fiona (i.e. not using geopandas yet).
  2. Inspect its contents.
  3. Open the shapefile again, this time with geopandas.
  4. Inspect the resulting GeoDataFrame in various ways.
  5. Check the CRS of the data.
  6. Change the CRS of the GeoDataFrame.
  7. Compute a new attribute.
  8. Write the new shapefile.
  9. Write the GeoDataFrame as a GeoJSON file too.

By the way, if you have not come across EPSG codes yet for CRS descriptions, they are the only way to go. This dataset is initially in EPSG 4267 (NAD27 geographic coordinates) but we change it to EPSG 26920 (NAD83 UTM20N projection).

Several bits of our workflow are optional. The core part of the code, items 3, 6, 7, and 8, are just a few lines of Python:

    import geopandas as gpd
    gdf = gpd.read_file('data_in.shp')
    gdf = gdf.to_crs({'init': 'epsg:26920'})
    gdf['seafl_twt'] = 2 * 1000 * gdf.Water_Dept / 1485
    gdf.to_file('data_out.shp')

That's it! 

As in all these posts, you can follow along with the code in the Jupyter Notebook.

Welly to the wescue

I apologize for the widiculous title.

Last week I described some headaches I was having with well data, and I introduced welly, an open source Python tool that we've built to help cure the migraine. The first versions of welly were built — along with the first versions of striplog — for the Nova Scotia Department of Energy, to help with their various data wrangling efforts.

Aside — all software projects funded by government should in principle be open source.

Today we're using welly to get data out of LAS files and into so-called feature vectors for a machine learning project we're doing for Canstrat (kudos to Canstrat for their support for open source software!). In our case, the features are wireline log measurements. The workflow looks something like this:

  1. Read LAS files into a welly 'project', which contains all the wells. This bit depends on lasio.
  2. Check what curves we have with the project table I showed you on Thursday.
  3. Check curve quality by passing a test suite to the project, and making a quality table (see below).
  4. Fix problems with curves with whatever tricks you like. I'm not sure how to automate this.
  5. Export as the X matrix, all ready for the machine learning task.

Let's look at these key steps as Python code.

1. Read LAS files

 
from welly import Project
p = Project.from_las('data/*.las')

2. Check what curves we have

Now we have a project full of wells and can easily make the table we saw last week. This time we'll use aliases to simplify things a bit — this trick allows us to refer to all GR curves as 'Gamma', so for a given well, welly will take the first curve it finds in the list of alternatives we give it. We'll also pass a list of the curves (called keys here) we are interested in:

The project table. The name of the curve selected for each alias is selected. The mean and units of each curve are shown as a quick QC. A couple of those RHOB curves definitely look dodgy, and they turned out to be DRHO correction curves.

The project table. The name of the curve selected for each alias is selected. The mean and units of each curve are shown as a quick QC. A couple of those RHOB curves definitely look dodgy, and they turned out to be DRHO correction curves.

3. Check curve quality

Now we have to define a suite of tests. Lists of test to run on each curve are held in a Python data structure called a dictionary. As well as tests for specific curves, there are two special test lists: Each and All, which are run on each curve encountered, and on all curves together, respectively. (The latter is required to, for example, compare the curves to each other to look for duplicates). The welly module quality contains some predefined tests, but you can also define your own test functions — these functions take a curve as input, and return either True (for a test pass) for False.

 
import welly.quality as qty
tests = {
    'All': [qty.no_similarities],
    'Each': [qty.no_monotonic],
    'Gamma': [
        qty.all_positive,
        qty.mean_between(10, 100),
    ],
    'Density': [qty.mean_between(1000,3000)],
    'Sonic': [qty.mean_between(180, 400)],
    }

html = p.curve_table_html(keys=keys, alias=alias, tests=tests)
HTML(html)
the green dot means that all tests passed for that curve. Orange means some tests failed. If all tests fail, the dot is red. The quality score shows a normalized score for all the tests on that well. In this case, RHOB and DT are failing the 'mean_b…

the green dot means that all tests passed for that curve. Orange means some tests failed. If all tests fail, the dot is red. The quality score shows a normalized score for all the tests on that well. In this case, RHOB and DT are failing the 'mean_between' test because they have Imperial units.

4. Fix problems

Now we can fix any problems. This part is not yet automated, so it's a fairly hands-on process. Here's a very high-level example of how I fix one issue, just as an example:

 
def fix_negs(c):
    c[c < 0] = np.nan
    return c

# Glossing over some details, we give a mnemonic, a test
# to apply, and the function to apply if the test fails.
fix_curve_if_bad('GAM', qty.all_positive, fix_negs)

What I like about this workflow is that the code itself is the documentation. Everything is fully reproducible: load the data, apply some tests, fix some problems, and export or process the data. There's no need for intermediate files called things like DT_MATT_EDIT or RHOB_DESPIKE_FINAL_DELETEME. The workflow is completely self-contained.

5. Export

The data can now be exported as a matrix, specifying a depth step that all data will be interpolated to:

 
X, _ = p.data_as_matrix(X_keys=keys, step=0.1, alias=alias)

That's it. We end up with a 2D array of log values that will go straight into, say, scikit-learn*. I've omitted here the process of loading the Canstrat data and exporting that, because it's a bit more involved. I will try to look at that part in a future post. For now, I hope this is useful to someone. If you'd like to collaborate on this project in the future — you know where to find us.

* For more on scikit-learn, don't miss Brendon Hall's tutorial in October's Leading Edge.


I'm happy to let you know that agilegeoscience.com and agilelibre.com are now served over HTTPS — so connections are private and secure by default. This is just a matter of principle for the Web, and we go to great pains to ensure our web apps modelr.io and pickthis.io are served over HTTPS. Find out more about SSL from DigiCert, the provider of Squarespace's (and Agile's) certs, which are implemented with the help of the non-profit Let's Encrypt, who we use and support with dollars.

Well data woes

I probably shouldn't be telling you this, but we've built a little tool for wrangling well data. I wanted to mention it, becase it's doing some really useful things for us — and maybe it can help you too. But I probably shouldn't because it's far from stable and we're messing with it every day.

But hey, what software doesn't have a few or several or loads of bugs?

Buggy data?

It's not just software that's buggy. Data is as buggy as heck, and subsurface data is, I assert, the buggiest data of all. Give units or datums or coordinate reference systems or filenames or standards or basically anything at all a chance to get corrupted in cryptic ways, and they take it. Twice if possible.

By way of example, we got a package of 10 wells recently. It came from a "data management" company. There are issues... Here are some of them:

  • All of the latitude and longitude data were in the wrong header fields. No coordinate reference system in sight anywhere. This is normal of course, and the only real side-effect is that YOU HAVE NO IDEA WHERE THE WELL IS.
  • Header chaos aside, the files were non-standard LAS sort-of-2.0 format, because tops had been added in their own little completely illegal section. But the LAS specification has a section for stuff like this (it's called OTHER in LAS 2.0).
  • Half the porosity curves had units of v/v, and half %. No big deal...
  • ...but a different half of the porosity curves were actually v/v. Nice.
  • One of the porosity curves couldn't make its mind up and changed scale halfway down. I am not making this up.
  • Several of the curves were repeated with other names, e.g. GR and GAM, DT and AC. Always good to have a spare, if only you knew if or how they were different. Our tool curvenam.es tries to help with this, but it's far from perfect.
  • One well's RHOB curve was actually the PEF curve. I can't even...

The remarkable thing is not really that I have this headache. It's that I expected it. But this time, I was out of paracetamol.

Cards on the table

Our tool welly, which I stress is very much still in development, tries to simplify the process of wrangling data like this. It has a project object for collecting a lot of wells into a single data structure, so we can get a nice overview of everything: 

Click to enlarge.

Our goal is to include these curves in the training data for a machine learning task to predict lithology from well logs. The trained model can make really good lithology predictions... if we start with non-terrible data. Next time I'll tell you more about how welly has been helping us get from this chaos to non-terrible data.

Toolbox wishlist

Earlier this week, the conversation on Software Underground* turned to well-tie software.

Someone was complaining that, despite having several well-tie tools at their disposal, none of them was quite right. I've written about this phenomenon before. We, as a discipline, do not know how to tie wells. I don't mean that you don't know, I know you know, but I bet if you compared the workflows of ten geoscientists, they would all be different. That's why every legacy well in every project has thirty time-depth tables, including at least three endearingly hopeful ones called final, and the one everyone uses, called test.

As a result of all this, the topic of "what tools do people need?" came up. Leo Uieda, a researcher in Brazil, asked:

I just about remembered that I had put up this very question on Tricider some time ago. Tricider is not a website about apple-based beverages, but a site for sharing and voting on ideas. You can start with a few ideas, get votes and comments on them, and even get new ideas. Here's the top idea as of right now: an open-source petrophysics tool.

Do check out the list, and vote or comment if you like. It might help someone find a project to work on, or spark an idea for a new app or even a new company.

Another result of the well-tie software conversation was, "What are the features of the one well-tie app to rule them all?" I'll leave you to stew on that one for a while. Meanwhile, please share your thoughts in the comments.


* Software Underground is an open Slack team. In essence, it's a chat room for geocomputing geeks: software, underground, geddit? It's completely free and open to anyone — pop along to http://swung.rocks/ to sign up.

It even has its own radio station!

Well tie calculus

As Matt wrote in March, he is editing a regular Tutorial column in SEG's The Leading Edge. I contributed the June edition, entitled Well-tie calculus. This is a brief synopsis only; if you have any questions about the workflow, or how to get started in Python, get in touch or come to my course.


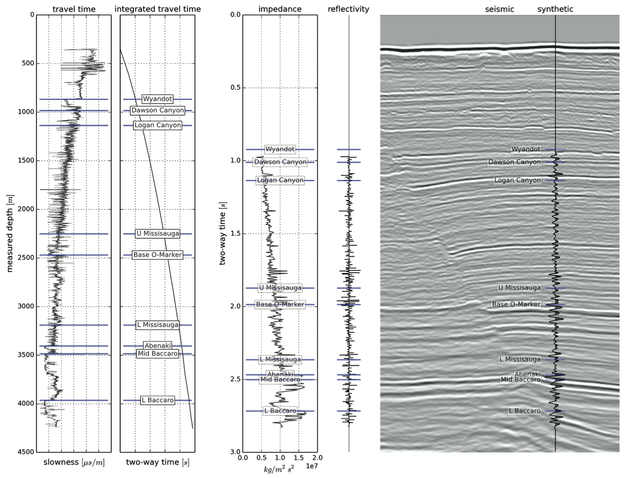
Synthetic seismograms can be created by doing basic calculus on traveltime functions. Integrating slowness (the reciprocal of velocity) yields a time-depth relationship. Differentiating acoustic impedance (velocity times density) yields a reflectivity function along the borehole. In effect, the integral tells us where a rock interface is positioned in the time domain, whereas the derivative tells us how the seismic wavelet will be scaled.

This tutorial starts from nothing more than sonic and density well logs, and some seismic trace data (from the #opendata Penobscot dataset in dGB's awesome Open Seismic Repository). It steps through a simple well-tie workflow, showing every step in an IPython Notebook:

  1. Loading data with the brilliant LASReader
  2. Dealing with incomplete, noisy logs
  3. Computing the time-to-depth relationship
  4. Computing acoustic impedance and reflection coefficients
  5. Converting the logs to 2-way travel time
  6. Creating a Ricker wavelet
  7. Convolving the reflection coefficients with the wavelet to get a synthetic
  8. Making an awesome plot, like so...

Final thoughts

If you find yourself stretching or squeezing a time-depth relationship to make synthetic events align better with seismic events, take the time to compute the implied corrections to the well logs. Differentiate the new time-depth curve. How much have the interval velocities changed? Are the rock properties still reasonable? Synthetic seismograms should adhere to the simple laws of calculus — and not imply unphysical versions of the earth.


Matt is looking for tutorial ideas and offers to write them. Here are the author instructions. If you have an idea for something, please drop him a line.

Private public data

Our recent trip to the AAPG Annual Convention in Houston was much enhanced by meeting some inspiring geoscientist–programmers. People like...

  • Our old friend Jacob Foshee hung out with us and built his customary awesomeness.
  • Wassim Benhallam, at the University of Utah, came to our Rock Hack and impressed everyone with his knowledge of clustering algorithms, and sedimentary geology.
  • Sebastian Good, of Palladium Consulting, is full of beans and big ideas — and is a much more accomplished programmer than most of us will ever be. If you're coding geoscience, you'll like his blog.
  • We had a laugh with Nick Thompson from Schlumberger, who we bumped into at a 100% geeky meet-up for Python programmers interested in web sockets. I cannot explain why we were there.

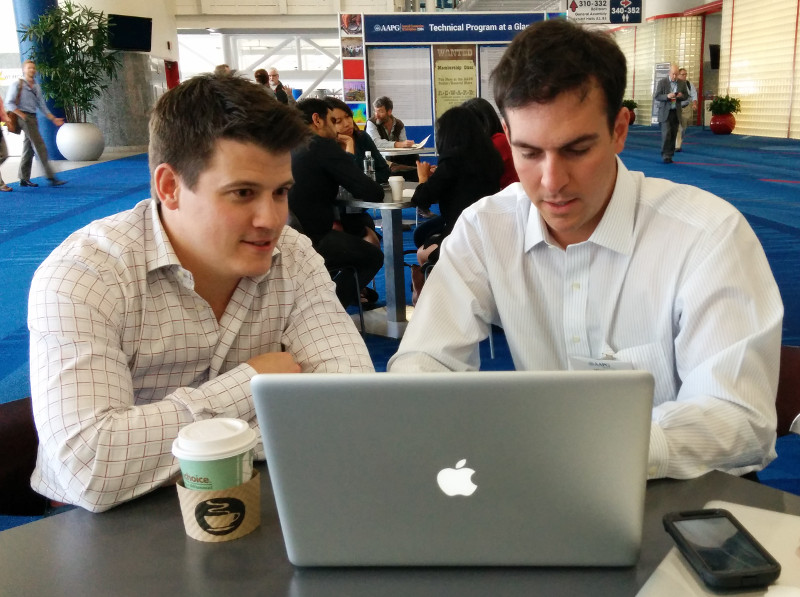
Perhaps the most animated person we met was Ted Kernan (right). A recent graduate of Colorado School of Mines, Ted has taught himself PHP, one of the most prevalent programming languages on the web (WordPress, Joomla, and MediaWiki are written in PHP). He's also up on all the important bits of web tech, like hosting, and HTML frameworks.

But the really cool thing is what he's built: a search utility for public well data in the United States. You can go and check it out at publicwelldata.com — and if you like it, let Ted know!

Actually, that's not even the really cool thing. The really cool thing is how passionate he is about exposing this important public resource, and making it discoverable and accessible. He highlights the stark difference between Colorado's easy access to digital well data, complete with well logs, and the sorry state of affairs in North Dakota, where he can't even get his app in to read well names. 'Public data' can no longer mean "we'll sell you a paper printout for $40". It belongs on the web — machines can read too.

More than just wells

There's so much potential power here — not only for human geoscientists looking for well data, but also for geoscientist–programmers building tools that need well data. For example, I imagine being able to point modelr.io at any public well to grab its curves and make a quick synthetic. Ready access to open services like Ted's will free subsurface software from the deadweight of corporate databases filled with years of junk, and make us all a bit more nimble. 

We'll be discussing open data, and openness in general, at the Openness Unsession in Calgary on the afternoon of 12 May — part of GeoConvention 2014. Join us!