A forensic audit of seismic data

The SEG-Y “standard” is famously non-standard. (Those air quotes are actually part of the “standard”.)

For example, the inline and crossline location of a given trace — two things that you must have in order to load the data vaguely properly — are “recommended” (remember, it’s a “standard”) to be given in the trace’s header, at byte locations 189 and 193 respectively. Indeed, they might well be there. Or 1 and 5 (well, 5 or 9). Or somewhere else. Or not there at all.

Don Robinson at Resolve told me recently that he has seen more than 180 byte-location combinations, and he said another service company had seen more than 300.

All this can make loading seismic data really, really annoying.

I’d like to propose that the community performs a kind of forensic audit of SEG-Y files. I have 5 main questions:

  1. What proportion of files claim to be Rev 0, Rev 1, and Rev 2? And what standard are they actually? (If any!)

  2. What proportion of files in the wild use IBM vs IEEE floats? What about integers?

  3. What proportion of files in the wild use little-endian vs big-endian byte order. (Please tell me there's no middle-endian data out there!)

  4. What proportion of files in the wild use EBCDIC vs ASCII encoded textual file headers? (Again, I would hope there are no other encodings in use, but I bet there are.)

  5. What proportion of files use the Strongly recommended and Recommended byte locations for trace numbers, sample counts, sample interval, coordinates and inline–crossline numbers?

For each of these <things> it would also be interesting to know:

  • How does <thing> vary with the other things? That is, what's the cross-correlation matrix?

  • How does <thing> vary with the age of the file? Is there a temporal trend?

  • How does <thing> vary with the provenance of the file? What's the geographic trend? (For example, Don told me that the prevalence of PC-based interpretation packages in Canada led to widespread early adoption of IEEE floats and little-endian byte order; indeed, he says that 90% of the SEG-Y he sees in the wild is still IBM ormatted floats!)

While we’re at it, I'd also like in some more esoteric things:

  • How many files have cornerpoints in the text header, and/or trace locations in trace headers?

  • How many files have an unambiguous CRS in the text header?

  • How many files have information about the processing sequence in the text header? (E.g. imaging details, filters, etc.)

  • How many files have incorrect information in the headers (e.g. locations, sample interval, byte format, etc)

  • How many processors bother putting useful things like elevation, filters, sweeps, fold at target, etc, in the trace headers?

I don’t quite know how such a survey would happen. Most of these things are obviously detectable from the files themselves. Perhaps some of the many seismic data management systems already track these things. Or maybe you’re a data manager and you have some anecdotal data you can share.

What do you think? I’d love to hear your thoughts in the comments. Maybe there’s a good hackathon project here!

Does your machine learning smell?

Martin Fowler and Kent Beck popularized the term ‘code smell’ in the book Refactoring. They were describing the subtle signs of deeper trouble in code — signs that a program’s source code might need refactoring (restructuring and rewriting). There are too many aromas to list here, but here are some examples (remember, these things are not necessarily problems in themselves, but they suggest you need to look more closely):

  • Duplicated code.

  • Contrived complexity (also known as showing off).

  • Functions with many arguments, suggesting overwork.

  • Very long functions, which are hard to read.

More recently, data scientist Felienne Hermans applied the principle to the world’s number one programming environment: spreadsheets. The statistics on spreadsheet bugs are quite worrying, and Hermans enumerated the smells that might lead you to them. Here are four of her original five ‘formula’ smells, notice how they correspond to the code smells above:

  • Duplicated formulas.

  • Conditional complexity (e.g. nested IF statements).

  • Multiple references, analogous to the ‘many arguments’ smell.

  • Multiple operations in one cell.

What does a machine learning project smell like?

Most machine learning projects are code projects, so some familiar smells might be emanating from the codebase (if we even have access to it). But machine learning models are themselves functions — machines that map input X to some target y. And even if the statistical model is simple, like a KNN classifier, the workflow is a sort of ‘metamodel’ and can have complexities of its own. So what are the ‘ML smells’ that might alert us to deeper problems in our prediction tools?

I asked this question on Twitter (below) and in the Software Underground

I got some great responses. Here are some ideas adapted from them, with due credit to the people named:

  • Very high accuracy, especially a complex model on a novel task. (Ari Hartikainen, Helsinki and Lukas Mosser, Athens; both mentioned numbers around 0.99 but on earth science problems I start to get suspicious well before that: anything over 0.7 is excellent, and anything over 0.8 suggests ‘special efforts’ have been made.)

  • Excessive precision on hyperparameters might suggest over-tuning. (Chris Dinneen, Perth)

  • Counterintuitive model weights, e.g. known effects have low feature importance. (Reece Hopkins, Anchorage)

  • Unreproducible, non-deterministic code, e.g. not setting random seeds. (Reece Hopkins again)

  • No description of the train–val–test split, or justification for how it was done. Leakage between training and blind data is easy to introduce with random splits in spatially correlated data. (Justin Gosses, Houston)

  • No discussion of ground truth and how the target labels relate to it. (Justin Gosses again)

  • Less than 80% of the effort spent on preparing the data. (Michael Pyrcz, Austin — who actually said 90%)

  • No discussion of the evaluation metric, eg how it was selected or designed (Dan Buscombe, Flagstaff)

  • No consideration of the precision–recall trade-off, especially in a binary classification task. (Dan Buscombe again)

  • Strong class imbalance and no explicit mention of how it was handled. (Dan Buscombe again)

  • Skewed feature importance (on one or two features) might suggest feature leakage. (John Ramey, Austin)

  • Excuses, excuses — “we need more data”, “the labels are bad”, etc. (Hallgrim Ludvigsen, Stavanger)

  • AutoML, e.g. using a black box service, or an exhaustive automated seach of models and hyperparameters.

That’s already a long list, but I’m sure there are others. Or perhaps some of these are really the same thing, or are at least connected. What do you think? What red — or at least yellow — flags do you look out for when reviewing machine learning projects? Let us know in the comments below.


If you enjoyed this post, check out the Machine learning project review checklist I wrote bout last year. I’m currently working on a new version of the checklist that includes some tips for things to look for when going over the checklist. Stay tuned for that.


The thumbnail for this post was generated automatically from text (something like, “a robot smelling a flower”… but I made so many I can’t remember exactly!). Like a lot of unconstrained image generation by AI’s, it’s not great, but I quite like it all the same.

The AI is LXMERT from the Allen Institute. Try it out or read the paper.

download (7).png

Machine learning project review checklist

Imagine being a manager or technical chief whose team has been working on a machine learning project. What questions should you be thinking about when your team tells you about their work?

Here are some suggestions. Some of the questions are getting at reproducibility (for testing, archiving, or sharing the workflow), others at quality assurance. A few of the questions might depend on the particular task in hand, although I’ve tried to keep it pretty generic.

There are a few must-ask questions, highlighted in bold.

High-level questions about the project

  • What question were you trying to answer? How did you frame it as an ML task?

  • What is human-level performance on that task? What level of performance is needed?

  • Is it possible to approach this problem without machine learning?

  • If the analysis focused on deep learning methods, did you try shallow learning methods?

  • What are the ethical and legal aspects of this project?

  • Which domain experts were involved in this analysis?

  • Which data scientists were involved in this analysis?

  • Which tools or framework did you use? (How much of a known quantity is it?)

  • Where is the pipeline published? (E.g. public or internal git repositories.)

  • How thorough is the documentation?

Questions about the data preparation

  • Where did the feature data come from?

  • Where did the labels come from?

  • What kind of data exploration did you do?

  • How did you clean the data? How long did this take?

  • Are the classes balanced? How did the distribution change your workflow?

  • What kind of normalization did you do?

  • What did you do about missing data? E.g. what kind of imputation did you do?

  • What kind of feature engineering did you do?

  • How did you split the data into train, validate and test?

Questions about training and evaluation

  • Which models did you explore and why? Did you also try the simplest models that fit the problem?

  • How did you tune the hyperparameters of the model? Did you try grid search or other methods?

  • What kind of validation did you do? Did you use cross-validation? How did you choose the folds?

  • What evaluation metric are you using? Why is it the most appropriate one?

  • How do training, validation, and test metrics compare?

  • If this was a classification task, how does a dummy classifier score?

  • How are errors/residuals distributed? (Ideally normally distributed and  homoscedastic.)

  • How interpretable is your model? That is, do the learned parameters mean anything, and can we learn from them? E.g. what is the feature importance?

  • If this was a classification task, are probabilities available in your model and did you use them?

  • If this was a regression task, have you checked the residuals for normality and homoscedasticity?

  • Are there benchmarks for this task, and how well does your model do on them?

Next steps for the project

  • How will you improve the model?

  • Would collecting more data help? Can we address the imbalance with more data?

  • Are there human or computing resources you need access to?

  • How will you deploy the model?

Rather than asking them explicitly, a reviewer might check things off while reading a report or listening to a presentation. A thorough review would cover most of the points without being prompted. And I’d go so far as to say that a person or team who has done a rigorous treatment should readily have answers to all of these questions. They aren't supposed to be 'traps' exactly, but they are supposed to get to the heart of the issues the data scientist or team likely faced during their work.

What do you think? Are the questions fair? Are there any you would remove, or others you would add? Let me know in the comments.

Visit a Google Docs version of this checklist.


Thank you to members of the Software Underground Slack channel for discussion of these questions, especially Anton Biryukov, Justin Gosses, and Lukas Mosser.

Is geolocation the new lat-long?

location_pick-up.png

If I want to hail a ride-sharing service I can give an address as my location. Unless I am at the rear of the building or in the parking lot across the street, in which case I need to fiddle about with a pin on a slippy map. No problem, I can usually eyeball it and then just look out for the driver.

But there are other situations where an address won't do, and fiddling with pins isn't an option either. Telling the pizza company exactly where the delivery drone should land. Calling an ambulance to a remote area. Specifying a well location in the desert. Doing almost anything in the desert.

Wait, isn't this what latitude and longitude are for?

Sort of. I mean, it is what lat and long are for, but they aren't all that good at it. For one thing, there's the annoying problem of datums, which is even more annoying because hardly anyone realizes it's a problem.

Then there's the fact that to get better than 10 metre accuracy, you need 5 decimal places (or 1 decimal place in the seconds if we're talking DMS). So, even without the all-important datum, your average lat-long pair in N America would need at least 18 characters in decimal notation: 44.44845N64.37565W. This is not terribly user-friendly.

What are the alternatives?

In the last ten years or so, several alternatives to addresses and lat-longs have emerged. For example, one interesting geocoding system — geohash.org — encodes locations as strings of letters and digits. The location of my fictional 'pick up point' would be dxfhz5e4fxs. A bit of a mouthful perhaps but the system helpfully omits some easily confused characters, like lower-case L, and is case-insensitive. Another really nice feature: the string is big-endian so you can remove characters from the right to get a bit less precision.

In 2013, what3words burst onto the geolocation scene with an ingenious proprietary algorithm uniquely transforms the location of every 3 x 3 m square on Earth into three pronounceable words. My pick-up location becomes a cryptic crossword clue: dreadlocks.boarded.pageant. One feature of the scheme is that similar-sounding locations are not neighbours, avoiding near-miss confusion. For example, the square to the west of mine is called lawmakers.sieves.breezes, and the similar-sounding deadlock.boarded.pageant is in the middle of a field in New South Wales. Mercedes and Dominoes Pizza are experimenting with what3words.

More recently still, Open Location Codes have got some traction. Also called plus codes — a clue that they were invented by Google — they are a really nice example of a well-executed open standard, with fully open code, reference implementations in lots of languages, a public-facing website, and great documentation. My location's plus code is 87PQCJXF+9Q. Like the geohash, it can be shortened — but only in particular ways, for example, I could give the code as CJXF+9Q, Mahone Bay. Unlike what3words, Open Location Codes are free to use. My guess is that we'll be seeing them all over the place as self-driving cars and drones become more widespread.

Mapcodes, developed in about 2001, are yet another implementation of geocodes. Their main feature is the use of very short codes for densely populated places. However, there are some problems. For example, codes can be specified with or without country and region codes — but the different versions do not resemble each other.

For comparison, here's how I might describe my pick up location on the map at the top of this post:

 
geocodes_again.png
 

Useful for geoscience?

They certainly seem easier to wield that lat-long, and you don't need to worry about datums anymore, but perhaps they feel too new or ephemeral to catch on for some geospatial practitioners. I also wonder why no-one seems to have thought about the 3D problem yet... Which floor of the apartment building is this pizza going to? How far down this mine is the heart attack victim? At exactly what depth in this lake was the wreckage of the self-driving car found?

What do you think? will any of these schemes gain traction? Might any of them be useful in science or engineering applications? Will you be experimenting with them?


I can't leave the subject of geolocation codes without mentioning geohashing — a sort of cross between geocaching and professional nerdism. Invented in 2008 by xkcd creator, Randall Munroe, geohashing involves generating random locations via an MD5 hash, then visiting that location without getting lost or beaten up.

Update: You can access this algorithm right from Python: from antigravity import geohash

SEG-Y Rev 2 again: little-endian is legal!

Big news! Little-endian byte order is finally legal in SEG-Y files.

That's not all. I already spilled the beans on 64-bit floats. You can now have up to 18 quintillion traces (18 exatraces?) in a seismic line. And, finally, the hyphen confusion is cleared up: it's 'SEG-Y', with a hyphen. All this is spelled out in the new SEG-Y specification, Revision 2.0, which was officially released yesterday after at least five years in the making. Congratulations to Jill Lewis, Rune Hagelund, Stewart Levin, and the rest of the SEG Technical Standards Committee

Back up a sec: what's an endian?

Whenever you have to think about the order of bytes (the 8-bit chunks in a 'word' of 32 bits, for example) — for instance when you send data down a wire, or store bytes in memory, or in a file on disk — you have to decide if you're Roman Catholic or Church of England.

What?

It's not really about religion. It's about eggs.

In one of the more obscure satirical analogies in English literature, Jonathan Swift wrote about the ideological tussle between between two factions of Lilliputians in Gulliver's Travels (1726). The Big-Endians liked to break their eggs at the big end, while the Little-Endians preferred the pointier option. Chaos ensued.

Two hundred and fifty years later, Danny Cohen borrowed the terminology in his 1 April 1980 paper, On Holy Wars and a Plea for Peace — in which he positioned the Big-Endians, preferring to store the big bytes first in memory, against the Little-Endians, who naturally prefer to store the little ones first. Big bytes first is how the Internet shuttles data around, so big-endian is sometimes called network byte order. The drawing (right) shows how the 4 bytes in a 32-bit 'word' (the hexadecimal codes 0A, 0B, 0C and 0D) sit in memory.

Because we write ordinary numbers big-endian style — 2017 has the thousands first, the units last — big-endian might seem intuitive. Then again, lots of people write dates as, say, 31-03-2017, which is analogous to little-endian order. Cohen reviews the computational considerations in his paper, but really these are just conventions. Some architectures pick one, some pick the other. It just happens that the x86 architecture that powers most desktop and laptop computers is little-endian, so people have been illegally (and often accidentally) writing little-endian SEG-Y files for ages. Now it's actually allowed.

Still other byte orders are possible. Some processors, notably ARM and other RISC architectures, are middle-endian (aka mixed endian or bi-endian). You can think of this as analogous to the month-first American date format: 03-31-2017. For example, the two halves of a 32-bit word might be reversed compared to their 'pure' endian order. I guess this is like breaking your boiled egg in the middle. Swift did not tell us which religious denomination these hapless folks subscribe to.

OK, that's enough about byte order

I agree. So I'll end with this handy SEG-Y cheatsheet. Click here for the PDF.


References and acknowledgments

Cohen, Danny (April 1, 1980). On Holy Wars and a Plea for PeaceIETF. IEN 137. "...which bit should travel first, the bit from the little end of the word, or the bit from the big end of the word? The followers of the former approach are called the Little-Endians, and the followers of the latter are called the Big-Endians." Also published at IEEE ComputerOctober 1981 issue.

Thumbnail image: “Remember, people will judge you by your actions, not your intentions. You may have a heart of gold -- but so does a hard-boiled egg.” by Kate Ter Haar is licensed under CC BY 2.0

How to load SEG-Y data

Yesterday I looked at the anatomy of SEG-Y files. But it's pathology we're really interested in. Three times in the last year, I've heard from frustrated people. In each case, the frustration stemmed from the same problem. The epic email trails led directly to these posts. Next time I can just send a URL!

In a nutshell, the specific problem these people experienced was missing or bad trace location data. Because I've run into this so many times before, I never trust location data in a SEG-Y file. You just don't know where it's been, or what has happened to it along the way — what's the datum? What are the units? And so on. So all you really want to get from the SEG-Y are the trace numbers, which you can then match to a trustworthy source for the geometry.

Easy as 1-2-3, er, 4

This is my standard approach to loading data. Your mileage will vary, depending on your software and your data. 

  1. Find the survey geometry information. For 2D data the geometry is usually in a separate navigation ('nav') file. For 3D you are just looking for cornerpoints, and something indicating how the lines and crosslines are numbered (they might not start at 1, and might not be oriented how you expect). This information may be in the processing report or, less reliably, in the EBCDIC text header of the SEG-Y file.
  2. Now define the survey geometry. You need a location for every trace for a 2D, and the survey's cornerpoints for a 3D. The geometry is a description of where the line goes on the earth, in surface coordinates, and where the starting trace is, how many traces there are, and what the trace spacing is. In other words, the geometry tells you where the traces go. It's variously called 'navigation', 'survey', or some other synonym.
  3. Finally, load the traces into their homes, one vintage (survey and processing cohort) at a time for 2D. The cross-reference between the geometry and the SEG-Y file is the trace or CDP number for a 2D, and the line and crossline numbers for a 3D.
  4. Check everything twice. Does the map look right? Is the survey the right shape and size? Is the line spacing right? Do timeslices look OK?

Where to get the geometry data?

So, where to find cornerpoints, line spacings, and so on? Sadly, the header cannot be trusted, even in newly-processed data. If you have it, the processing report is a better bet. It often helps to talk to someone involved in the acquisition and processing too. If you can corroborate with data from the acqusition planning (line spacings, station intervals, and so on), so much the better — but remember that some acquisition parameters may have changed during the job.

Of vital importance is some independent corroboration— a map, ideally —of the geometry and the shape and orientation of the survey. I can't count the number of back-to-front surveys I've seen. I even saw one upside-down (in the z dimension) once, but that's another story.

Next time, I'll break down the loading process a bit more, with some step-by-step for loading the data somewhere you can see it.

What is SEG-Y?

The confusion starts with the name, but whether you write SEGY, SEG Y, or SEG-Y, it's probably definitely pronounced 'segg why'. So what is this strange substance?

SEG-Y means seismic data. For many of us, it's the only type of seismic file we have much to do with — we might handle others, but for the most part they are closed, proprietary formats that 'just work' in the application they belong to (Landmark's brick files, say, or OpendTect's CBVS files). Processors care about other kinds of data — the SEG has defined formats for field data (SEG-D) and positional data (SEG-P), for example. But SEG-Y is the seismic file for everyone. Kind of.

The open SEG-Y "standard" (those air quotes are an important feature of the standard) was defined by SEG in 1975. The first revision, Rev 1, was published in 2002. The second revision, Rev 2, was announced by the SEG Technical Standards Committee at the SEG Annual Meeting in 2013 and I imagine we'll start to see people using it in 2014. 

What's in a SEG-Y file?

SEG-Y files have lots of parts:

The important bits are the EBCDIC header (green) and the traces (light and dark blue).

The EBCDIC text header is a rich source of accurate information that provides everything you need to load your data without problems. Yay standards!

Oh, wait. The EBCDIC header doesn't say what the coordinate system is. Oh, and the datum is different from the processing report. And the dates look wrong, and the trace length is definitely wrong, and... aargh, standards!

The other important bit — the point of the whole file really — is the traces themselves. They also have two parts: a header (light blue, above) and the actual data (darker blue). The data are stored on the file in (usually) 4-byte 'words'. Each word has its own address, or 'byte location' (a number), and a meaning. The headers map the meaning to the location, e.g. the crossline number is stored in byte 21. Usually. Well, sometimes. OK, it was one time.

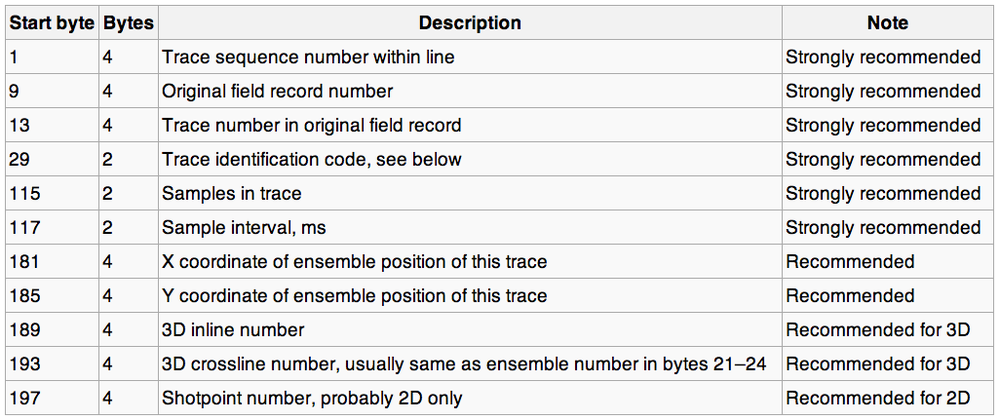
According to the standard, here's where the important stuff is supposed to be:

I won't go into the unpleasantness of poking around in SEG-Y files right now — I'll save that for next time. Suffice to say that it's often messy, and if you have access to a data-loading guru, treat them exceptionally well. When they look sad — and they will look sad — give them hugs and hot tea. 

What's so great about Rev 2?

The big news in the seismic standards world is Revision 2. According to this useful presentation by Jill Lewis (Troika International) at the Standards Leadership Council last month, here are the main features:

  • Allow 240 byte trace header extensions.
  • Support up to 231 (that's 2.1 billion!) samples per trace and traces per ensemble.
  • Permit arbitrarily large and small sample intervals.
  • Support 3-byte and 8-byte sample formats.
  • Support microsecond date and time stamps.
  • Provide for additional precision in coordinates, depths, elevations.
  • Synchronize coordinate reference system specification with SEG-D Rev 3.
  • Backward compatible with Rev 1, as long as undefined fields were filled with binary zeros.

Two billion samples at µs intervals is over 30 minutes Clearly, the standard is aimed at <ahem> Big Data, and accommodating the massive amounts of data coming from techniques like variable timing acquisition, permanent 4D monitoring arrays, and microseismic. 

Next time, we'll look at loading one of these things. Not for the squeamish.