Cross sections into seismic sections

We've added to the core functionality of modelr. Instead of creating an arbitrarily shaped wedge (which is plenty useful in its own right), users can now create a synthetic seismogram out of any geology they can think of, or extract from their data.

Turn a geologic-section into an earth model

We implemented a color picker within an image processing scheme, so that each unique colour gets mapped to an editable rock type. Users can create and manage their own rock property catalog, and save models as templates to share and re-use. You can use as many or as few colours as you like, and you'll never run out of rocks.

To give an example, let's use the stratigraphic diagram that Bruce Hart used in making synthetic seismic forward models in his recent Whither seismic stratigraphy article. There are 7 unique colours, so we can generate an earth model by assigning a rock to each of the colours in the image.

If you can imagine it, you can draw it. If you can draw it, you can model it.

Modeling as an interactive experience

We've exposed parameters in the interface and so you can interact with the multidimensional seismic data space. Why is this important? Well, modeling shouldn't be a one-shot deal. It's an iterative process. A feedback cycle where you turn knobs, pull levers, and learn about the behaviour of a physical system; in this case it is the interplay between geologic units and seismic waves. 
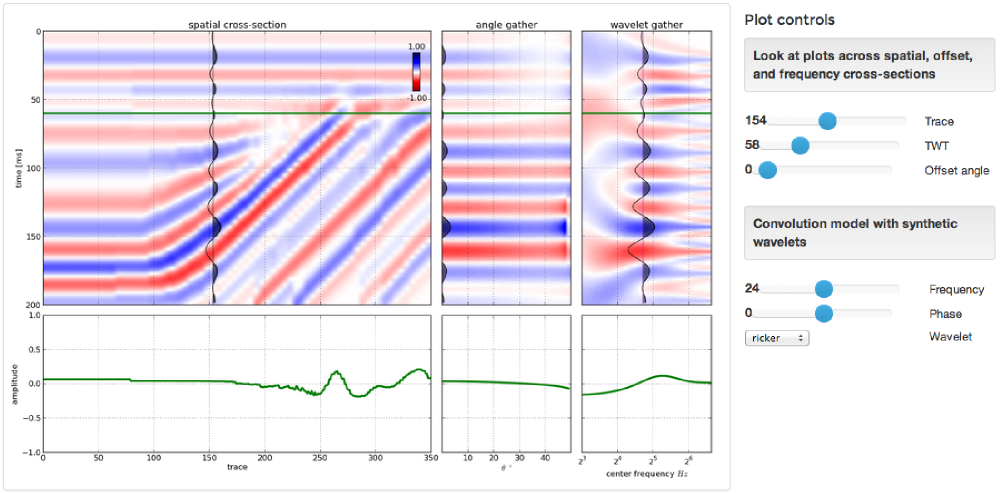
A model isn't just a single image, but a swath of possibilities teased out by varying a multitude of inputs. With modelr, the seismic experiment can be manipulated, so that the gamut of geologic variability can be explored. That process is how we train our ability to see geology in seismic.

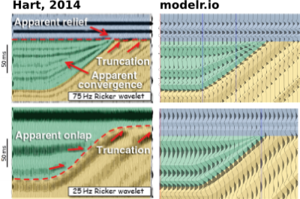
Hart's paper doesn't specifically mention the rock properties used, so it's difficult to match amplitudes, but you can see here how modelr stands up next to Hart's images for high (75 Hz) and low (25 Hz) frequency Ricker wavelets.

There are some cosmetic differences too... I've used fewer wiggle traces to make it easier to see the seismic waveforms. And I think Bruce forgot the blue strata on his 25 Hz model. But I like this display, with the earth model in the background, and the wiggle traces on top — geology and seismic blended in the same graphical space, as they are in the real world, albeit briefly.


Subscribe to the email list to stay in the loop with modelr news, or sign-up at modelr.io and get started today.

This will add you to the email list for the modeling tool. We never share user details with anyone. You can unsubscribe any time.

Seismic models: Hart, BS (2013). Whither seismic stratigraphy? Interpretation, volume 1 (1). The image is copyright of SEG and AAPG.

Thin-bed vowels and heterolithic consonants

Seismologists see the world differently. Or, rather, they hear the world differently. Sounds become time series, musical notes become Fourier components. The notes we make with our vocal chords come from the so-called sonorants, especially the vowel sounds, and they look like this:

Consontants aren't as pretty, consisting of various obstruents like plosives and fricatives—these depend on turbulence, and don't involve the vocal chords. They look very different:

Geophysicists will recognize these two time series as being signal-dominated and noise-dominated, respectively. The signal in the vowel sound is highly periodic: a small segment about 12 ms long is repeated four times in this plot. There is no repeating signal in the consonant sound: it is more or less white noise.

When quantitative people hear the word periodic, their first thought is usually Fourier transform. Like a prism, the Fourier transform unpacks mixed signals into monotones, making them easier to examine and explain. For instance, the Fourier transform of a set of limestone beds might reveal the Milankovitch cycles of which I am so fond. What about S and E?

The spectrum of the consonant S is not very organized and close to being random. But the E sound has an interesting shape. It's quite smooth and has obvious repetitive notches. Any geophysicist who has worked with spectral decomposition—a technique for investigating thin beds—will recognize these. For example, compare the spectrums for a random set of reflection coefficients (what we might call background geology) and a single thin bed, 10 ms thick:

Notches! The beauty of this, from an interpreter's point of view, is that one can deduce the thickness of the thin-bed giving rise to this notchy spectrum. The thickness is simply 1/n, where n is the notch spacing, 100 Hz in this case. So the thickness is 1/100 = 0.01 s = 10 ms. We can easily compute the spectrum of seismic data, so this is potentially powerful.

While obvious here, in a complicated spectrum the notches might be hard to detect and thus measure. But the notches are periodic. And what do we use to find periodic signals? The Fourier transform! So what happens if we take the spectrum of the spectrum of my voice signal—where we saw a 12 ms repeating pattern?

There's the 12 ms periodic signal from the time series! 

The spectrum of the spectrum is called the cepstrum (pronounced, and sometimes spelled, kepstrum). We have been transported from the frequency domain to a new universe: the quefrency domain. We are back with units of time, but there are other features of the cepstral world that make it quite different from the time domain. I'll discuss those in a future post. 

Based on a poster paper I presented at the 2005 EAGE Conference & Exhibition in Madrid, Spain, and on a follow-up article Hall, M (2006), Predicting bed thickness with cepstral decomposition, The Leading Edge, February 2006, doi:10.1190/1.2172313