Two hundred posts

The petrophysics cheasheet was one of our most popular posts

My post on Tuesday was the two hundredth post on our blog, which we started 19 months ago in November 2010. Though we began with about 15 posts per month, we have settled down to a rate of 7 or 8 posts per month, which feels sustainable. At this rate, it will be at least a year before we hit 300.

We hit 100 posts on 21 June last year, after only 222 days. In the 358 days since then we've had about 41 700 visits from 24 500 people in 152 countries. The most popular content is a little hard to gauge because of the way we run every post over the home page for a couple of weeks, but from the most recent 100 posts, the favourites are (in descending pageview order):

Someone asked recently how long our posts take to write. It varies quite a bit, especially if there are drawings or other graphics, but I think the average is about 4 hours, perhaps a little more. Posts follow an idea–draft–hack–review–publish process, and this might be months long: we currently have 52 draft posts in the pipeline! Some may never make it out...

We'd love to have some other voices on the site, so if you feel strongly about something in this field, or would like the right to reply to one of our opinion pieces, please get in touch. Or start a blog!

Two decades of geophysics freedom

This year is the 20th anniversary of the release of Seismic Un*x as free software. It is six years since the first open software workshop at EAGE. And it is one year since the PTTC open source geoscience workshop in Houston, where I first met Karl Schleicher, Joe Dellinger, and a host of other open source advocates and developers. The EAGE workshop on Friday looked back on all of this, surveyed the current landscape, and looked forward to an ever-increasing rate of invention and implementation of free and open geophysics software.

Rather than attempting any deep commentary, here's a rundown of the entire day. Please read on...

Read More

The science of things we don't understand

I am at the EAGE Conference & Exhibition in Copenhagen. Yesterday I wrote up my highlights from Day 2. Today it's, yep, Day 3!

Amusingly, and depressingly, the highlight of the morning was the accidental five minute gap between talks in the land seismic acquisition session. Ralf Ferber and Felix Herrmann began spontaneously debating the sparsity of seismic data (Ferber doubting it, Herrmann convinced of it), and there was a palpable energy in the room. I know from experience that it is difficult to start conversations like this on purpose, but conferences need more of this.

There was some good stuff in Ralf's two talks as well. I am getting out of my depth when it comes to non-uniform sampling (and the related concept of compressive sensing), but I am a closet signal analyst and I get a kick out of trying to follow along. The main idea is that you want to break aliasing, a type of coherent noise and a harmful artifact, arising from regular sampling (right). The way to break it is to introduce randomness and irregularity—essentially to deliberately introduce errors in the data. Ralf's paper suggested randomly reversing the polarity of receivers, but there are other ways. The trick is that we know what errors we introduced.

Geothermal in Canada. Image: GSC. As Evan mentioned recently, we've been doing a lot of interpretation on geothermal projects recently. And we both worked in the past on oil sands projects. Today I saw a new world of possiblity open up as Simon Weides of GFZ Potsdam gave his paper, Geothermal exploration of Paleozoic formations in central Alberta, Canada. He has assessed two areas: the Edmonton Peace River regions, but only described the former today. While not hot enough for electricity generation, the temperature in the Cambrian (81°–89°C) is suitable for so-called district heating projects, though it's so tight it would need fraccing. The Devonian is cooler, at 36°–59°C, but still potentially useful for greenhouses and domestic heat. The industrial applications in Alberta, where drilling is easy and inexpensive, are manifold.

I wandered in at the end of what seemed to be the most popular geophysics talk of the conferece: Guus Berkhout's Full wavefield migration — utilization of multiples in seismic migration. While I missed the talk, I was in time to catch a remark of his that resonated with me:

Perhaps we don't need the science of signals, but the science of noise. The science of noise is the science of things we don't understand, and that is the best kind of science. 

Yes! We, as scientists in the service of man, must get better at thinking about, worrying about, and talking about the things we don't understand. If I was feeling provocative, I might even say this: the things we understand are boring.

The brick image shows spatial aliasing resulting from poor sampling. Source: Wikipedian cburnett, under GFDL.

Geophysics bliss

For the first time in over 20 years, the EAGE Conference and Exhibition is in Copenhagen, Denmark. Since it's one of my favourite cities, and since there is an open source software workshop on Friday, and since I was in Europe anyway, I decided to come along. It's my first EAGE since 2005 (Madrid).

Sunday and Monday saw ten workshops on a smörgåsbord of topics from broadband seismic to simulation and risk. The breadth of subject matter is a reminder that this is the largest integrated event in our business: geoscientists and engineers mingle in almost every session of the conference. I got here last night, having missed the first day of sessions. But I made up for it today, catching 14 out of the 208 talks on offer, and missing 100% of the posters. If I thought about it too long, this would make me a bit sad, but I saw some great presentations so I've no reason to be glum. Here are some highlights...

One talk this afternoon left an impression. Roberto Herrera of the BLind Identification of Seismic Signals (BLISS, what else?) project at the University of Alberta, provoked the audience with talk of Automated seismic-to-well ties. Skeptical glances were widely exchanged, but what followed was an elegant description of cross-correlation, and why it fails to correlate across changes in scale or varying time-shifts. The solution: Dynamic Time Warping, an innovation that computes the Euclidean distance between every possible pair of samples. This process results in a matrix of cross-correlations, the minimal cost path across this matrix is the optimal correlation. Because this path does not necessarily correlate time-equivalent samples, time is effectively warped. Brilliant. 

I always enjoy hearing about small, grass-roots efforts at the fringes. Johannes Amtmann of Joanneum Research Resources showed us the foundations of a new online resource for interpreters (Seismic attribute database for time-effective literature search). Though not yet online, seismic-attribute.info will soon allow anyone to search a hand-picked catalog of more than 750 papers on seismic attributes (29% of which are from The Leading Edge, 13% from Geophysics, 10% from First Break, and the rest from other journals and conferences). Tagged with 152 keywords, papers can be filtered for, say, papers on curvature attributes and channel interpretation. We love Mendeley for managing references, but this sounds like a terrific way to jump-start an interpretation project. If there's a way for the community at large to help curate the project, or even take it in new directions, it could be very exciting.

One of the most enticing titles was from Jan Bakke of Schlumberger: Seismic DNA — a novel seismic feature extraction method using non-local and multi-attribute sets. Jan explained that auto-tracking usually only uses data from the immediate vicinity of the current pick, but human interpreters look at the stacking pattern to decide where to pick. To try to emulate this, Jan's approach is to use the simple-but-effective approach of regular expression matching. This involves thresholding the data so that it can be represented by discrete classes (a, b, c, for example). The interpreter then builds regex rules, which Jan calls nucleotides, to determine what constitutes a good pick. The rules operate over a variable time window, thus the 'non-local' label. Many volumes can influence the outcome as concurrent expressions are combined with a logical AND. It would be interesting to compare the approach to ordinary trace correlation, which also accounts for wave shape in an interval.

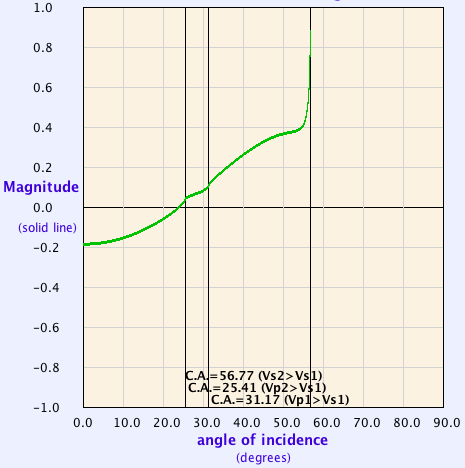
SV reflectivity with offset. Notice the zero-crossing at about 24° and the multiple critical angles. The first talk of the day was a mind-bending (for me) exploration of the implications of Brewster's angle — a well-understood effect in optics — for seismic waves in elastic media. In Physical insight into the elastic Brewster's angleBob Tatham (University of Texas at Austin) had fun with shear wave ray paths for shear waves, applying some of Aki and Richards's equations to see what happens to reflectivity with offset. Just as light is polarized at Brewster's angle (hence Polaroid sunglasses, which exploit this effect), the reflectivity of SV waves drops to zero at relatively short offsets. Interestingly, the angle (the Tatham angle?) is relatively invariant with Vp/Vs ratio. Explore the effect yourself with the CREWES Zoeppritz Explorer.

That's it for highlights. I found most talks were relatively free from marketing. Most were on time, though sometimes left little time for questions. I'm looking forward to tomorrow.

If you were there today, I'd love to hear about talks you enjoyed. Use the comments to share.

Your child is dense for her age

Alan Cohen, veteran geophysicist and Chief Scientist at RSI, secured the role of provacateur by posting this question on the rock physics group on LinkedIn. He has shown that the simplest concepts are worthy of debate.

From a group of 1973 members, 44 comments ensued over the 23 days since he posted it. This has got to be a record for this community (trust me I've checked). It turns out the community is polarized, and heated emotions surround the topic. The responses that emerged are a fascinating narrative of niche and tacit assumptions seldomly articulated.

Any two will do

Why are two dimensions used, instead of one, three, four, or more? Well for one, it is hard to look at scatter plots in 3D. More fundamentally, a key learning from the wave equation and continuum mechanics is that, given any two elastic properties, any other two can be computed. In other words, for any seismically elastic material, there are two degrees of freedom. Two parameters to describe it.

  • P- and S-wave velocities
  • P-impedance and S-impedance
  • Acoustic and elastic impedance
  • R0 and G, the normal-incidence reflectivity and the AVO gradient
  • Lamé's parameters, λ and μ 

Each pair has its time and place, and as far as I can tell there are reasons that you might want to re-parameterize like this:

  1. one set of parameters contains discriminating evidence, not visible in other sets;
  2. one set of parameters is a more intuitive or more physical description of the rock—it is easier to understand;
  3. measurement errors and uncertainties can be elucidated better for one of the choices. 

Something missing from this thread, though, is the utility of empirical templates to makes sense of the data, whichever domain is adopted.

Measurements with a backdrop

In child development, body mass index (BMI) is plotted versus age to characterize a child's physical properties using the backdrop of an empirically derived template sampled from a large population. It is not so interesting to say, "13 year old Miranda has a BMI of 27", it is much more telling to learn that Miranda is above the 95th percentile for her age. But BMI, which is defined as weight divided by height squared, in not particularity intuitive. If kids were rocks, we'd submerge them Archimedes style into a bathtub, measure their volume, and determine their density. That would be the ultimate description. "Whoa, your child is dense for her age!" 

We do the same things with rocks. We algebraically manipulate measured variables in various ways to show trends, correlations, or clustering. So this notion of a template is very important, albeit local in scope. Just as a BMI template for Icelandic children might not be relevant for the pygmies in Paupa New Guinea, rock physics templates are seldom transferrable outside their respective geographic regions. 

For reference see the rock physics cheatsheet.

Thermogeophysics, whuh?

Earlier this month I spent an enlightening week in Colorado at a peer review meeting hosted by the US Department of Energy. Well-attended by about 300 people from organizations like Lawerence Livermore Labs, Berkeley, Stanford, Sandia National Labs, and *ahem* Agile, delegates heard about a wide range of cost-shared projects in the Geothermal Technologies Program. Approximately 170 projects were presented, representing a total US Department of Energy investment of $340 million.

I was at the meeting because we've been working on some geothermal projects in California's Imperial Valley since last October. It's fascinating, energizing work. Challenging too, as 3D seismic is not a routine technology for geothermal, but it is emerging. What is clear is that geothermal exploration requires a range of technologies and knowledge. It pulls from all of the tools you could dream up; active seismic, passive seismic, magnetotellurics, resistivity, LiDAR, hyperspectral imaging, not to mention the borehole and drilling technologies. The industry has an incredible learning curve ahead of them if Enhanced Geothermal Systems (EGS) are going to be viable and scalable.

The highlights of the event for me were not the talks that I saw, but the people I met during coffee breaks:

John McLennan & Joseph Moore at the the University of Utah have done some amazing laboratory experiments on large blocks of granite. They constructed a "proppant sandwich", pumped fluid through it, and applied polyaxial stress to study geochemical and stress effects on fracture development and permeability pathways. Hydrothermal fluids alter the proppant and gave rise to wormhole-like collapse structures, similar to those in the CHOPS process. They incorporated diagnostic imaging (CT-scans, acoustic emission tomography, x-rays), with sophisticated numerical simulations. A sign that geothermal practitioners are working to keep science up to date with engineering.

Stephen Richards bumped into me in the corridor after lunch after he overheard me talking about the geospatial work that I did with the Nova Scotia Petroleum database. It wasn't five minutes that passed before he rolled up his sleeves, took over my laptop, and was hacking away. He connected the WMS extension that he built as part of the State Geothermal Data to QGIS on my machine, and showed me some of the common file formats and data interchange content models for curating geothermal data on a continental scale. The hard part isn't nessecarily the implementation, the hard part is curating the data. And it was a thrill to see it thrown together, in minutes, on my machine. A sign that there is a huge amount of work to be done around opening data.

Dan Getman - Geospatial Section lead at NREL gave a live demo of the fresh prospector interface he built that is accesible through OpenEI. I mentioned OpenEI briefly in the poster presentation that I gave in Golden last year, and I can't believe how much it has improved since then. Dan once again confirmed this notion that the implementation wasn't rocket science, (surely any geophysicist could figure it out), and in doing so renewed my motivation for extending the local petroleum database in my backyard. A sign that geospatial methods are at the core of exploration and discovery.

There was an undercurrent of openness surrounding this event. By and large, the US DOE is paying for half of the research, so full disclosure is practically one of the terms of service. Not surprisingly, it feels more like science going on here, where innovation is being subsidized and intentionally accelerated because there is a demand. Makes me think that activity is a nessecary but not sufficient metric for innovation.

Geophysicists are awesome

Thirty-nine amazing, generous, inpiring authors contributed to our soon-to be released book about exploration geoscience. A few gave us more than one chapter: Brian Russell, Rachel Newrick, and Dave Mackidd each gave us three, and Clare Bond, José M Carcione, Don Herron, and Rob Simm did two. We humbly thank them for their boudless energy — we're happy to have provided an outlet! And Evan and I each did three chapters, partly because I was obsessed with getting to the completely arbitrary number 52. It just seemed 'right'. 

There are biographies on all the authors in the book, so you can find out for yourself what a diversity of backgrounds there is. By the numbers, out of 39 authors...

  • 10 are connected in some way to academia (5 of them full-time)
  • 19 are North American
  • 22 currently work in North America
  • 1515 papers and 14 books have been written by this crowd (not including this one :)

Update on the book: we got our proof copies on Friday and spent the weekend combing it for errors. There was nothing catastrophic, so the bugs were fixed and the book is ready! We are completely new to this self-publishing lark, so I'm not certain how the next bit goes, but I think it will be live in Amazon this Friday, a whole week early. Probably.

What happens next is also not completely clear yet. We are working on the Kindle edition, which should be out soon. In terms of layout, digital books are less complicated than print books, so we are mostly removing things that don't work or don't make sense in ebooks: page numbers, fancy formatting, forced line-breaks, etc. Once the Kindle edition is out, we will have a go at other platforms (iBooks, Google Books). Then we will turn to the web and start getting the material online, where it will no doubt be different again.

We'll keep you, dear reader, up to date right here. 

What's inside? 52 things!

On Tuesday we announced our forthcoming community collaboration book. So what's in there? So much magic, it's hard to know where to start. Here's a list of the first dozen chapters:

  1. Anisotropy is not going away, Vladimir Grechka, Shell
  2. Beware the interpretation-to-data trap, Evan Bianco, Agile
  3. Calibrate your intuition, Taras Gerya, ETH Zürich
  4. Don’t ignore seismic attenuation, Carl Reine, Nexen
  5. Don’t neglect your math, Brian Russell, Hampson-Russell
  6. Don’t rely on preconceived notions, Eric Andersen, Talisman
  7. Evolutionary understanding in seismic interpretation, Clare Bond, University of Aberdeen
  8. Explore the azimuths, David Gray, Nexen
  9. Five things I wish I’d known, Matt Hall, Agile
  10. Geology comes first, Chris Jackson, Imperial College London
  11. Geophysics is all around, José M Carcione, OGS Trieste, Italy
  12. How to assess a colourmap, Matteo Niccoli, MyCarta blog
  13. ...

When I read that list, I cannot wait to read the book — and I've read it three times already! This is not even one quarter of the book. You can guess from the list that some are technical, others are personal, a few may be controversial.

One thing we had fun with was organizing the contents. The chapters are, as you see, in alphabetical order. But each piece has thematic tags. Some were a little hard to classify, I admit, and some people will no doubt wonder why, say, Bill Goodway's The magic of Lamé is labeled 'basics', but there you go.

One thing I did with the tags was try to group the chapters according to the tags they had. Each chapter has three tags. If we connect the three tags belonging to an individual chapter, and do the same for every chapter, then we can count the connections and draw a graph (right). I made this one in Gephi

The layout is automatic: relative positions are calculated by modeling the connections as springs whose stiffness depends on the number of links. Node size is a function of connectedness. Isn't it great that geology is in the middle?

Now, without worrying too much about the details, I used the graph to help group the chapters non-exclusively into the following themes:

  • Fundamentals  basics, mapping (16 chapters)
  • Concepts  geology, analogs (12 chapters)
  • Interpretation  needed a theme of its own (21 chapters)
  • Power tools  attributes, ninja skills (9 chapters)
  • Pre-stack  rock physics, pre-stack, processing (11 chapters)
  • Quantitative  mathematics, analysis (20 chapters)
  • Integration  teamwork, workflow (15 chapters)
  • Innovation  history, innovation, technology (9 chapters)
  • Skills  learning, career, managing (15 chapters)

I think this accurately reflects the variety in the book. Next post we'll have a look at the variety among the authors — perhaps it explains the breadth of themes. 

Today's the day!

We're super-excited. We said a week ago we'd tell you why today. 

At the CSEG-CSPG conference last year, we hatched a plan. The idea was simple: ask as many amazing geoscientists as we could to write something fun and/or interesting and/or awesome and/or important about geophysics. Collect the writings. Put them in a book and/or ebook and/or audiobook,... and sell it at a low price. And also let the content out into the wild under a creative commons license, so that others can share it, copy it, and spread it.

So the idea was conceived as Things You Should Know About Geophysics. And today the book is born... almost. It will be available on 1 June, but you can see it right now at Amazon.com, pre-order or wish-list it. It will be USD19, or about 36 cents per chapter. For realz.

The brief was deliberately vague: write up to 600 words on something that excites or inspires or puzzles you about exploration geophysics. We had no idea what to expect. We knew we'd get some gold. We hoped for some rants.

Incredibly, within 24 hours of sending the first batch of invites, we had a contribution. We were thrilled, beyond thrilled, and this was the moment we knew it would work out. Like any collaborative project, it was up and down. We'd get two or three some days, then nothing for a fortnight. We extended deadlines and crossed fingers, and eventually called 'time' at year's end, with 52 contributions from 38 authors.

Like most of what we do, this is a big experiment. We think we can have it ready for 1 June but we're new to this print-on-demand lark. We think the book will be in every Amazon store (.ca, .co, .uk, etc), but it might take a few weeks to roll through all the sites. We think it'll be out as an ebook around the same time. Got an idea? Tell us how we can make this book more relevant to you!

News of the month

Welcome to our more-or-less regular new post. Seen something awesome? Get in touch!

Convention time!

Next week is Canada's annual petroleum geoscience party, the CSPGCSEGCWLS GeoConvention. Thousands of applied geoscientists will descend on Calgary's downtown Telus Convention Centre to hear about the latest science and technology in the oilfield, and catch up with old friends. We're sad to be missing out this year — we hope someone out there will be blogging!

GeoConvention highlights

There are more than fifty technical sessions at the conference this year. For what it's worth, these are the presentations we'd be sitting in the front row for if we were going:

Now run to the train and get to the ERCB Core Research Centre for...

Guided fault interpretation

We've seen automated fault interpretation before, and now Transform have an offering too. A strongly tech-focused company, they have a decent shot at making it work in ordinary seismic data — the demo shows a textbook example:

GPU processing on the desktop

On Monday Paradigm announced their adoption of NVIDIA's Maximus technology into their desktop applications. Getting all gooey over graphics cards seems very 2002, but this time it's not about graphics — it's about speed. Reserving a Quadro processor for graphics, Paradigm is computing seismic attributes on a dedicated Tesla graphics processing unit, or GPU, rather than on the central processing unit (CPU). This is cool because GPUs are massively parallel and are much, much faster at certain kinds of computation because they don't have the process management, I/O, and other overheads that CPUs have. This is why seismic processing companies like CGGVeritas are adopting them for imaging. Cutting edge stuff!

In other news...

This regular news feature is for information only. We aren't connected with any of these organizations, and don't necessarily endorse their products or services.