Which programming language should you learn first?

The question I get asked most often is:

I want to learn to code, where should I start?

To which there’s really no perfect answer. It depends on a lot of things… Why do you want to learn to program? What domain are you in? Have you tried before? Do you like computers? Do your colleagues use anything in particular?

Undeterred by the futility, and inspired by an awesome blog post on freecodecamp.org, which advises you to learn JavaScript (not terrible advice), I thought I’d try to answer the question — for scientists. I adapted a rather old decision tree in that blog post to the specific needs of scientists. Here is the latest version:

which.png

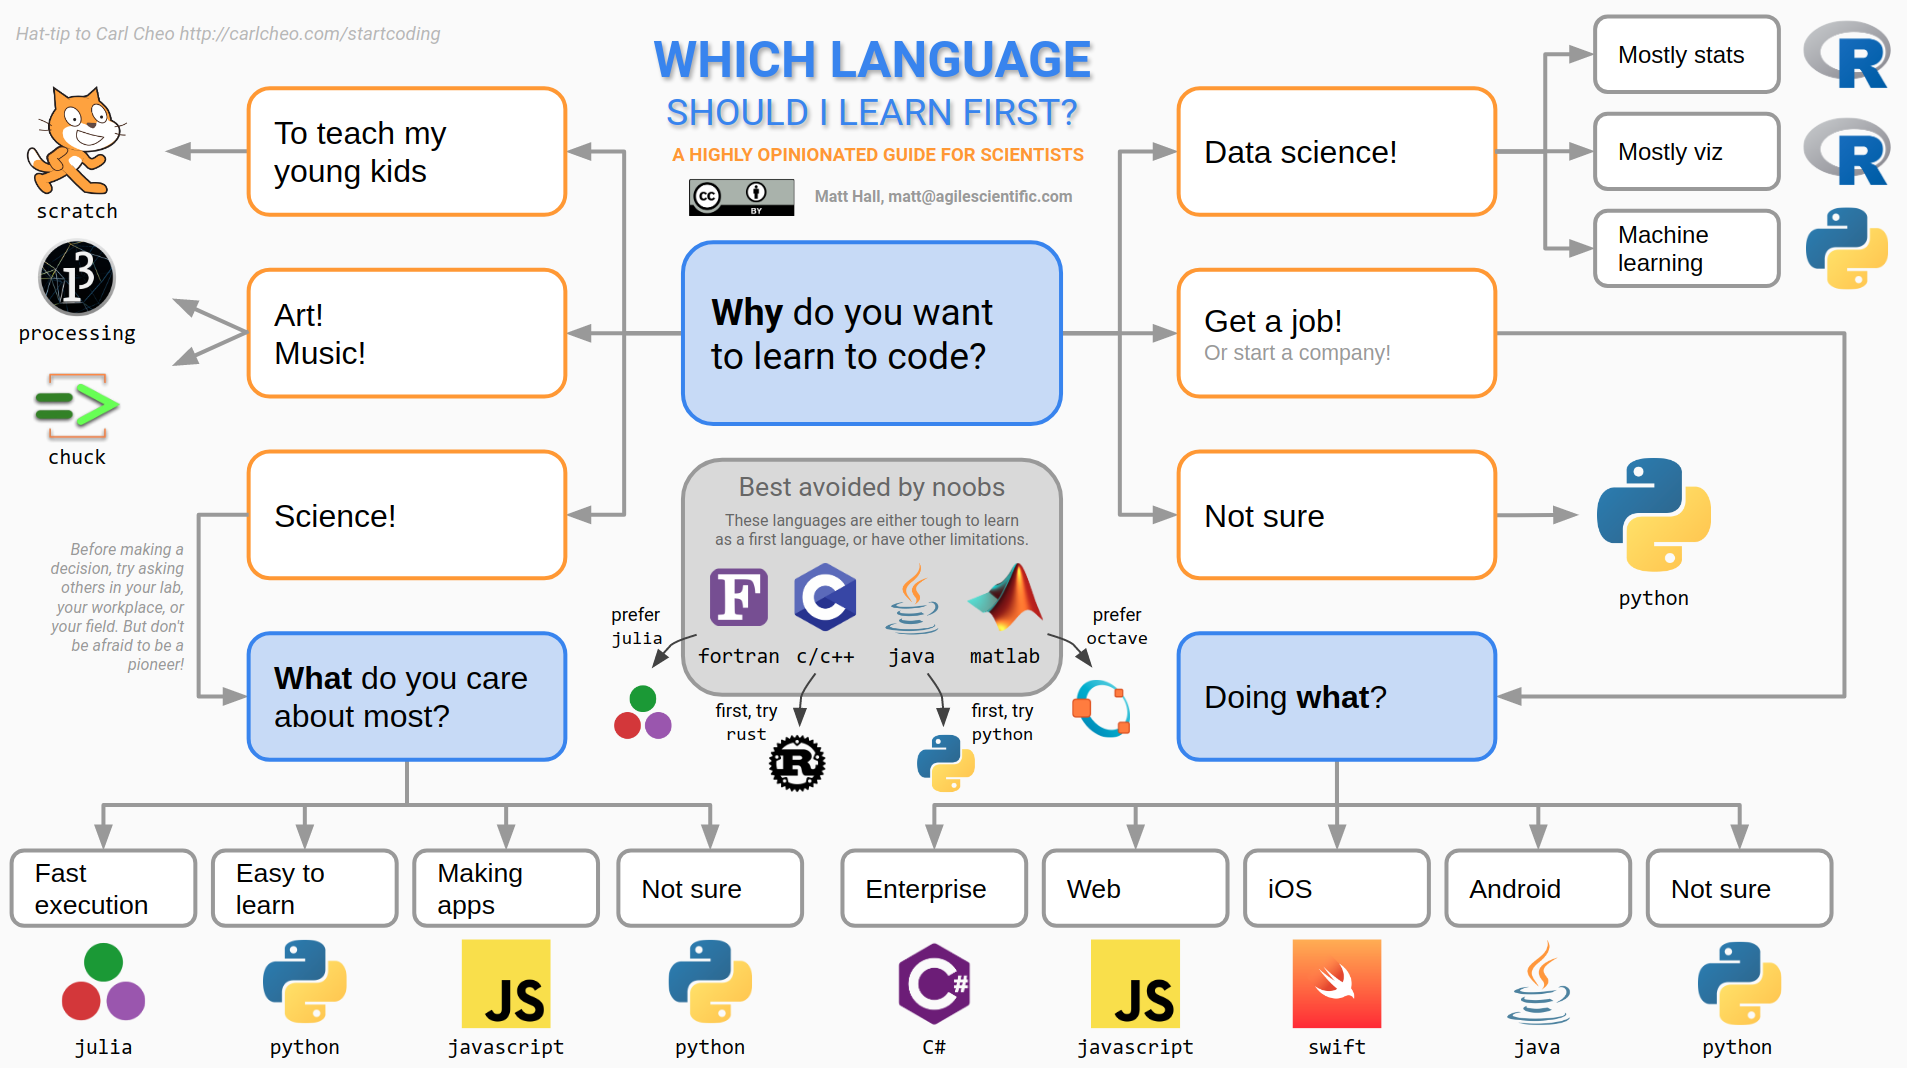
Yes, it does have a lot of Python on it. Yes, I am biased.

These sorts of things are necessarily rather one-dimensional. In an effort to give general advice, all the interesting corners are sanded down. For instance, there is definitely some domain specificity to languages. In the subsurface domain, a lot of geophysicists learned their craft in MATLAB, but today are excited about Julia. I think environmental folks are more into R. Geologists mostly still like coloured pencils best. And of course reservoir engineers mastered VBA years ago. Clearly, if you’re learning to code to start a postgraduate degree, you should probably find out what language others in your lab are using before you crack into that old copy of FORTRAN in a Weekend.*

Anyway, this decision tree thing provoked quite a bit of discussion on Software Underground and Twitter. Some people felt challenged, although my purpose was to suggest a starting point for people, not to say “Never touch Java” (although, seriously, never touch Java). It’s natural — learning to master a language takes years and people are sensitive to perceived criticism of how they spent their time. But this misses the point a bit — programming is really just about getting things done, preferably in an open language (<cough> not MATLAB). So what’s the quickest path for a new programmer to start getting things done?

I appreciated this thoughtful comment from Kris Kuhlman:

I think it worked out more or less that way for me. I learned a bit of BASIC as a 12-year-old, and knew enough assembly to crash a BBC Micro. Then I learned awk in 1993, and used it for basically everything — including many things it certainly was not designed for. I tried and failed to learn Java in 2002, instead picking up MATLAB… which led to Python in about 2008. I was a slow learner though; it took years to be convinced that I needed NumPy. (Yes, you can load seismic as a list of lists.)

In the end, you need several tools in your belt. Several people pointed out that SQL (a so-called ‘domain specific language’ rather than a full-blown programming language) is incredibly useful to know. I think you could say the same for HTML and maybe even XML — or perhaps JSON these days. Then again, maybe these stretch the definition of ‘programming language’ a bit too far. Besides, if you write code, you’ll meet them eventually.

In the end, the point is to get things done. Every language on that tree will enable you to get things done. (Admittedly, Scratch, Processing, ChucK have rather narrow domains.) Fortran has been around for 70 years (not a typo) and is still in the top 20 languages. So don’t sweat it — if Kris is right, you’ll need to learn 2 languages before one sticks anyway.


* There is no such book, lol.

Reproduce this!

logo_simple.png

There’s a saying in programming: untested code is broken code. Is unreproducible science broken science?

I hope not, because geophysical research is — in general — not reproducible. In other words, we have no way of checking the results. Some of it, hopefully not a lot of it, could be broken. We have no way of knowing.

Next week, at the SEG Annual Meeting, we plan to change that. Well, start changing it… it’s going to take a while to get to all of it. For now we’ll be content with starting.

We’re going to make geophysical research reproducible again!

Welcome to the Repro Zoo!

If you’re coming to SEG in Anaheim next week, you are hereby invited to join us in Exposition Hall A, Booth #749.

We’ll be finding papers and figures to reproduce, equations to implement, and data tables to digitize. We’ll be hunting down datasets, recreating plots, and dissecting derivations. All of it will be done in the open, and all the results will be public and free for the community to use.

You can help

There are thousands of unreproducible papers in the geophysical literature, so we are going to need your help. If you’ll be in Anaheim, and even if you’re not, here some things you can do:

That’s all there is to it! Whether you’re a coder or an interpreter, whether you have half an hour or half a day, come along to the Repro Zoo and we’ll get you started.

Figure 1 from Connolly’s classic paper on elastic impedance. This is the kind of thing we’ll be reproducing.

Figure 1 from Connolly’s classic paper on elastic impedance. This is the kind of thing we’ll be reproducing.

Weekend worship in Salt Lake City

The Salt Lake City hackathon — only the second we've done with a strong geology theme — is a thing of history, but you can still access the event page to check out who showed up and who did what. (This events page is a new thing we launched in time for this hackathon; it will serve as a public document of what happens at our events, in addition to being a platform for people to register, sponsor, and connect around our events.) 

In true seat-of-the-pants hackathon style we managed to set up an array of webcams and microphones to record the finale. The demos are the icing on the cake. Teams were selected at random and were given 4 minutes to wow the crowd. Here is the video, followed by a summary of what each team got up to... 


Unconformist.ai

Didi Ooi (University of Bristol), Karin Maria Eres Guardia (Shell), Alana Finlayson (UK OGA), Zoe Zhang (Chevron). The team used machine learning the automate the mapping of unconformities in subsurface data. One of the trickiest parts is building up a catalog of data-model pairs for GANs to train on. Instead of relying on thousand or hundreds of thousands of human-made seismic interpretations, the team generated training images by programmatically labelling pixels on synthetic data as being either above (white) or below (black) the unconformity. Project pageSlides.

unconformist.ai_preso

Outcrops Gee Whiz

Thomas Martin (soon Colorado School of Mines), Zane Jobe (Colorado School of Mines), Fabien Laugier (Chevron), and Ross Meyer (Colorado School of Mines). The team wrote some programs to evaluate facies variability along drone-derived digital outcrop models. They did this by processing UAV point cloud data in Python and classified different rock facies using using weather profiles, local cliff face morphology, and rock colour variations as attributes. This research will help in the development drone assisted 3D scanning to automate facies boundaries mapping and rock characterization. RepoSlides.

SLC_outcrop_geewhiz_blog.png

Jet Loggers

Eirik Larsen and Dimitrios Oikonomou (Earth Science Analytics), and Steve Purves (Euclidity). This team of European geoscientists, with their circadian clocks all out of whack, investigated if a language of stratigraphy can be extracted from the rock record and, if so, if it can be used as another tool for classifying rocks. They applied natural language processing (NLP) to an alphabetic encoding of well logs as a means to assist or augment the labour-intensive tasks of classifying stratigraphic units and picking tops. Slides.


SLC_NLP_jet_loggers.png
SLC_bookcliffs.png

Book Cliffs Bandits

Tom Creech (ExxonMobil) and Jesse Pisel (Wyoming State Geological Survey). The team started munging datasets in the Book Cliffs. Unfortunately, they really did not have the perfect, ready to go data, and by the time they pivoted to some workable open data from Alaska, their team name had already became a thing. The goal was build a tool to assist with lithology and stratigraphic correlation. They settled on change-point detection using Bayesian statistics, which they were using to build richer feature sets to test if it could produce more robust automatic stratigraphic interpretation. Repo, and presentation.


A channel runs through it

Nam Pham (UT Austin), Graham Brew (Dynamic Graphics), Nathan Suurmeyer (Shell). Because morphologically realistic 3D synthetic seismic data is scarce, this team wrote a Python program that can take seismic horizon interpretations from real data, then construct richer training data sets for building an AI that can automatically delineate geological entities in the subsurface. The pixels enclosed by any two horizons are labelled with ones, pixels outside this region are labelled with zeros. This work was in support of Nam's thesis research which is using the SegNet architecture, and aims to extract not only major channel boundaries in seismic data, but also the internal channel structure and variability – details that many seismic interpreters, armed even with state-of-the art attribute toolboxes, would be unable to resolve. Project page, and code.

GeoHacker

Malcolm Gall (UK OGA), Brendon Hall and Ben Lasscock (Enthought). Innovation happens when hackers have the ability to try things... but they also need data to try things out on. There is a massive shortage of geoscience datasets that have been staged and curated for machine learning research. Team Geohacker's project wasn't a project per se, but a platform aimed at the sharing, distribution, and long-term stewardship of geoscience data benchmarks. The subsurface realm is swimming with disparate data types across a dizzying range of length scales, and indeed community efforts may be the only way to prove machine-learning's usefulness and keep the hype in check. A place where we can take geoscience data, and put it online in a ready-to-use for for machine learning. It's not only about being open, online and accessible. Good datasets, like good software, need to be hosted by individuals, properly documented, enriched with tutorials and getting-started guides, not to mention properly funded. Website.

SLC_petrodict.png

Petrodict

Mark Mlella (Univ. Louisiana, Lafayette), Matthew Bauer (Anchutz Exploration), Charley Le (Shell), Thomas Nguyen (Devon). Petrodict is a machine-learning driven, cloud-based lithology prediction tool that takes petrophysics measurements (well logs) and gives back lithology. Users upload a triple combo log to the app, and the app returns that same log with with volumetric fractions for it's various lithologic or mineralogical constituents. For training, the team selected several dozen wells that had elemental capture spectroscopy (ECS) logs – a premium tool that is run only in a small fraction of wells – as well as triple combo measurements to build a model for predicting lithology. Repo.

Seismizor

George Hinkel, Vivek Patel, and Alex Waumann (all from University of Texas at Arlington). Earthquakes are hard. This team of computer science undergraduate students drove in from Texas to spend their weekend with all the other geo-enthusiasts. What problem in subsurface oil and gas did they identify as being important, interesting, and worthy of their relatively unvested attention? They took on the problem of induced seismicity. To test whether machine learning and analytics can be used to predict the likelihood that injected waste water from fracking will cause an earthquake like the ones that have been making news in Oklahoma. The majority of this team's time was spent doing what all good scientists do –understanding the physical system they were trying to investigate – unabashedly pulling a number of the more geomechanically inclined hackers from neighbouring teams and peppering them with questions. Induced seismicity is indeed a complex phenomenon, but George's realization that, "we massively overestimated the availability of data", struck a chord, I think, with the judges and the audience. Another systemic problem. The dynamic earth – incredible in its complexity and forces – coupled with the fascinating and politically charged technologies we use for drilling and fracking might be one of the hardest problems for machine learning to attack in the subsurface. 


AAPG next year is in San Antonio. If it runs, the hackathon will be 18–19 of May. Mark your calendar and stay tuned!

A European geo-gaming hackathon

I'm convinced that hackathons are the best way to get geoscientists and engineers inventing and collaborating in new ways. They are better for learning than courses. They are better for networking than parties. And they nearly always have tacos! 

If you are unsure what a hackathon is, or why I'm so enthusiastic about them, you can read my November article in the Recorder (Hall 2015, CSEG Recorder, vol 40, no 9).

The next hackathon will be 28 and 29 May in Vienna, Austria — right before the EAGE Conference and Exhibition. You can sign up right now! Please get it in your calendar and pass it along.

Throwing down the gauntlet

Colorado School of Mines has dominated the student showing at the last 2 autumn hackathons. I know there are plenty more creative research groups out there. Come out and show the world your awesomeness — in teams of up to 4 people — and spend a weekend learning and coding. Also: there will be beer.

To everyone else: this is not a student event, it's for everyone. Most of the participants in the past have been professionals, but the more diverse it is, the more we all get out of it. So don't ask yourself if you'll fit in — you will. 

A word about the fee

Our previous hackathons have been free, but this one has a small fee. It's an experiment. Like most free events, no-shows are a challenge; I'm hoping the fee reduces the problem. If the fee makes it difficult for you to join us, please get in touch — I do not want it to be a barrier.

Just to be clear: these events do not make money. Previous events have been generously sponsored — and that's the only way they can happen. We need support for this one too: if you're a champion of creativity in science and want to support this event, you can find me at matt@agilegeoscience.com, or you can read more about sponsorship here.

Details

The dates are 28 and 29 May. The event will run 8 till 6 (or so) on both the Saturday and the Sunday. We don't have a venue finalized yet. Ideas and contributions of any kind are welcome — this is a community event.

The theme this year will be Games. If you have ideas, share them in the comments! Here are some random project ideas to get you going...

  • Acquisition optimizer: lay out the best geometry to image the geology.
  • Human inversion: add geological layers to match a seismic trace.
  • Drill wells on a budget to make the optimal map of an unseen surface.
  • Which geological section matches the (noisy) seismic section?
  • Top Trumps for global 3D seismic surveys, with data scraped from press releases.
  • Set up the best processing flow based for a modeled, noisy shot gather.

It's going to be fun! If you're traveling to EAGE this year, I hope we see you there!


Photo of Vienna by Nic Piégsa, CC-BY. Photo of bridge by Dragan Brankovic, CC-BY.

A coding kitchen in Stavanger

Last week, I travelled to Norway and held a two day session of our Agile Geocomputing Training. We convened at the newly constructed Innovation Dock in Stavanger, and set up shop in an oversized, swanky kitchen. Despite the industry-wide squeeze on spending, the event still drew a modest turnout of seven geoscientists. That's way more traction then we've had in North America lately, so thumbs up to Norway! And, since our training is designed to be very active, a group of seven is plenty comfortable. 

A few of the participants had some prior experience writing code in languages such as Perl, Visual Basic, and C, but the majority showed up without any significant programming experience at all. 

Skills start with syntax and structures 

The first day we covered basic principles or programming, but because Python is awesome, we dive into live coding right from the start. As an instructor, I find that doing live coding has two hidden benefits: it stops me from racing ahead, and making mistakes in the open gives students permission to do the same. 

Using geoscience data right from the start, students learn about key data structures: lists, dicts, tuples, and sets, and for a given job, why they might chose between them. They wrote their own mini-module containing functions and classes for getting stratigraphic tops from a text file. 

Since syntax is rather dry and unsexy, I see the instructor's main role to inspire and motivate through examples that connect to things that learners already know well. The ideal containers for stratigraphic picks is a dictionary. Logs, surfaces, and seismic, are best cast into 1-, 2, and 3-dimensional NumPy arrays, respectively. And so on.

Notebooks inspire learning

We've seen it time and time again. People really like the format of Jupyter Notebooks (formerly IPython Notebooks). It's like there is something fittingly scientific about them: narrative, code, output, repeat. As a learning document, they aren't static — in fact they're meant to be edited. But they aren't so open-ended that learners fail to launch. Professional software developers may not 'get it', but scientists really subscribe do. Start at the start, end at the end, and you've got a complete record of your work. 

You don't get that with the black-box, GUI-heavy software applications we're used to. Maybe, all legitimate work should be reserved for notebooks: self-contained, fully-reproducible, and extensible. Maybe notebooks, in their modularity and granularity, will be the new go-to software for technical work.

Outcomes and feedback

By the end of day two, folks were parsing stratigraphic and petrophysical data from text files, then rendering and stylizing illustrations. A few were even building interactive animations on 3D seismic volumes.  One recommendation was to create a sort of FAQ or cookbook: "How do I read a log?", "How do I read SEGY?", "How do I calculate elastic properties from a well log?". A couple of people of remarked that they would have liked even more coached exercises, maybe even an extra day; a recognition of the virtue of sustained and structured practice.


Want training too?

Head to our courses page for a list of upcoming courses, or more details on how you can train your team


Photographs in this post are courtesy of Alessandro Amato del Monte via aadm on Flickr

Corendering attributes and 2D colourmaps

The reason we use colourmaps is to facilitate the human eye in interpreting the morphology of the data. There are no hard and fast rules when it comes to choosing a good colourmap, but a poorly chosen colourmap can make you see features in your data that don't actually exist. 

Colourmaps are typically implemented in visualization software as 1D lookup tables. Given a value, what colour should I plot it? But most spatial data is multi-dimensional, and it's useful to look at more than one aspect of the data at one time. Previously, Matt asked, "how many attributes can a seismic interpreter show with colour on a single display?" He did this by stacking up a series of semi-opaque layers, each one assigned its own 1D colourbar. 

Another way to add more dimensions to the display is corendering. This effectively adds another dimension to the colourmap itself: instead of a 1D colour line for a single attribute, for two attributes we're defining a colour square; for 3 attributes, a colour cube, and so on.

Let's illustrate this by looking at a time-slice through a portion of the F3 seismic volume. A simple way of displaying two attributes is to decrease the opacity of one, and lay it on top of the other. In the figure below, I'm setting the opacity of the continuity to 75% in the third panel. At first glance, this looks pretty good; you can see both attributes, and because they have different hues, they complement each other without competing for visual bandwidth. But the approach is flawed. The vividness of each dataset is diminished; we don't see the same range of colours as we do in the colour palette shown above.

Overlaying one map on top of the other is one way to look at multiple attributes within a scene. It's not ideal however.

Overlaying one map on top of the other is one way to look at multiple attributes within a scene. It's not ideal however.

Instead of overlaying maps, we can improve the result by modulating the lightness of the amplitude image according to the magnitude of the continuity attribute. This time the corendered result is one image, instead of two. I prefer it, because it preserves the original colours we see in the amplitude image. If anything, it seems to deepen the contrast:

The lightness value of the seismic amplitude time slice has been modulated by the continuity attribute.&nbsp;

The lightness value of the seismic amplitude time slice has been modulated by the continuity attribute. 

Such a composite display needs a two-dimensional colormap for a legend. Just as a 1D colourbar, it's also a lookup table; each position in the scene corresponds to a unique pair of values in the colourmap plane.

We can go one step further. Say we want to emphasize only the largest discontinuities in the data. We can modulate the opacity with a non-linear function. In this example, I'm using a sigmoid function:

In order to achieve this effect in most conventional software, you usually have to copy the attribute, colour it black, apply an opacity curve, then position it just above the base amplitude layer. Software companies call this workaround a 'workflow'. 

Are there data visualizations you want to create, but you're stuck with software limitations? In a future post, I'll recreate some cool co-rendering effects; like bump-mapping, and hill-shading.

To view and run the code that I used in creating the images for this post, grab the iPython/Jupyter Notebook.


You can do it too!

If you're in Calgary, Houston, New Orleans, or Stavanger, listen up!

If you'd like to gear up on coding skills and explore the benefits of scientific computing, we're going to be running the 2-day version of the Geocomputing Course several times this fall in select cities. To buy tickets or for more information about our courses, check out the courses page.

None of these times or locations good for you? Consider rounding up your colleagues for an in-house training option. We'll come to your turf, we can spend more than 2 days, and customize the content to suit your team's needs. Get in touch.