May linkfest

The pick of the links from the last couple of months. We look for the awesome, so you don't have to :)

ICYMI on Pi Day, pimeariver.com wants to check how close river sinuosity comes to pi. (TL;DR — not very.)

If you're into statistics, someone at Imperial College London recently released a nice little app for stochastic simulations of simple calculations. Here's a back-of-the-envelope volumetric calculation by way of example. Good inspiration for our Volume* app.

I love it when people solve problems together on the web. A few days ago Chris Jackson (also at Imperial) posted a question about converting projected coordinates...

I responded with a code snippet that people quickly improved. Chris got several answers to his question, and I learned something about the pyproj library. Open source wins again!

In answering that question, I also discovered that Github now renders most IPython Notebooks. Sweet!

Speaking of notebooks, Beaker looks interesting: individual code blocks support different programming languages within the same notebook and allow you to pass data from one cell to another. For instance, you could do your basic stuff in Python, computationally expensive stuff in Julia, then render a visualization with JavaScript. Here's a simple example from their site.

Python is the language for science, but JavaScript certainly rules the visual side of the web. Taking after JavaScript data-artists like Bret Victor and Mike Bostock, Jack Schaedler has built a fantastic website called Seeing circles, sines, and signals containing visual explanations of signal processing concepts.

If that's not enough for you, there's loads more where that came from: Gallery of Concept Visualization. You're welcome.

My recent notebook about finding small things with 2D seismic grids sparked some chatter on Twitter. People had some great ideas about modeling non-random distributions, like clustered or anisotropic populations. Lots to think about!

Getting help quickly is perhaps social media's most potent capability — though some people do insist on spoiling everything by sharing U might be a genius if u can solve this! posts (gah, stop it!). Earth Science Stack Exchange is still far from being the tool is can be, but there have been some relevant questions on geophysics lately:

A fun thread came up on Reddit too recently: Geophysics software you wish existed. Perfect for inspiring people at hackathons! I'm keeping a list of hacky projects for the next one, by the way.

Not much to say about 3D models in Sketchfab, other than: they're wicked! I mean, check out this annotated anticline. And here's one by R Mahon based on sedimentological experiments by John Shaw and others...

February linkfest

The linkfest is back! All the best bits from the news feed. Tips? Get in touch.

The latest QGIS — the free and open-source GIS we use — dropped last week. QGIS v2.8 'Wien' has lots of new features like expressions in property fields, better legends, and colour palettes.

On the subject of new open-source software, I've mentioned Wayne Mogg's OpendTect plug-ins before. This time he's outdone himself, with an epic new plug-in providing an easy way to write OpendTect attributes in Python. This means we can write seismic attribute algorithms in Python, using OpendTect for I/O,project management, visualization, and interpretation. 

It's not open source, but Google Earth Pro is now free! The free version was pretty great, but Pro has a few nice features, like better measuring tools, higher resolution screen-grabs, movies, and ESRI shapefile import. Great for scoping field areas.

Speaking of fieldwork, is this the most amazing outcrop you've ever seen? Those are house-sized blocks floating around in a mass-transport deposit. If you want to know more, you're in luck, because Zane Jobe blogged about it recently.  (You do follow his blog, right?)

By the way, if sedimentology is your thing, for some laboratory eye-candy, follow SedimentExp on Twitter. (Zane's on Twitter too!)

If you like to look after your figures, Rougier et al. recently offered 10 simple rules for making them better. Not only is the article open access (more amazing: it's public domain), the authors provide Python code for all their figures. Inspiring.

Open, even interactive, code will — it's clear — be de rigueur before the decade is out. Even Nature is at it. (Well, I shouldn't say 'even', because Nature is a progressive publishing hose, at the same time as being part of 'the establishment'.) Take a few minutes to play with it... it's pretty cool. We have published lots of static notebooks, as has SEG; interactivity is coming!

A question came up recently on the Earth Science Stack Exchange that made me stop and think: why do geophysicists use \(V_\mathrm{P}/V_\mathrm{S}\) ratio, and not \(V_\mathrm{S}/V_\mathrm{P}\) ratio, which is naturally bounded. (Or is it? Are there any materials for which \(V_\mathrm{S} > V_\mathrm{P}\)?) I think it's tradition, but maybe you have a better answer?

On the subject of geophysics, I think this is the best paper title I've seen for a while: A current look at geophysical detection of illicit tunnels (Steve Sloan in The Leading Edge, February 2015). Rather topical just now too.

At the SEG Annual Meeting in Denver, I recorded an interview with SEG's Isaac Farley about wikis and knowledge sharing...

OK, well if this is just going to turn into blatant self-promotion, I might as well ask you to check out Pick This, now with over 600 interpretations! Please be patient with it, we have a lot of optimization to do...

October linkfest

The linkfest has come early this month, to accommodate the blogging blitz that always accompanies the SEG Annual Meeting. If you're looking forward to hearing all about it, you can make sure you don't miss a thing by getting our posts in your email inbox. Guaranteed no spam, only bacn. If you're reading this on the website, just use the box on the right →


Open geoscience goodness

I've been alerted to a few new things in the open geoscience category in the last few days:

  • Dave Hale released his cool-looking fault detection code
  • Wayne Mogg released some OpendTect plugins for AVO, filtering, and time-frequency decomposition
  • Joel Gehman and others at U of A and McGill have built WellWiki, a wiki... for wells!
  • Jon Claerbout, Stanford legend, has released his latest book with Sergey Formel, Austin legend: Geophysical Image Estimation by Example. As you'd expect, it's brilliant, and better still: the code is available. Amazing resource.

And there's one more resource I will mention, but it's not free as in speech, only free as in beerPetroacoustics: A Tool for Applied Seismics, by Patrick Rasolofosaon and Bernard Zinszner. So it's nice because you can read it, but not that useful because the terms of use are quite stringent. Hat tip to Chris Liner.

So what's the diff if things are truly open or not? Well, here's an example of the good things that happen with open science: near-real-time post-publication peer review and rapid research: How massive was Dreadnoughtus?

Technology and geoscience

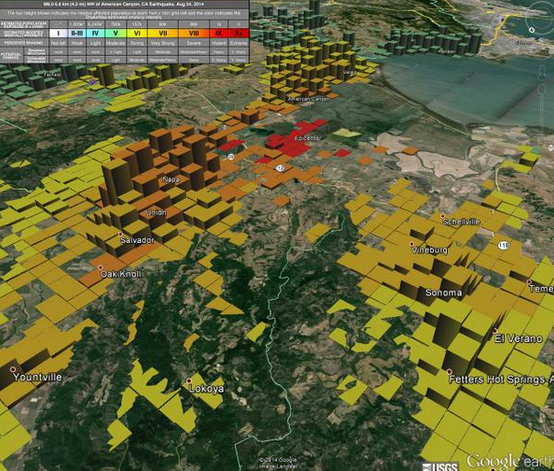
Napa earthquakeOpen data sharing has great potential in earthquake sensing, as there are many more people with smartphones than there are seismometers. The USGS shake map (right) is of course completely perceptual, but builds in real time. And Jawbone, makers of the UP activity tracker, were able to sense sleep interruption (in their proprietary data): the first passive human-digital sensors?

We love all things at the intersection of the web and computation... so Wolfram Alpha's new "Tweet a program" bot is pretty cool. I asked it:

GeoListPlot[GeoEntities[=[Atlantic Ocean], "Volcano"]]

And I got back a map!

This might be the coolest piece of image processing I've ever seen. Recovering sound from silent video images:

Actually, these time-frequency decompositions [PDF] of frack jobs are just as cool (Tary et al., 2014, Journal of Geophysical Research: Solid Earth 119 (2), 1295-1315). These deserve a post of their own some time.

It turns out we can recover signals from all sorts of unexpected places. There were hardly any seismic sensors around when Krakatoa exploded in 1883. But there were plenty of barometers, and those recorded the pressure wave as it circled the earth — four times! Here's an animation from the event.

It's hard to keep up with all the footage from volcanic eruptions lately. But this one has an acoustic angle: watch for the shockwave and the resulting spontaneous condensation in the air. Nonlinear waves are fascinating because the wave equation and other things we take for granted, like the superposition principle and the speed of sound, no longer apply.

Discussion and collaboration

Our community has a way to go before we ask questions and help each other as readily as, say, programmers do, but there's enough activity out there to give hope. My recent posts (one and two) about data (mis)management sparked a great discussion both here on the blog and on LinkedIn. There was also some epic discussion — well, an argument — about the Lusi post, as it transpired that the story was more complicated that I originally suggested (it always is!). Anyway, it's the first debate I've seen on the web about a sonic log. And there continues to be promising engagement on the Earth Science Stack Exchange. It needs more applied science questions, and really just more people. Maybe you have a question to ask...?

Géophysiciens avec des ordinateurs

Don't forget there's the hackathon next weekend! If you're in Denver, free come along and soak up the geeky rays. If you're around on the afternoon of Sunday 26 October, then drop by for the demos and prizes, and a local brew, at about 4 pm. It's all happening at Thrive, 1835 Blake Street, a few blocks north of the convention centre. We'll all be heading to the SEG Icebreaker right afterwards. It's free, and the doors will be open.

July linkfest

It's linkfest time again. All the links, in one handy post.

First up — I've seen some remarkable scientific visualizations recently. For example, giant ocean vortices spiralling across the globe (shame about the rainbow colourbar though). Or the trillion-particle Dark Sky Simulation images we saw at SciPy. Or this wonderful (real, not simulated) video by the Perron Group at MIT:

Staying with visuals, I highly recommend reading anything by Mike Bostock, especially if you're into web technology. The inventor of D3.js, a popular data viz library, here's his exploration of algorithms, from sampling to sorting. It's more conceptual than straight up visualization of data, but no less insightful. 

And I recently read about some visual goodness combined with one of my favourite subjects, openness. Peter Falkingham, a palaeontologist at the Royal Vetinary College and Brown University, has made a collection of 3D photographs of modern tracks and traces available to the world. He knows his data is more impactful when others can use it too.

Derald Smith and sedimentology

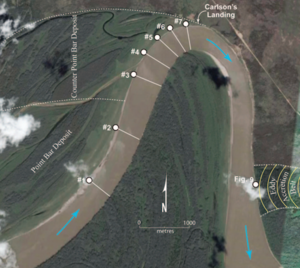
From Smith et al. (2009) in SEPM Special Publication No. 97.The geological world was darkened by the death of Derald Smith on 18 June. I met Derald a few times in connection with working on the McMurray Formation of Alberta, Canada during my time at ConocoPhillips. We spent an afternoon examining core and seismic data, and speculating about counter-point-bars, a specialty of his. He was an intuitive sedimentologist whose contributions will be remembered for many years.

Another geological Smith is being celebrated in September at the Geological Society of London's annual William Smith Meeting. The topic this year is The Future of Sequence Stratigraphy: Evolution or Revolution? Honestly, my first thought was "hasn't that conversation been going on since 1994?", but on closer inspection, it promises to be an interesting two days on 'source-to-sink', 'landscape into rock', and some other recent ideas.

The issue of patents reared up in June when Elon Musk of Tesla Motors announced the relaxation of their patents — essentially a promise not to sue anyone using one of their patented technology. He realizes that a world where lots of companies make electric vehicles is better for Tesla. I wrote a piece about patents in our industry.

Technology roundup

A few things that caught our eye online:

Last thing: did you know that the unit of acoustic impedance is the Rayl? Me neither. 


Previous linkfests: AprilJanuaryOctober.

The figure is from Smith et al. (2009), Stratigraphy of counter-point-bar and eddy accretion deposits in low-energy meander belts of the Peace–Athabasca delta, northeast Alberta, Canada. In: SEPM Special Publication No. 97, ISBN 978-1-56576-305-0, p. 143–152. It is copyright of SEPM, and used here in accordance with their terms.

April linkfest

It's time for our regular linkfest!

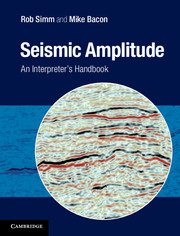
There's a new book in town... Rob Simm and Mike Bacon have put together a great-looking text on seismic amplitude intepretation (Cambridge, 2014). Mine hasn't arrived yet, so I can't say much more — for now, you can preview it in Google Books. I should add it to my list.

Staying with new literature, I started editing a new column in SEG's magazine The Leading Edge in February. I wrote about the first instalment, and now the second is out, courtesy of Leo Uieda — check out his tutorial on Euler deconvolution, complete with code. Next up is Evan with a look at synthetics.

On a related note, Matteo Niccoli just put up a great blog post on his awesome perceptual colourmaps, showing how to port them to matplotlib, the MATLAB-like plotting environment lots of people use with the Python programming language. 

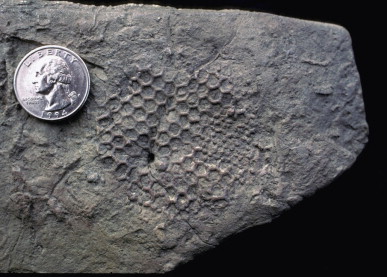
Dolf Seilacher, the German ichnologist and palaeontologist, died 4 days ago at the age of 89. For me at least, his name is associated with the mysterious trace fossil Palaeodictyon — easily one of the weirdest things on earth (right). 

Geoscience mysteries just got a little easier to solve. As I mentioned the other day, there's a new place on the Internet for geoscientists to ask questions and help each other out. Stack Exchange, the epic Q&A site, has a new Earth Science site — check out this tricky question about hydrocarbon generation.

And finally, who would have thought that waiting 13 years for a drop of bitumen could be an anticlimax? But in the end, the long (if not eagerly) awaited 9th drop in the University of Queensland's epic experiment just didn't have far enough to fall...

If you can't get enough of this, you can wait for the 10th drop here. Or check back here in 2027.

October linkfest

From Hart (2013). ©SEG/AAPGIt's the Hallowe'en linkfest! Just the good bits from our radar...

If you're a member of SEG or AAPG, you can't have missed their new joint-venture journal, Interpretation. Issue 2 just came out. My favourite article so far has been Bruce Hart's Whither seismic stratigraphy in Issue 1. It included these excellent little forward models from an earlier paper of his — it's so important for interpreter's to think in this space where geological architecture and geophysical imaging overlap. 

Muon tomography is in the news again, this time in relation to monitoring CCS repositories (last time it was volcanos). Jon Gluyas, author of the textbook Petroleum Geoscience, is the investgator at Durham in the UK (my alma mater). I do love the concept — imaging the subsurface with cosmic rays — but I'm only just getting to grips with sound waves.

If you read this blog regularly, you probably have some geeky tendencies. We've linked to a couple of these blogs before, but they're must-read for anyone into technology and geoscience, with lots of code and workflow examples: 

Continuing the geeky theme, we've been getting more and more into building things recently. Check out our fiddling in GitHub (a code repository) — an easy way in is code.agilegeoscience.com. Watch this space!

Speaking of fiddling with code, you already know about the hackathon we hosted in Houston last month. But there's talk of repeating the fun at the AAPG Annual Convention, also in Houston, in April next year. Brian Romans has started a list of potential projects around digital stratigraphy — please leave a comment there or here to add to it. Where's the gap in your workflow?

A few more quick hits:

If you want these nuggets fresh, you can follow me on Twitter or glance at my pinboard. If you have stuff to share, use the comments or get in touch. Over and out.

Seismic models: Hart, BS (2013). Whither seismic stratigraphy? Interpretation, volume 1 (1), and is copyright of SEG and AAPG. The image from the Trowel Blazers event is licensed CC-BY-SA by Wikipedia user Mrjohncummings

May linkfest

The monthly News post wasn't one of our most popular features, so it's on the shelf. Instead, I thought I'd share all the most interesting, quirky, mind-blowing, or just plain cool things I've spotted on the web over the last month.

– Do not miss this. One of them stands out above all the others. If you like modern analogs and satellite imagery, you're going to love Google Earth Engine. I've started a list of geologically interesting places to visit — please add to it!

– More amazing images. I'll never get bored of looking at gigapans, and Callan Bentley's are among the best geological ones. I especially like his annotated ones.

– Classic blog. Greg Gbur writes one of the best physics blogs, and his focus is on optics, so there's often good stuff there for geophysicists. This post on Chladni patterns is pure acoustic goodness and well worth a slow read. 

– New geoscience blog. Darren Wilkinson is a young geoscientist in the UK, and writes a nice geeky blog about his research. 

– Brilliant and simple. Rowan Cockett is a student at UBC, but builds brilliant geological web apps on the side. He has a knack for simplicity and his latest creation makes stereonets seem, well, simple. Impressive. 

– New magazine. Kind of. There's not enough satire or ragging in the petroleum press, so it's refreshing to hear of Proved Plus Probable, a fairly wacky weekly online rag emanating from Calgary [thanks to Dan for the tip!]. Top headline: Legendary geologist invents new crayons

– Counter-factual geology. I love these pictures of an imagined ring around earth.

– Never buy graph paper again. Make some just how you like it!

– Bacon. It was a revelation to find that some rocks look just like bacon.

That's it! I share most of this sort of thing on Twitter. Really useful stuff I tend to stick on my pinboard — you're welcome to browse. If you have a geological or geeky bookmark collection, feel free to share it in the comments!