
Results from the AAPG Machine Learning Unsession
/Click here to visit the Google Doc write-up
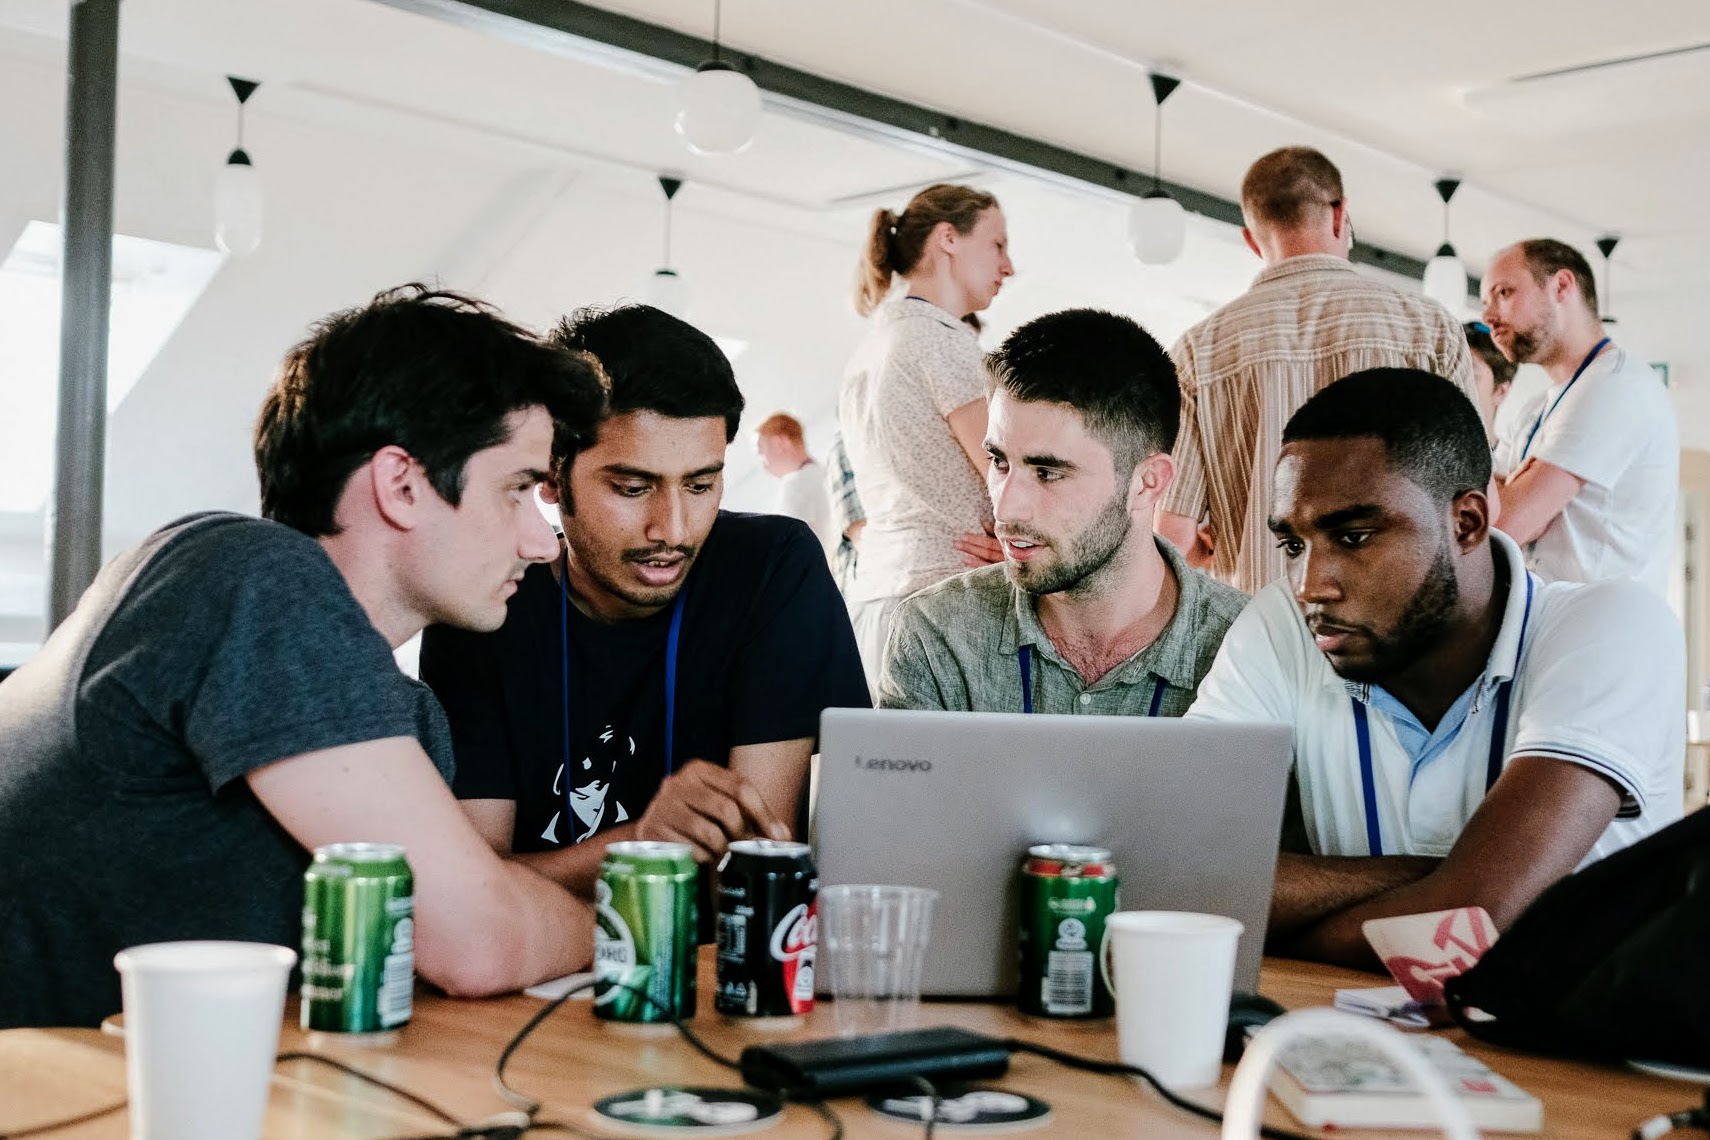
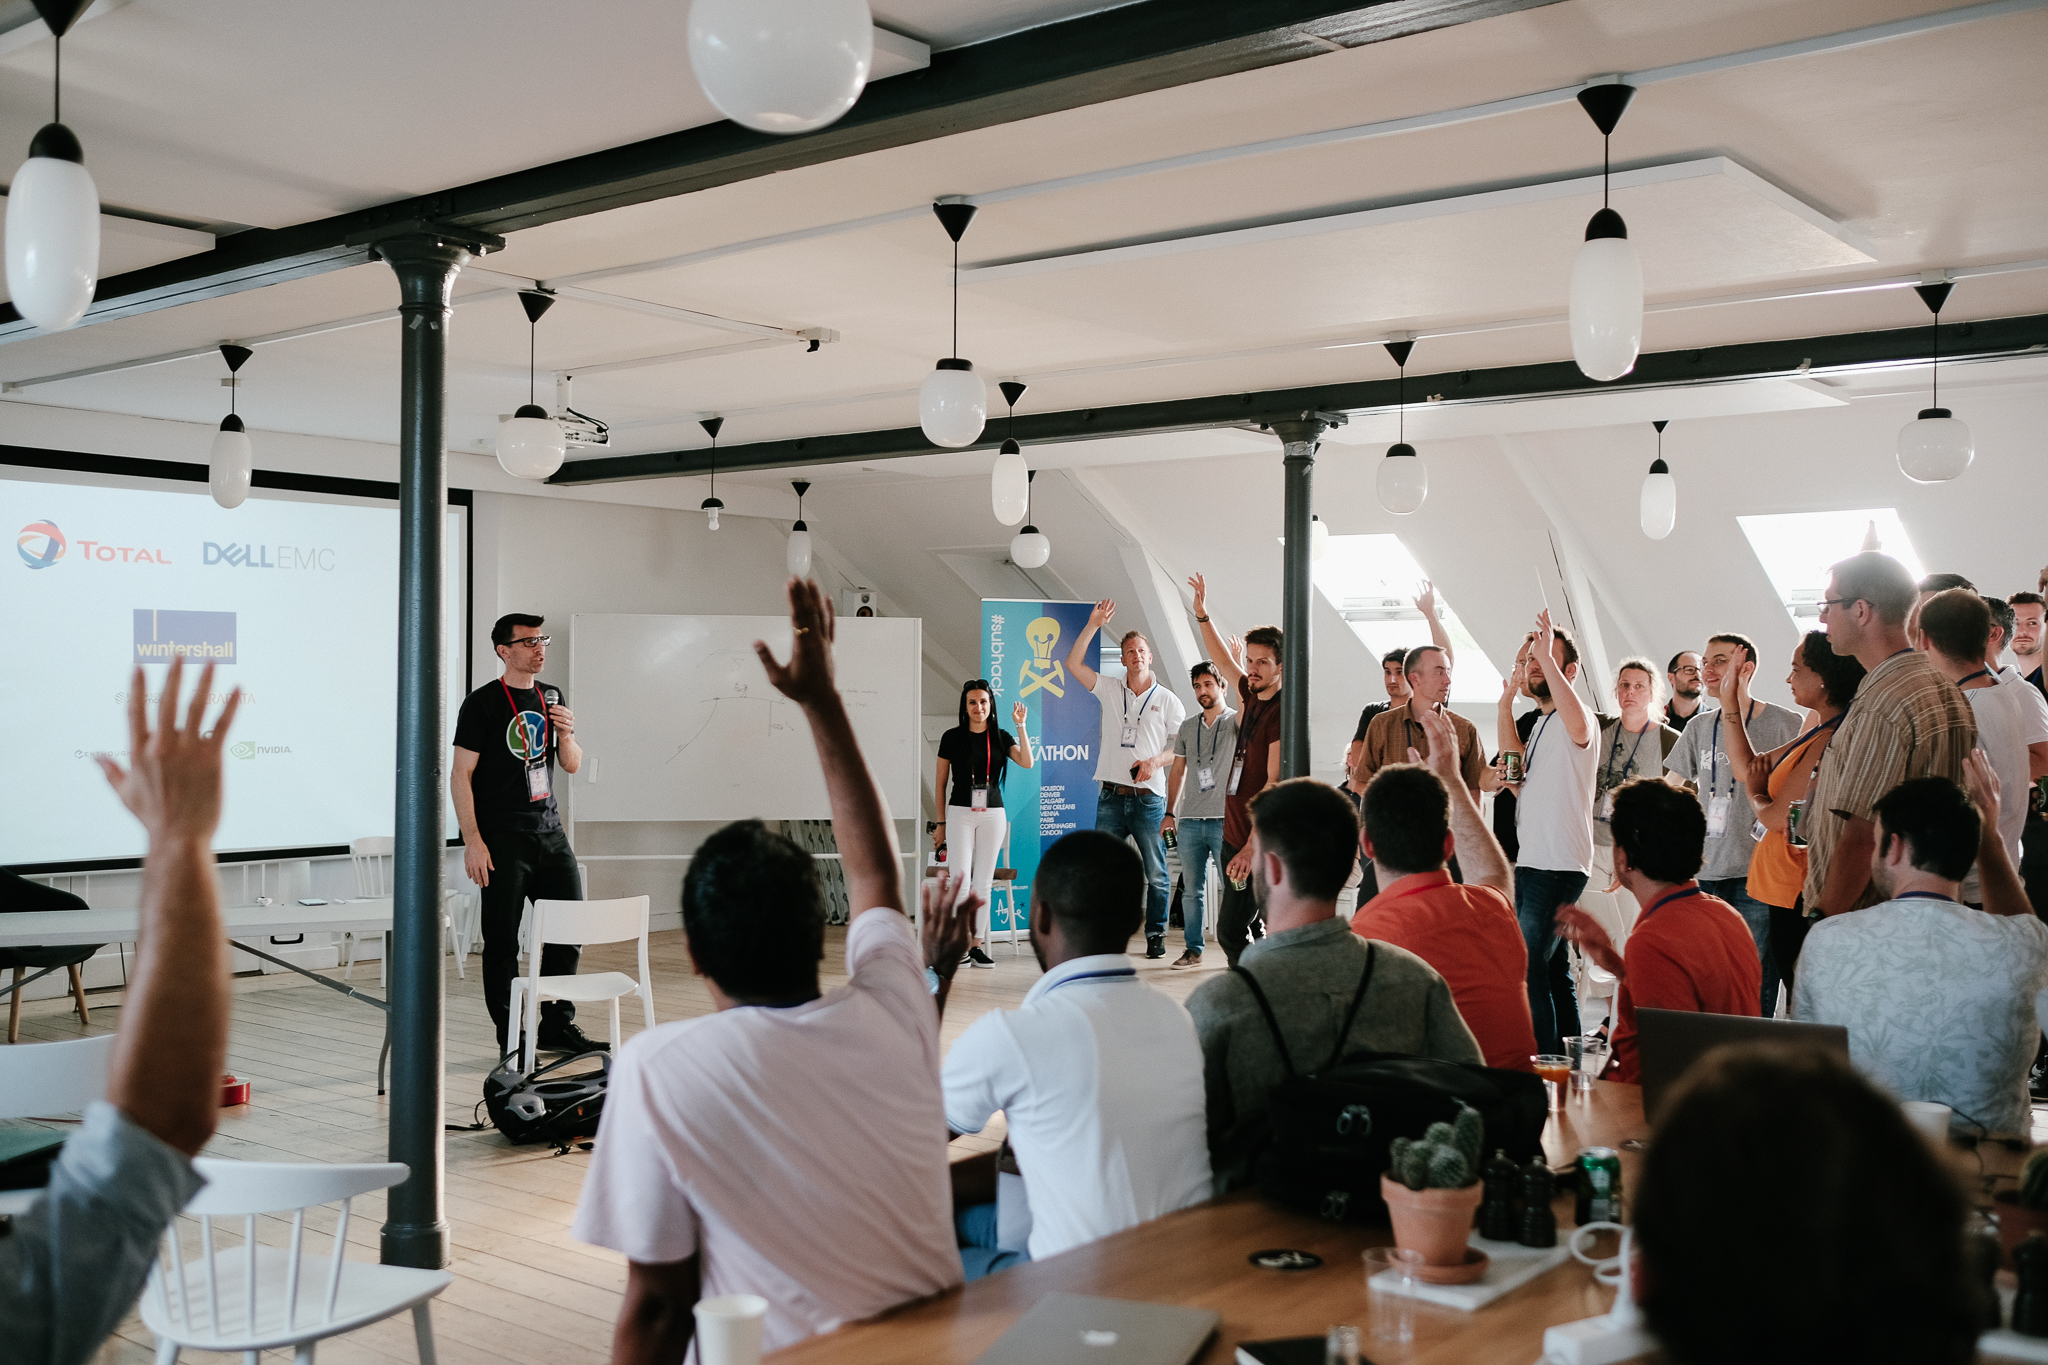
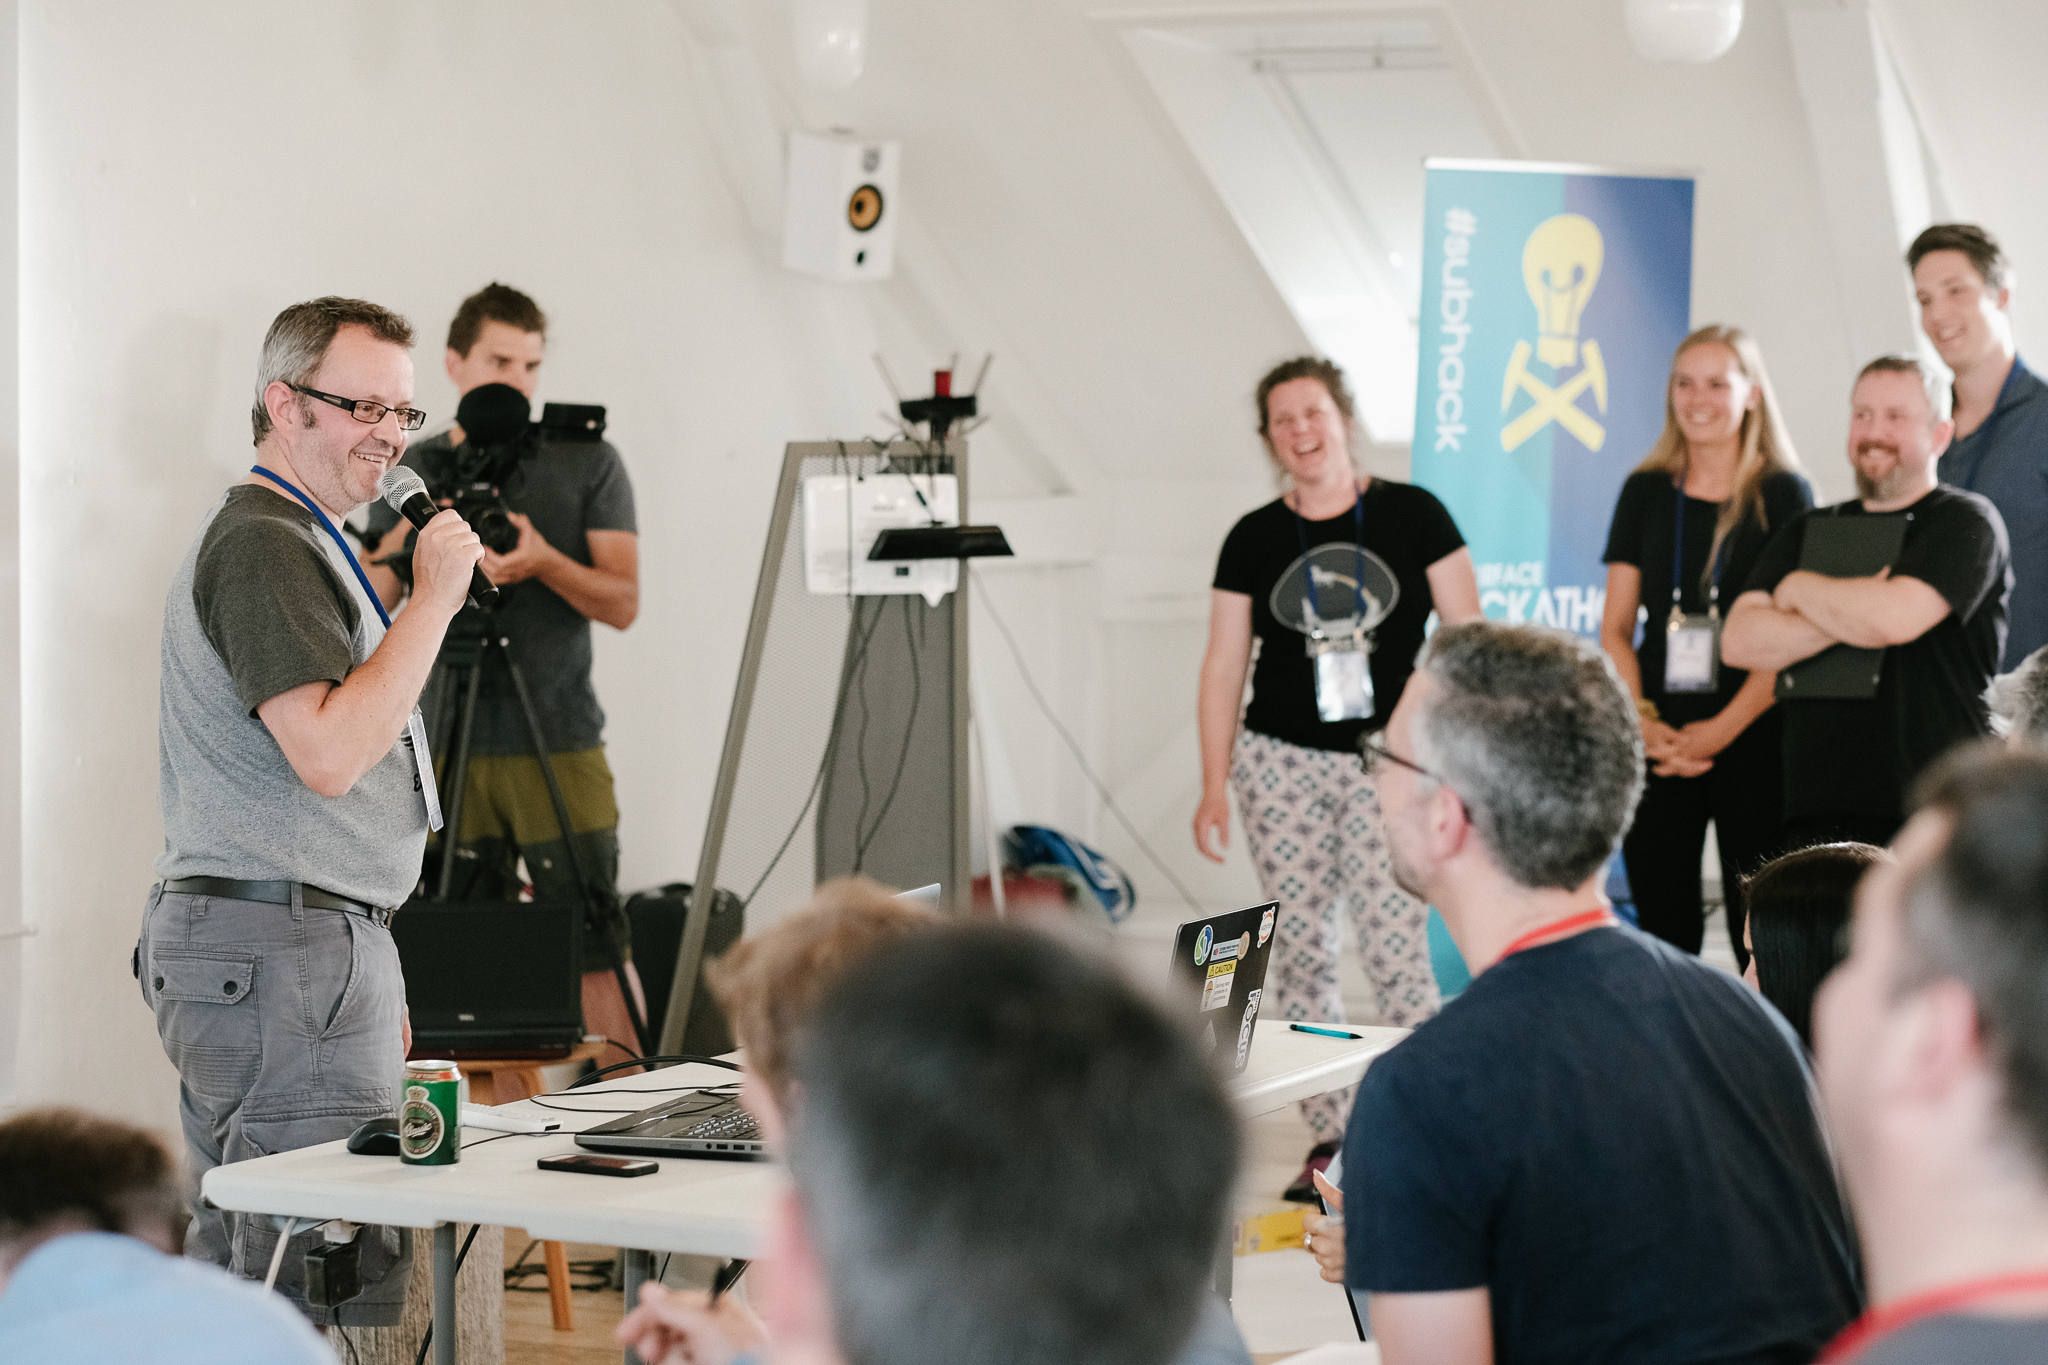
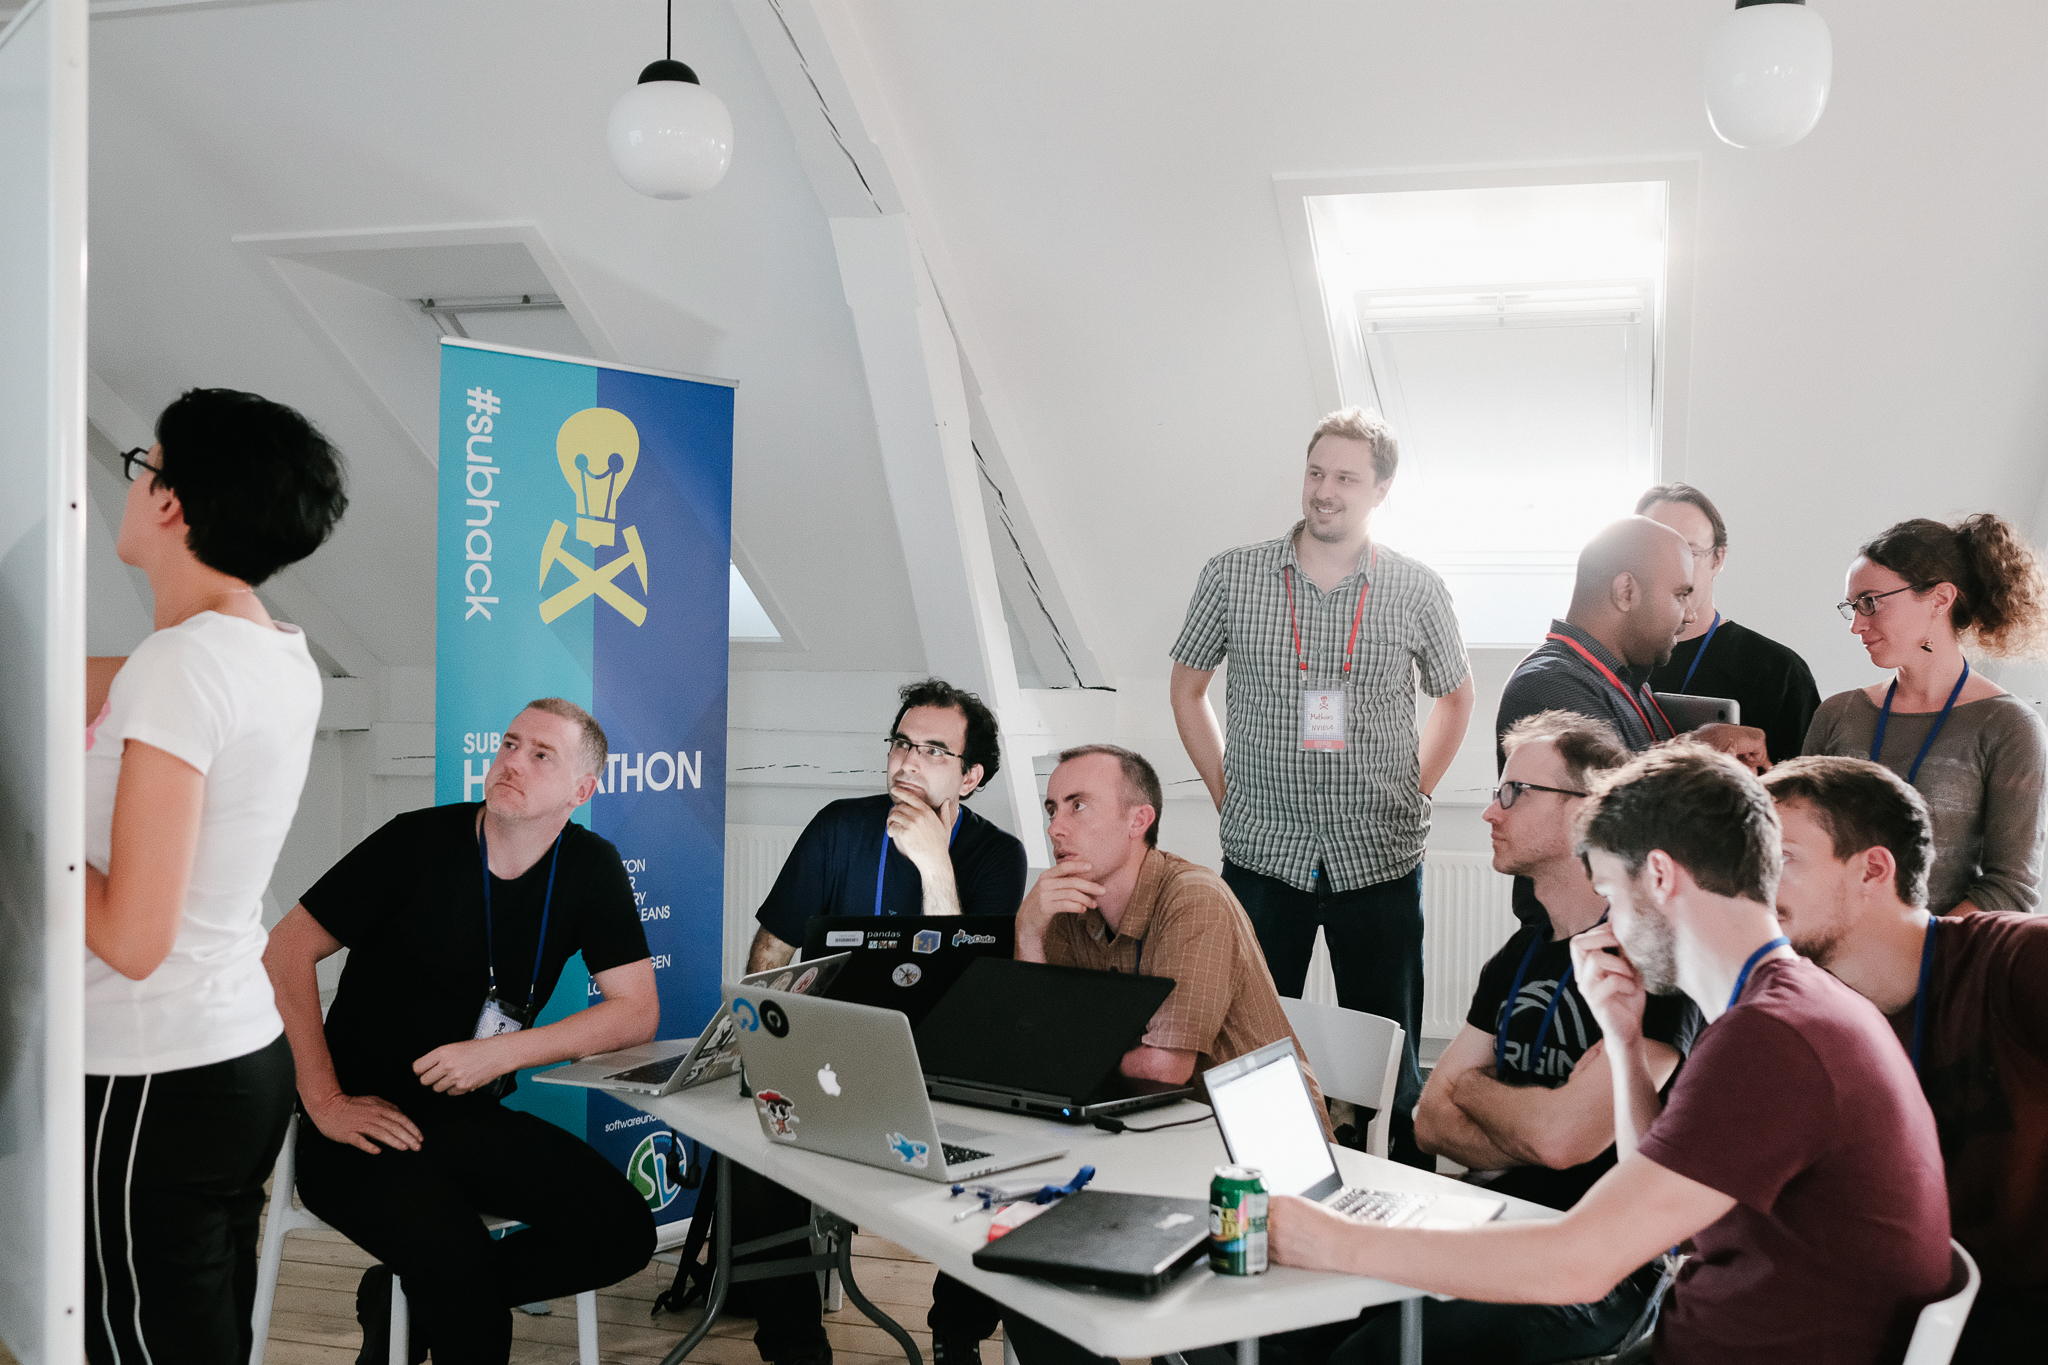
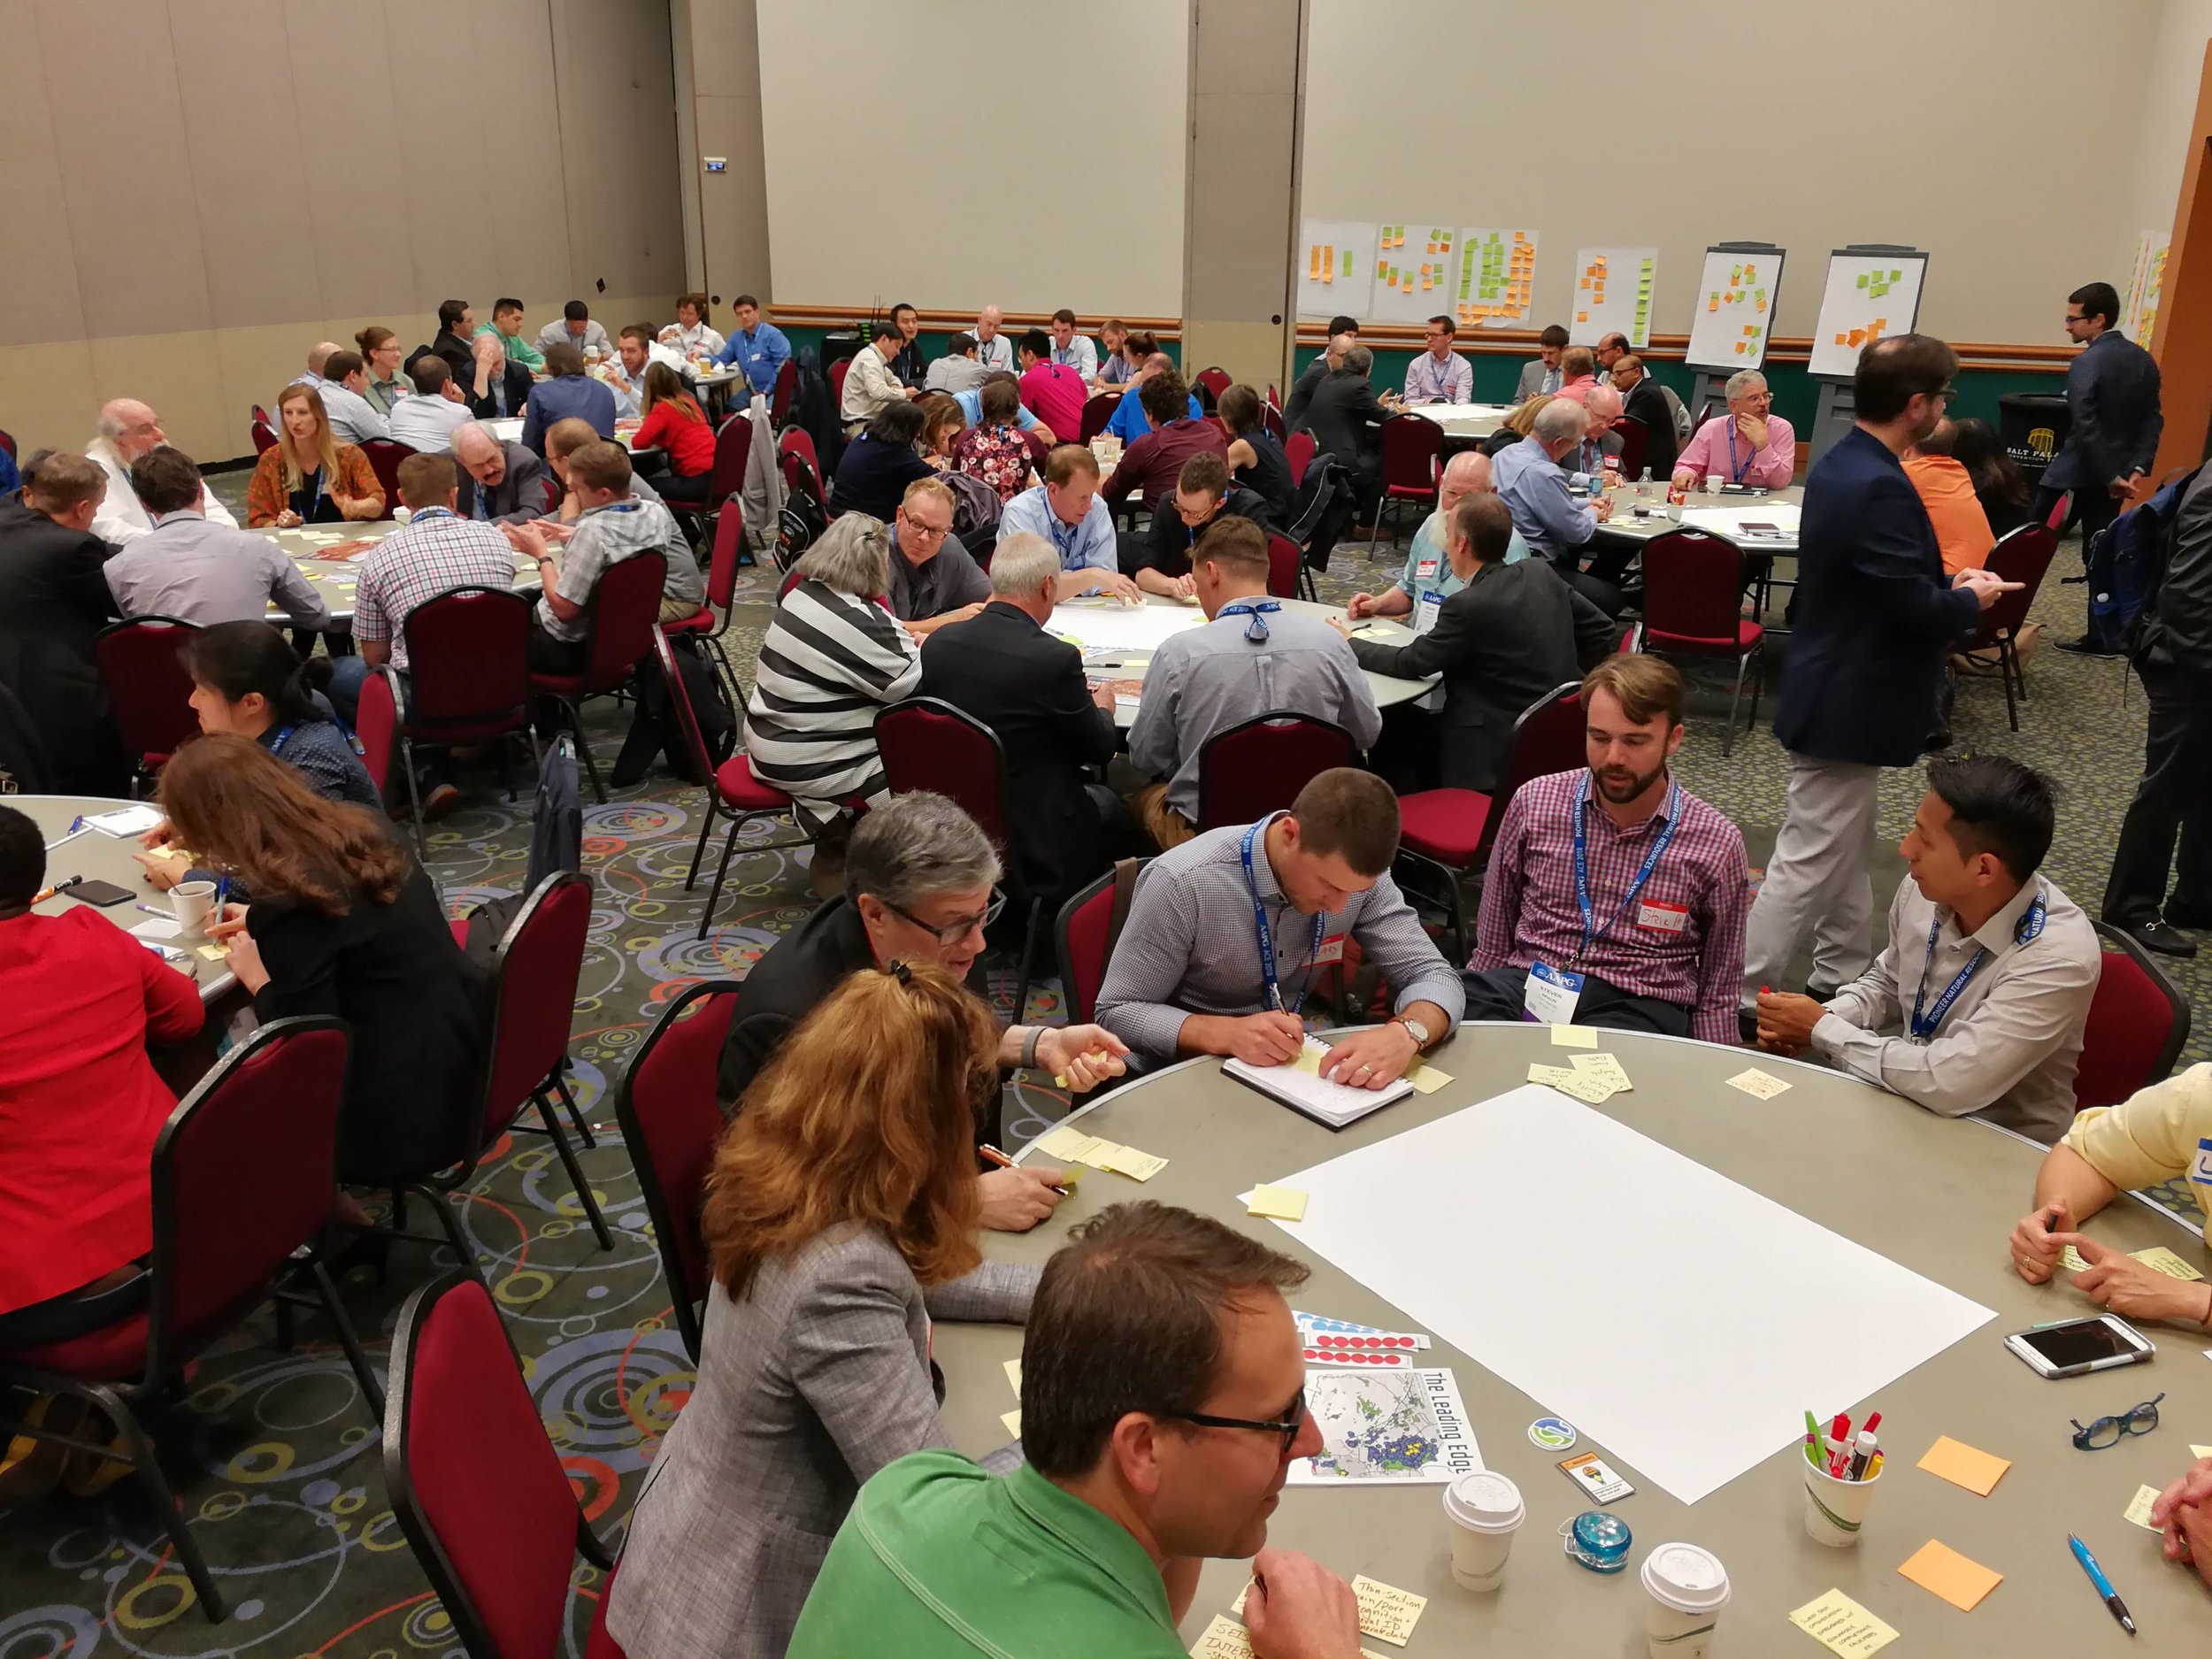
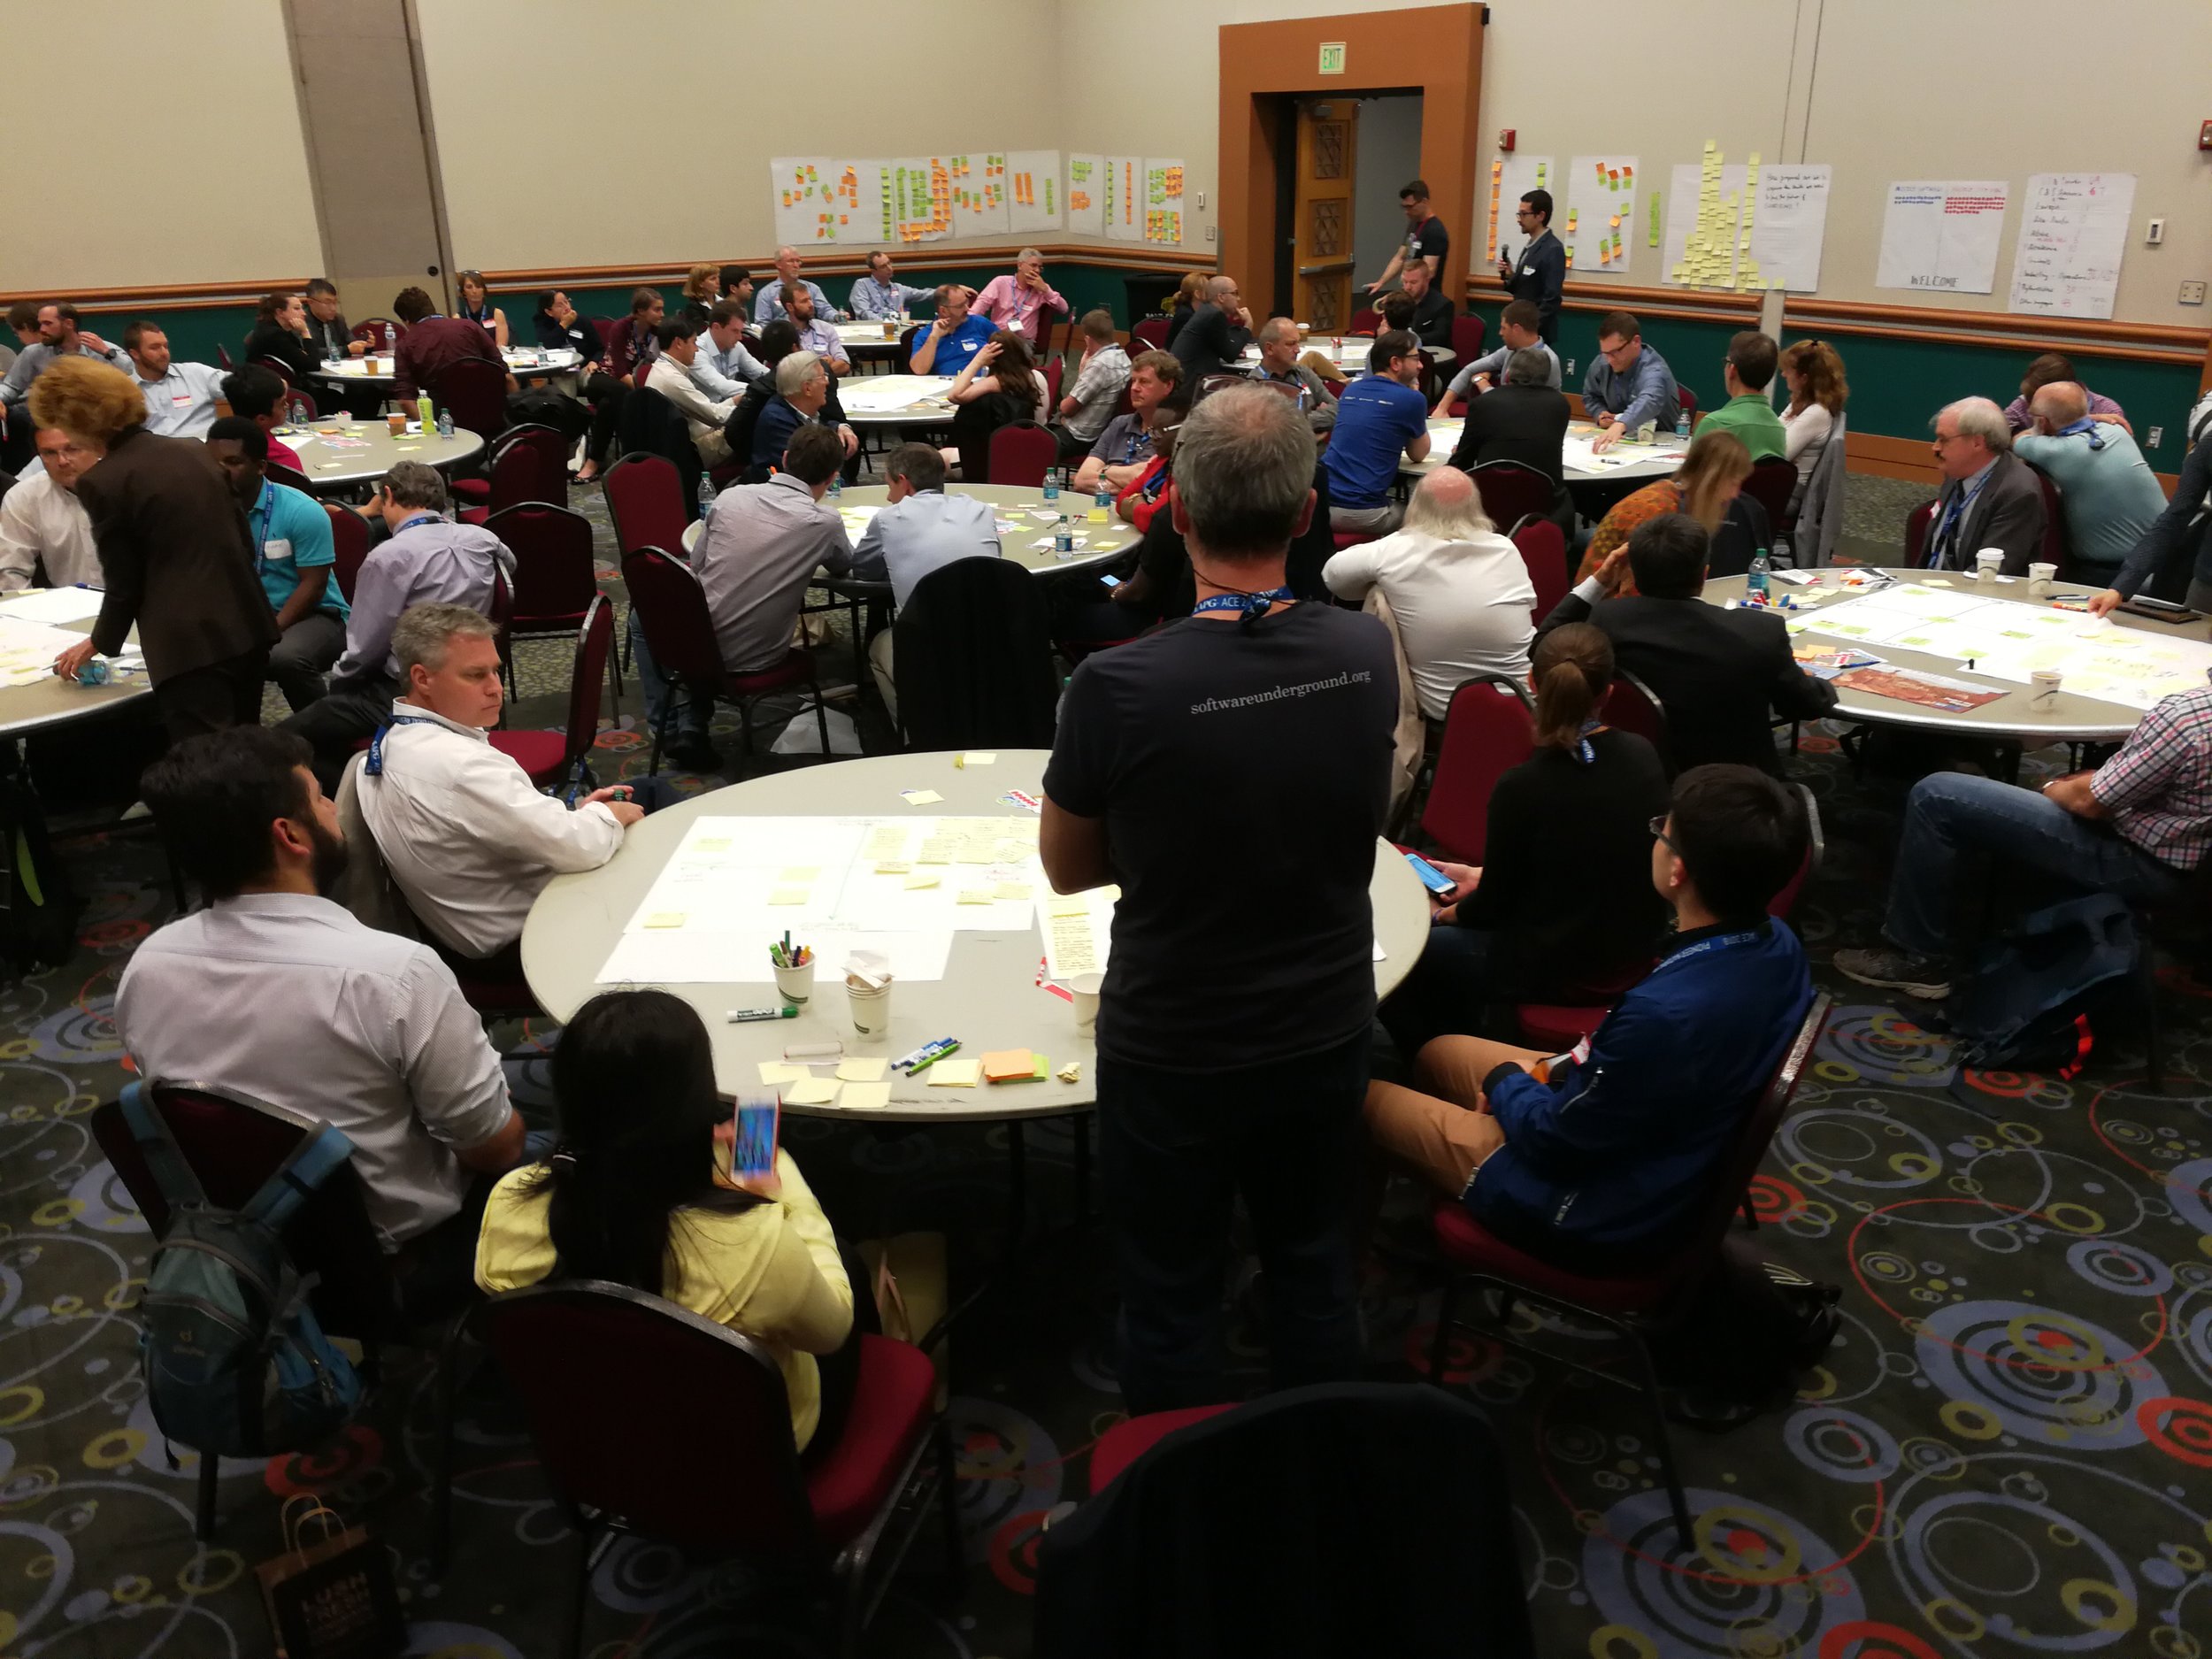
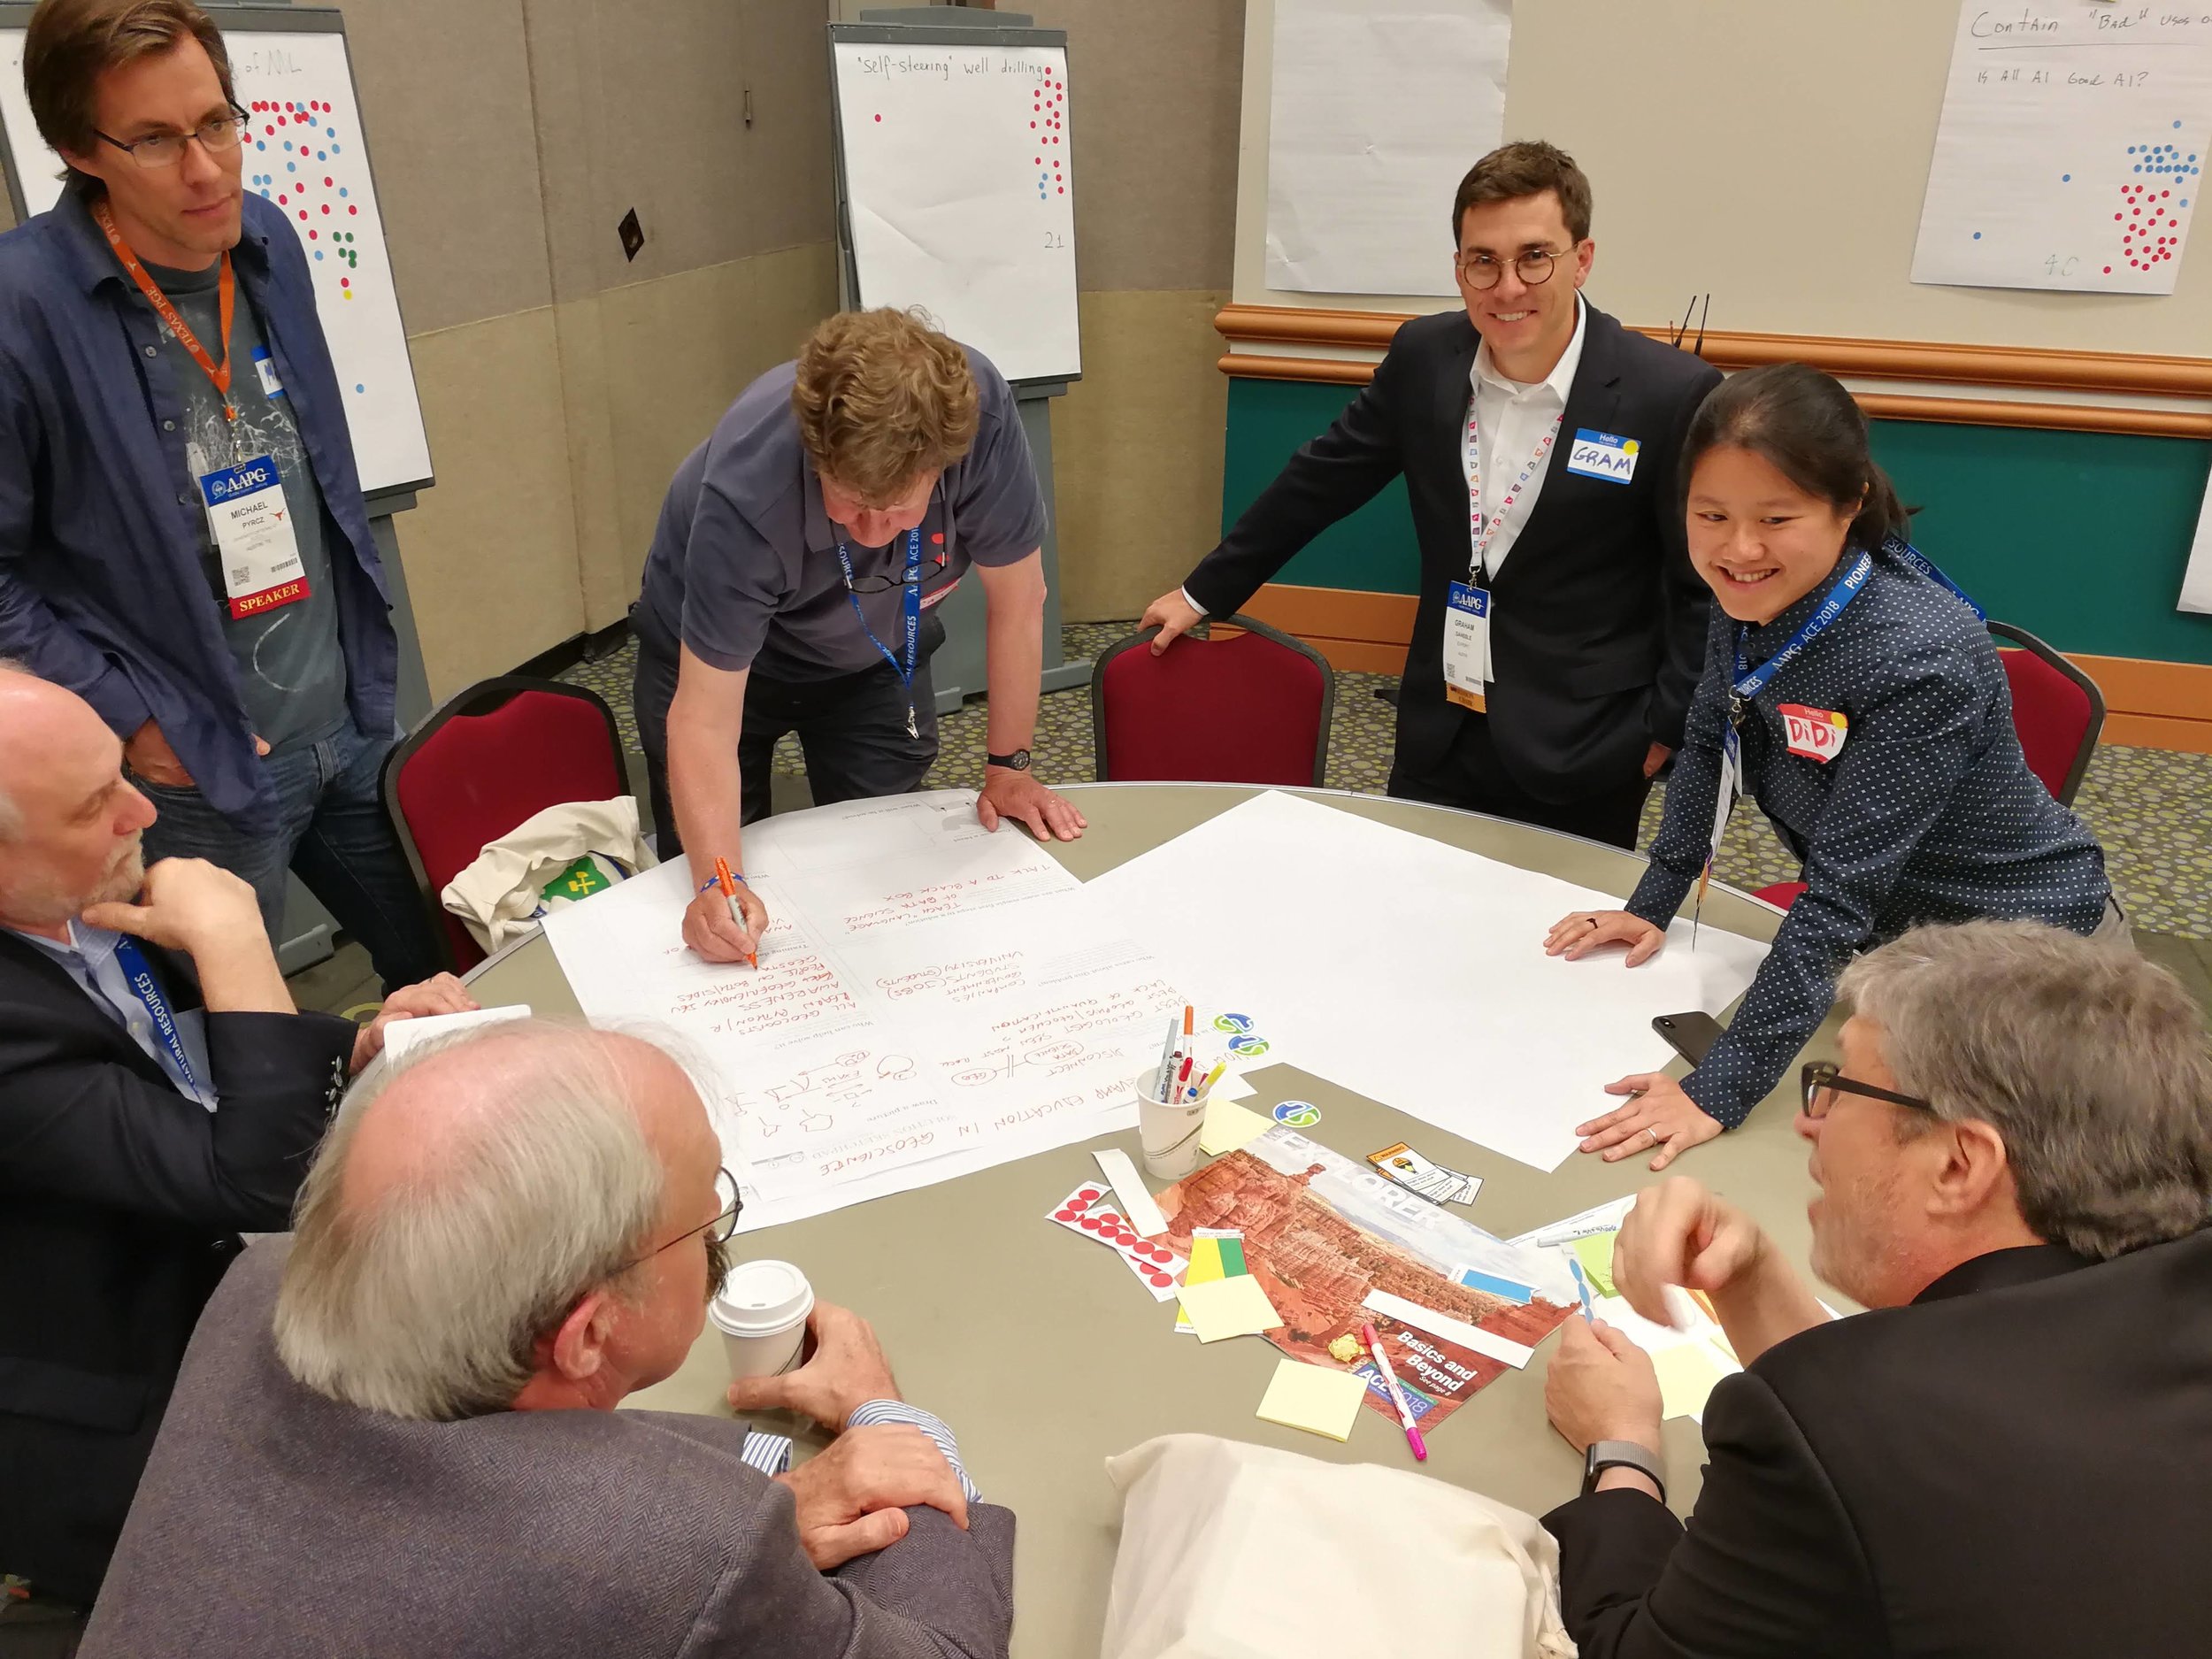
Back in May, I co-hosted a different kind of conference session — an 'unsession' — at the AAPG Annual Conference and Exhibition in Salt Lake City, Utah. It was successful in achieving its main goal, which was to show the geoscience community and AAPG organizers a new way of collaborating, networking, and producing tangible outcomes from conference sessions.
It also succeeded in drawing out hundreds of ideas and questions around machine learning in geoscience. We have now combed over what the 120 people (roughly) produced on that afternoon, written it up in a Google Doc (right), and present some highlights right here in this post.
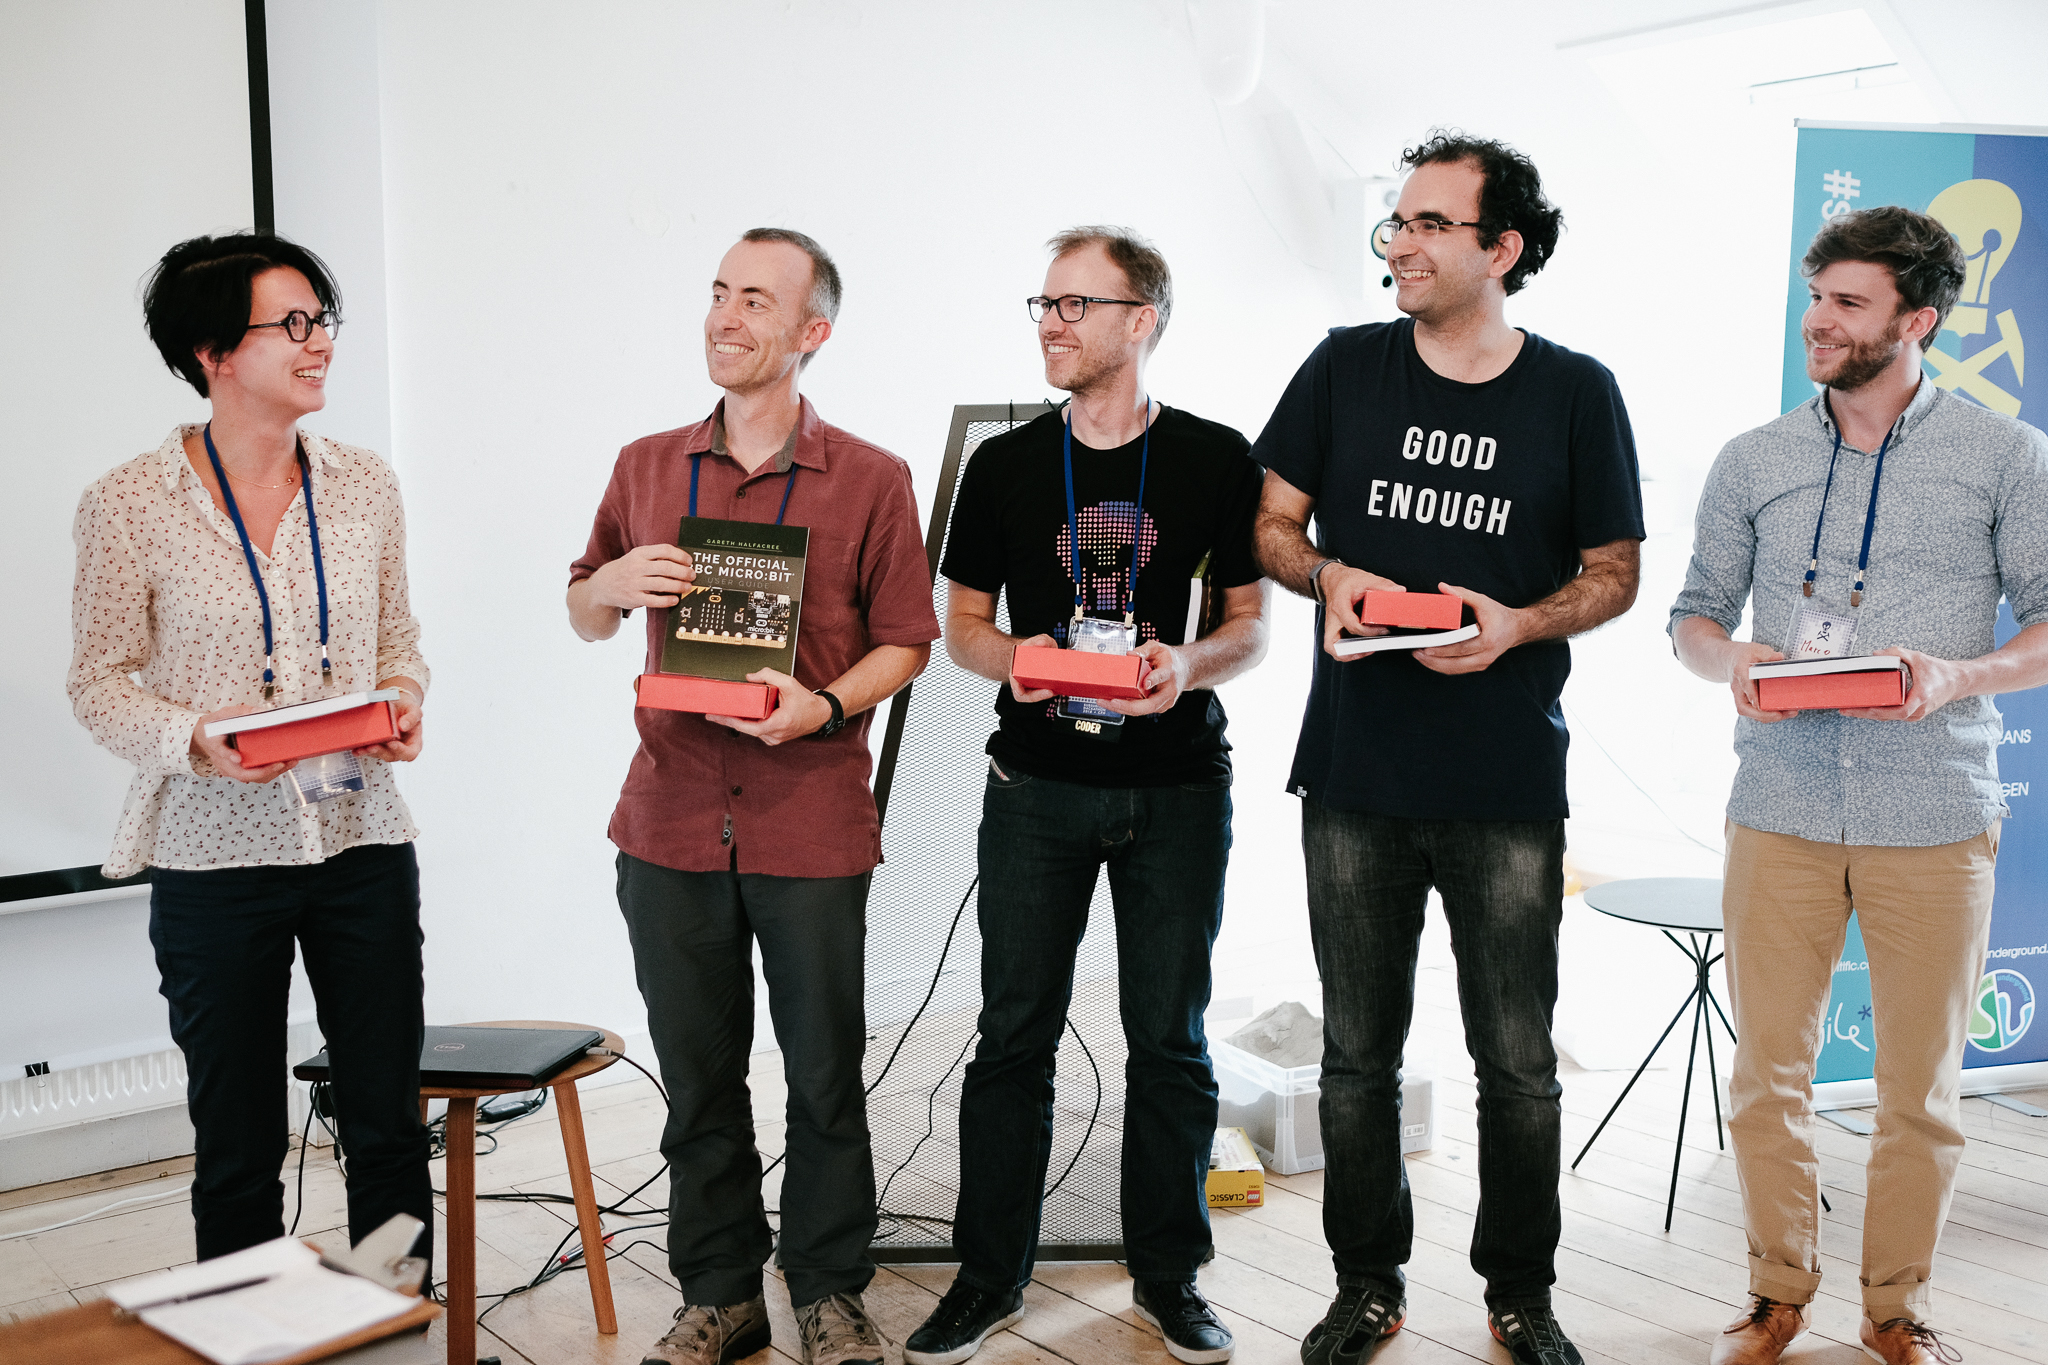
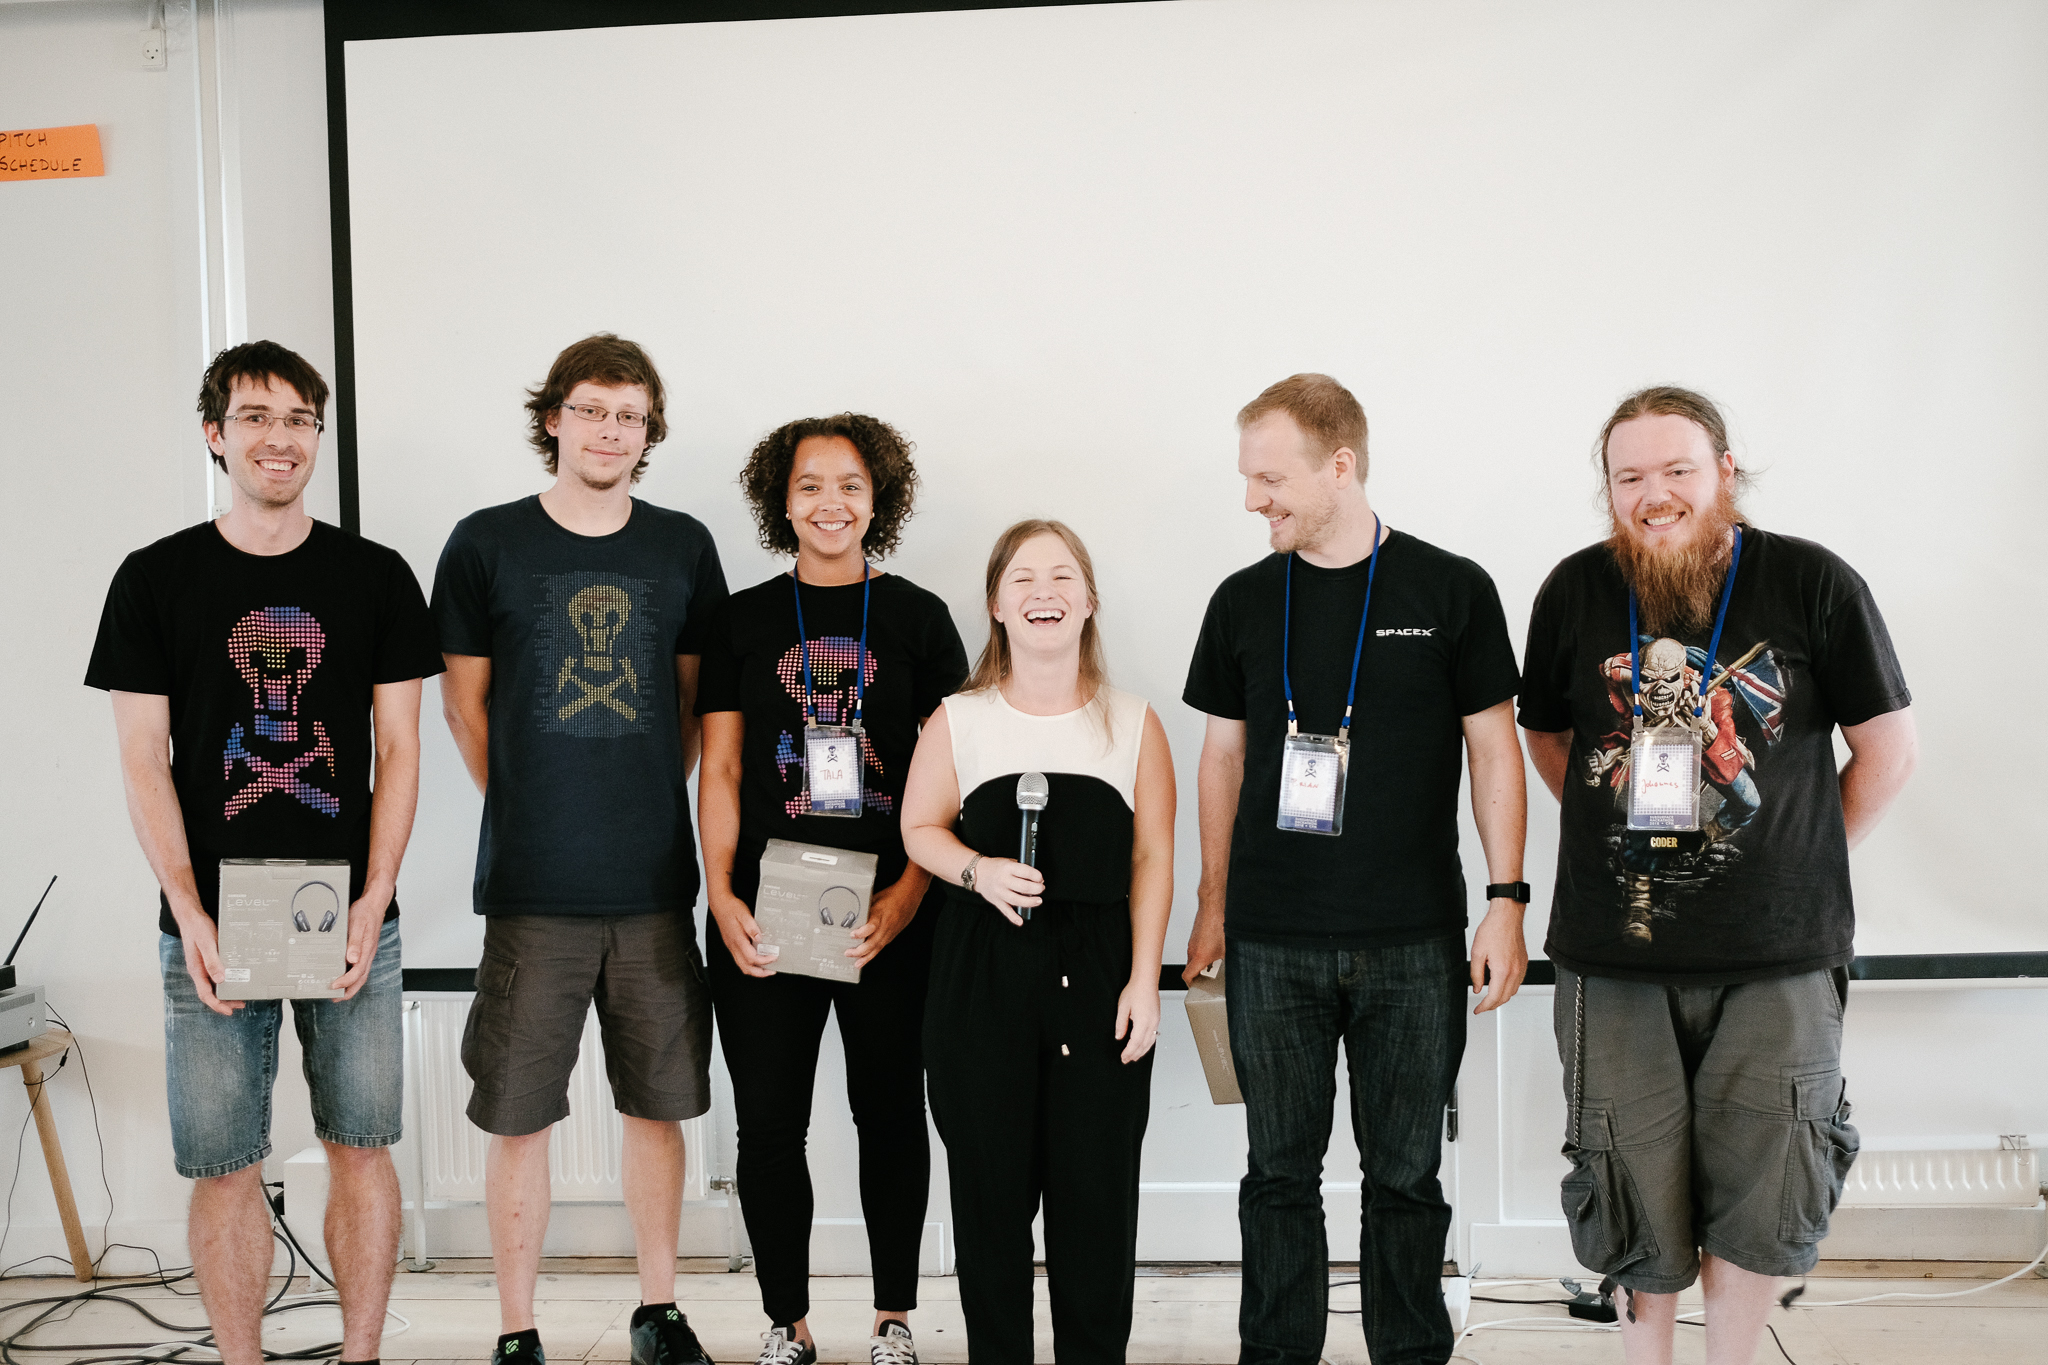
Click here to visit the Flickr photo album.
The unsession had three phases:
Exploring current and future skills for geoscientists.
Asking about the big questions in machine learning in geoscience.
Digging into some of those questions.
Let's look at each one in turn.

Current and future skills
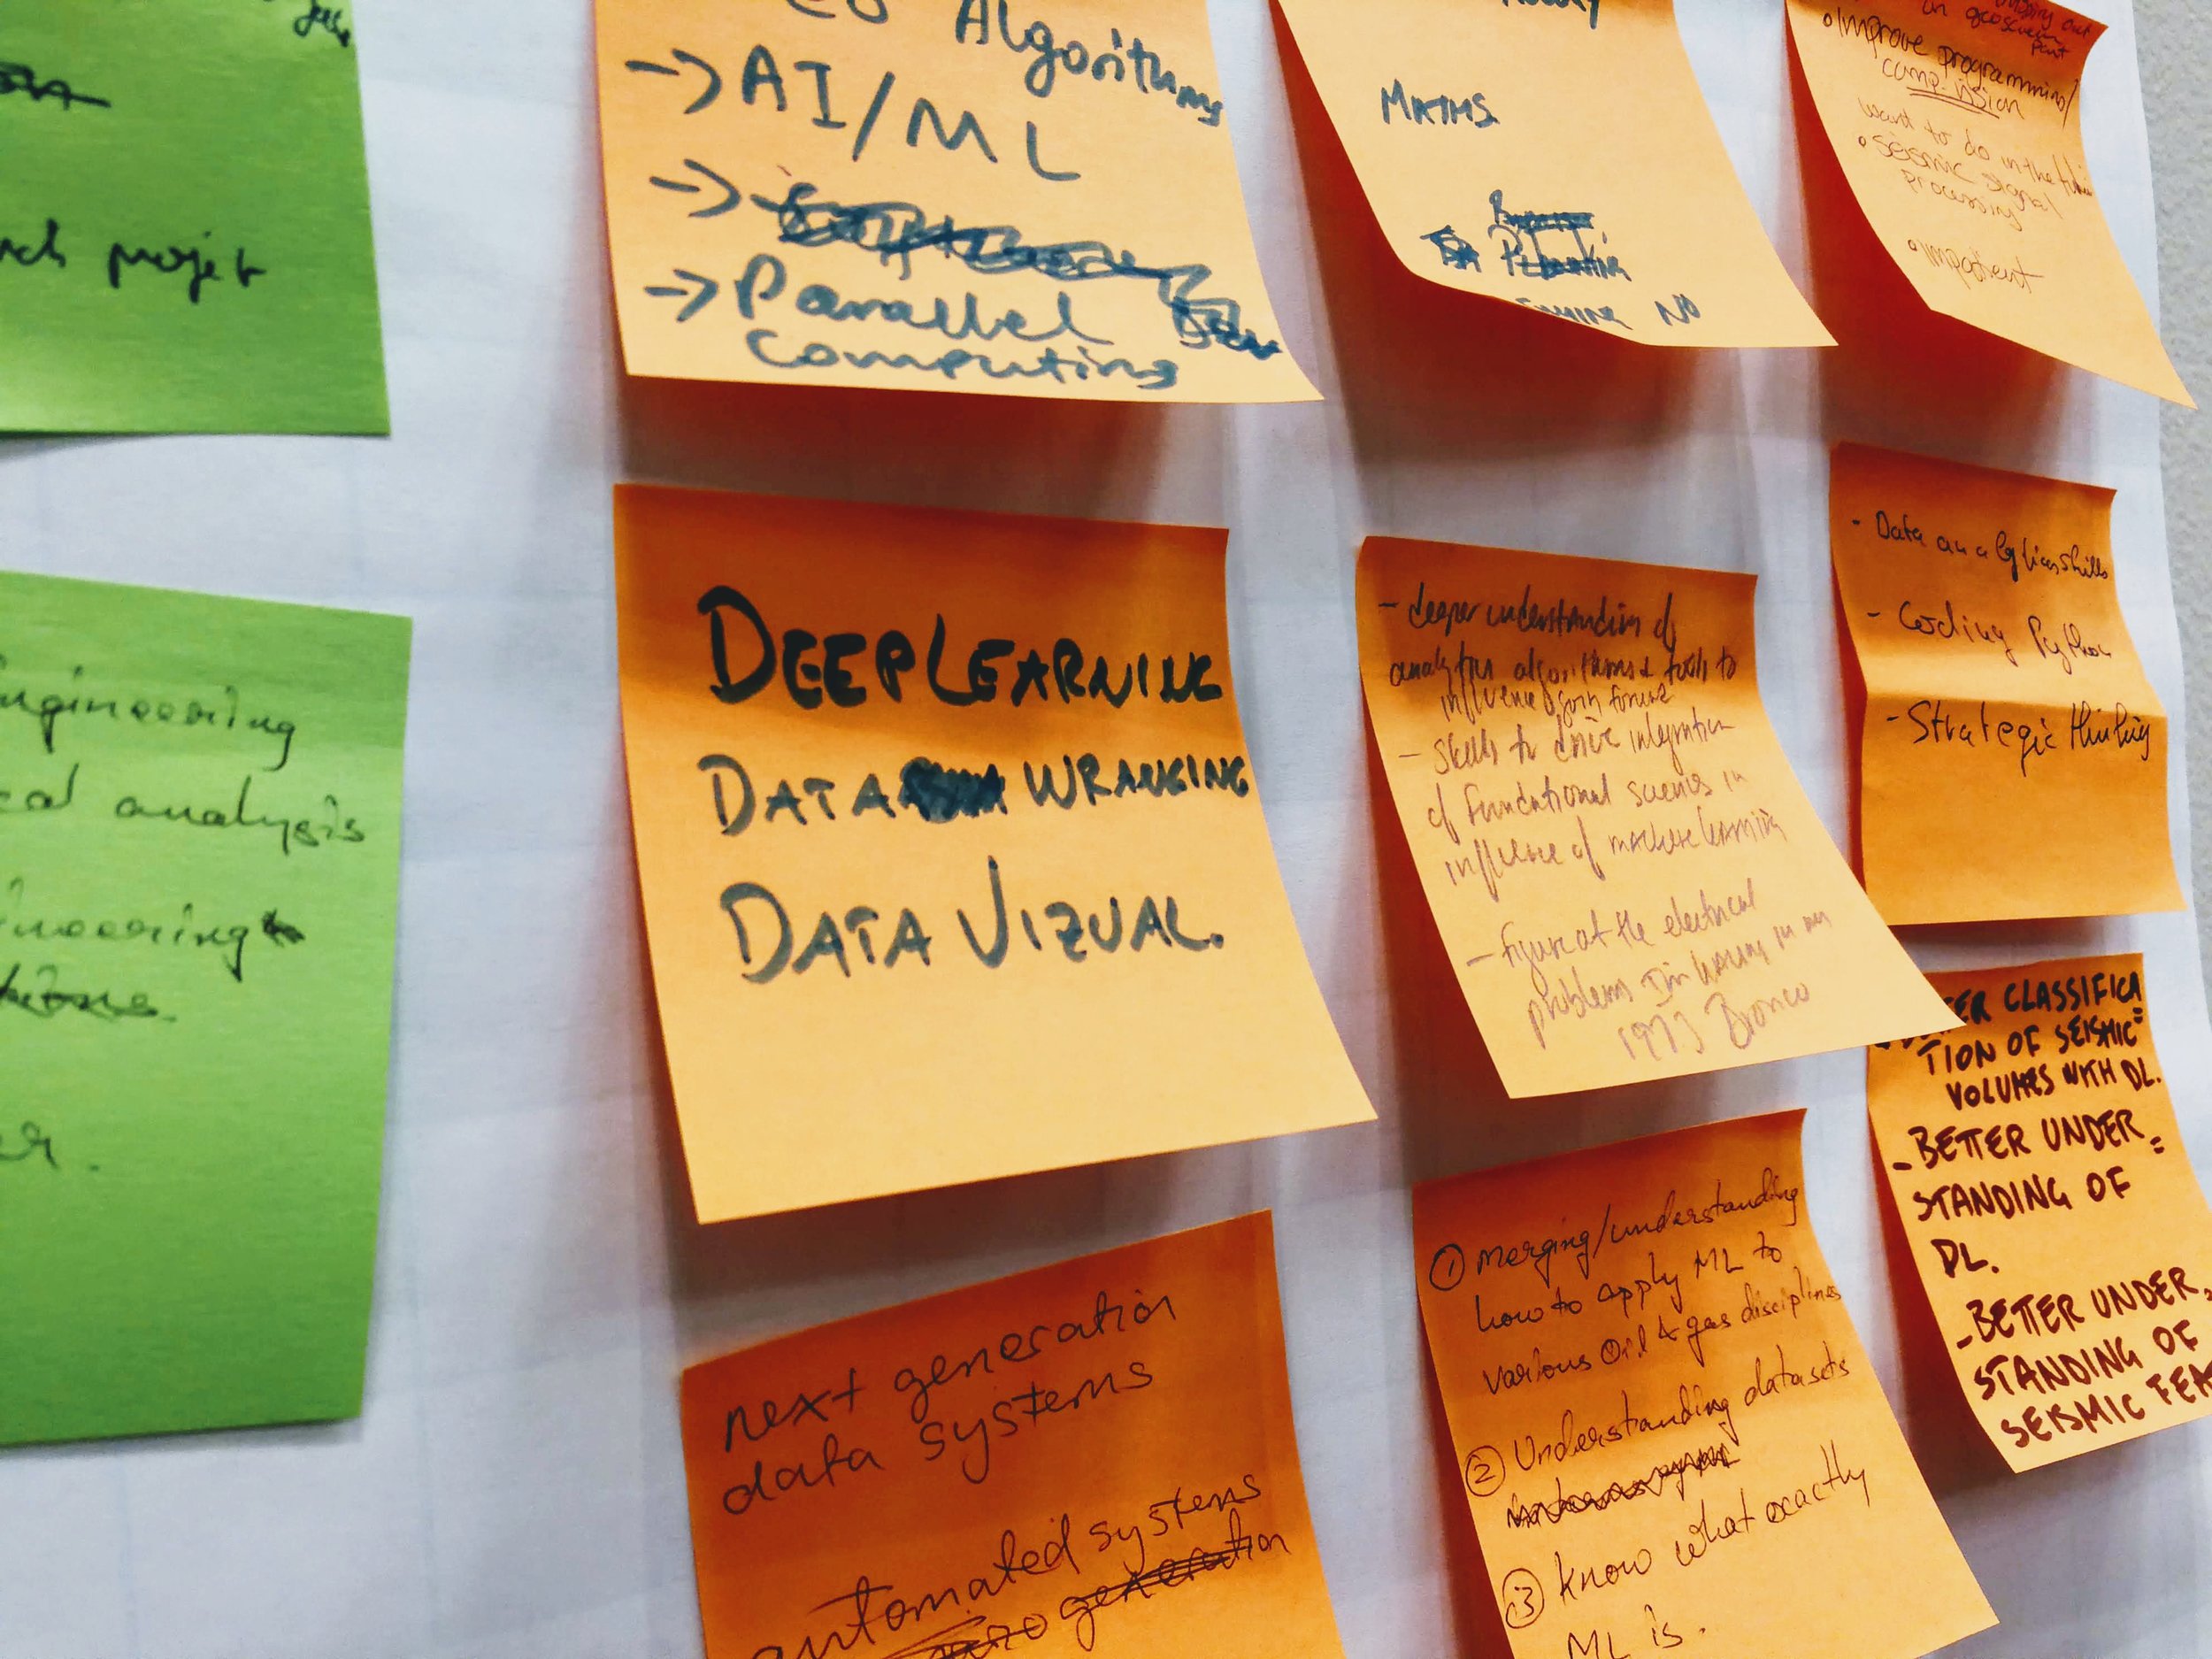
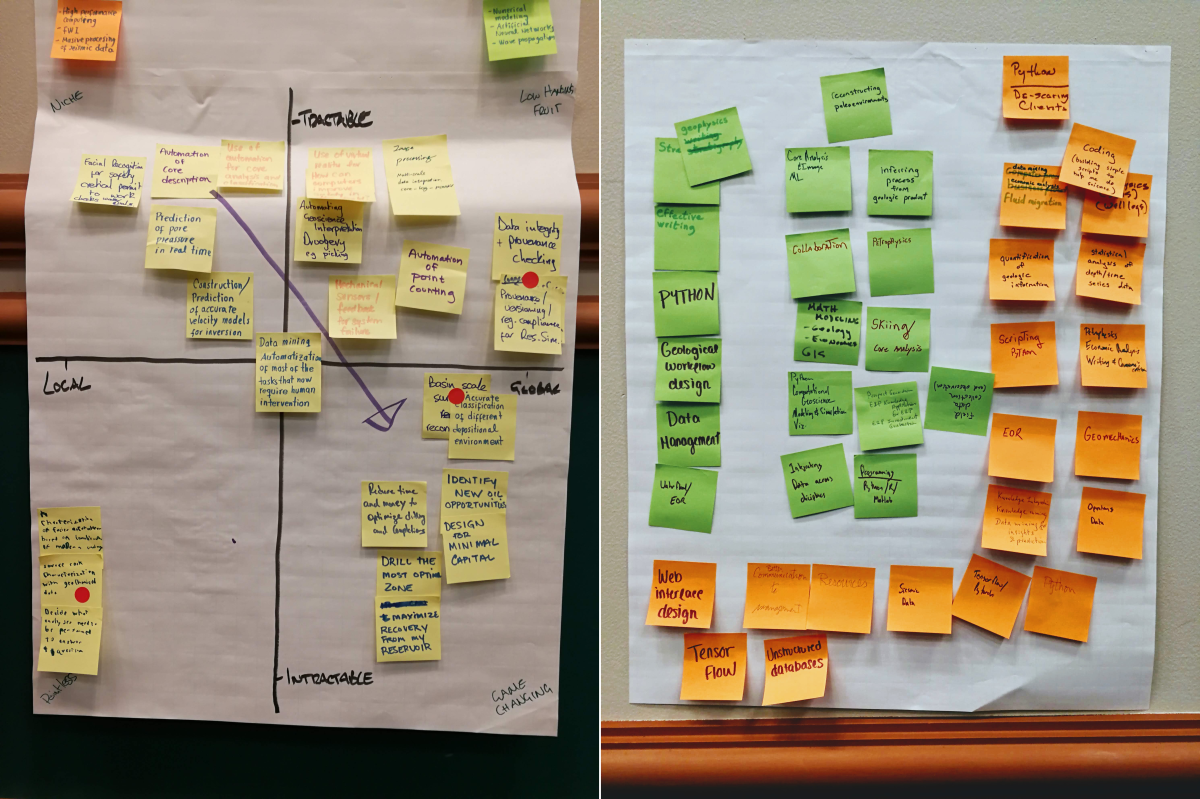
As an icebreaker, we asked everyone to list three skills they have that set them apart from others in their teams or organizations — their superpowers, if you will. They wrote these on green Post-It notes. We also asked for three more skills they didn't have today, but wanted to acquire in the next decade or so. These went on orange Post-Its. We were especially interested in those skills that felt intimidating or urgent. The 8 or 10 people at each table then shared these with each other, by way of introducing themselves.
The skills are listed in this Google Sheets document.
Unsurprisingly, the most common 'skills I have' were around geoscience: seismic interpretation, seismic analysis, stratigraphy, engineering, modeling, sedimentology, petrophysics, and programming. And computational methods dominated the 'skills I want' category: machine learning, Python, coding or programming, deep learning, statistics, and mathematics.
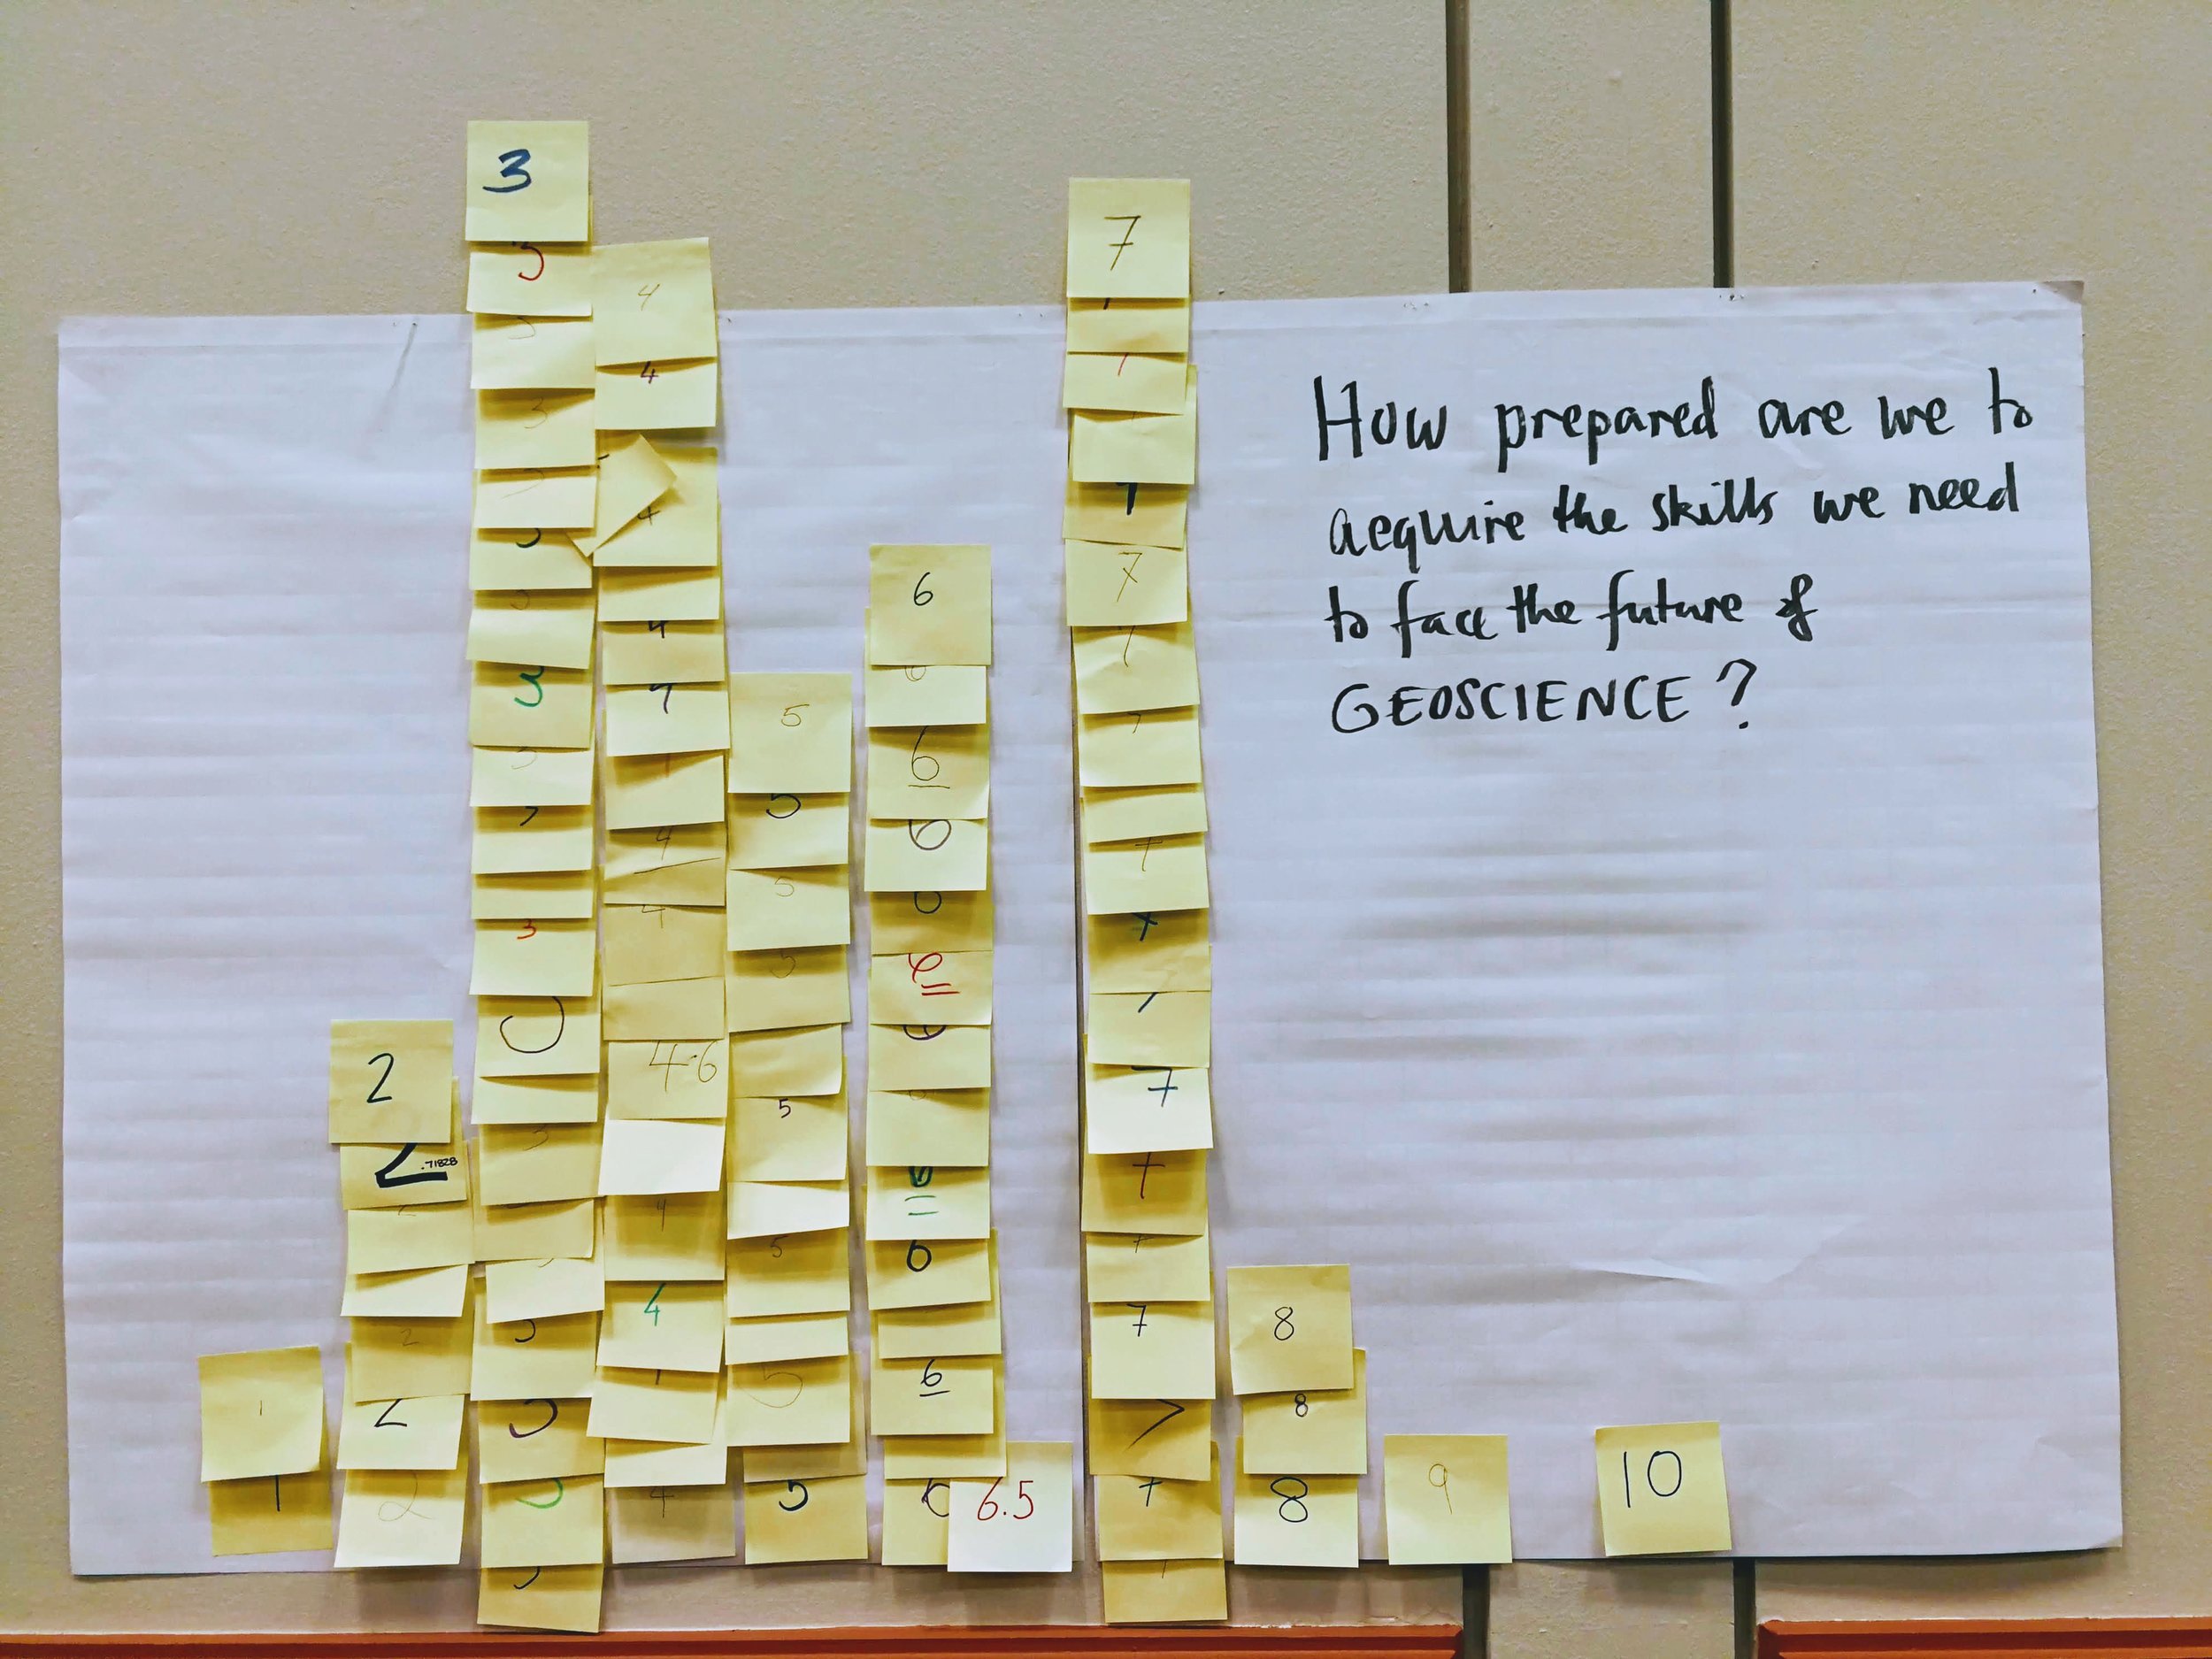
We followed this up with a more general question — How would you rate the industry's preparedness for this picture of the future, as implied by the skill gap we've identified?. People could substitute 'industry' for whatever similar scale institution felt meaningful to them. As shown (right), this resulted in a bimodal distribution: apparently there are two ways to think about the future of applied geoscience — this may merit more investigation with a more thorough survey.

Big questions in ML
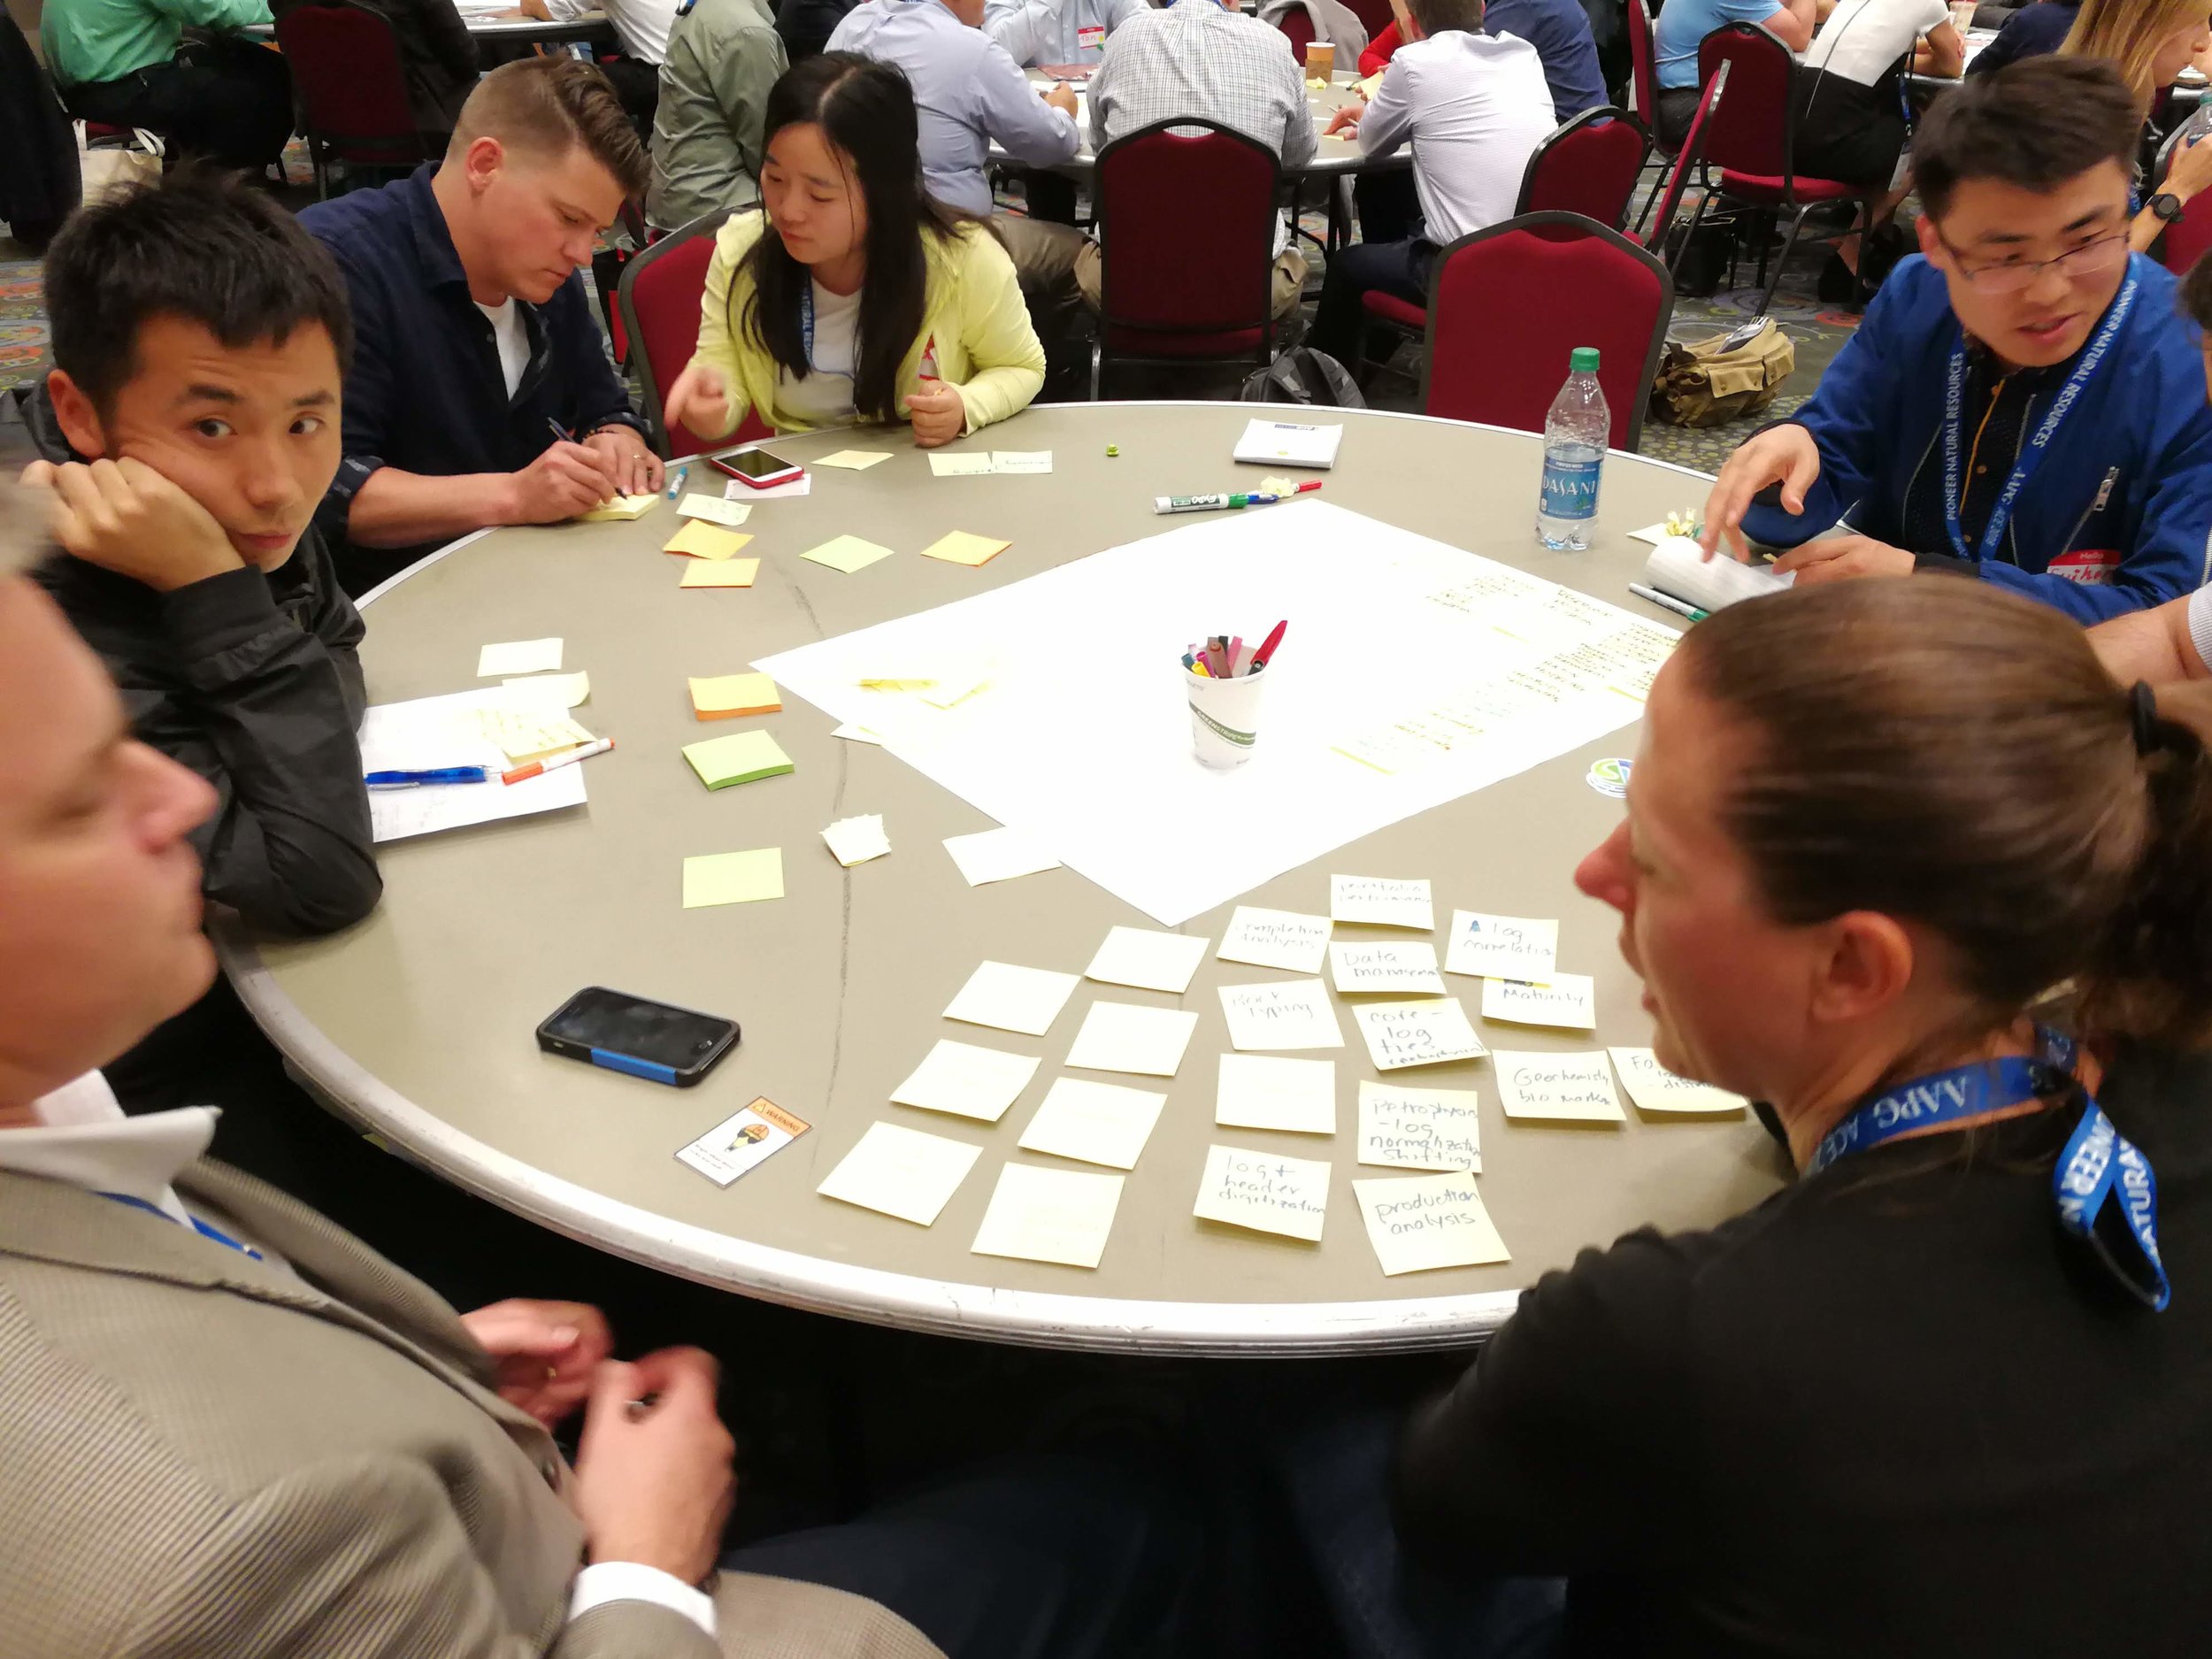
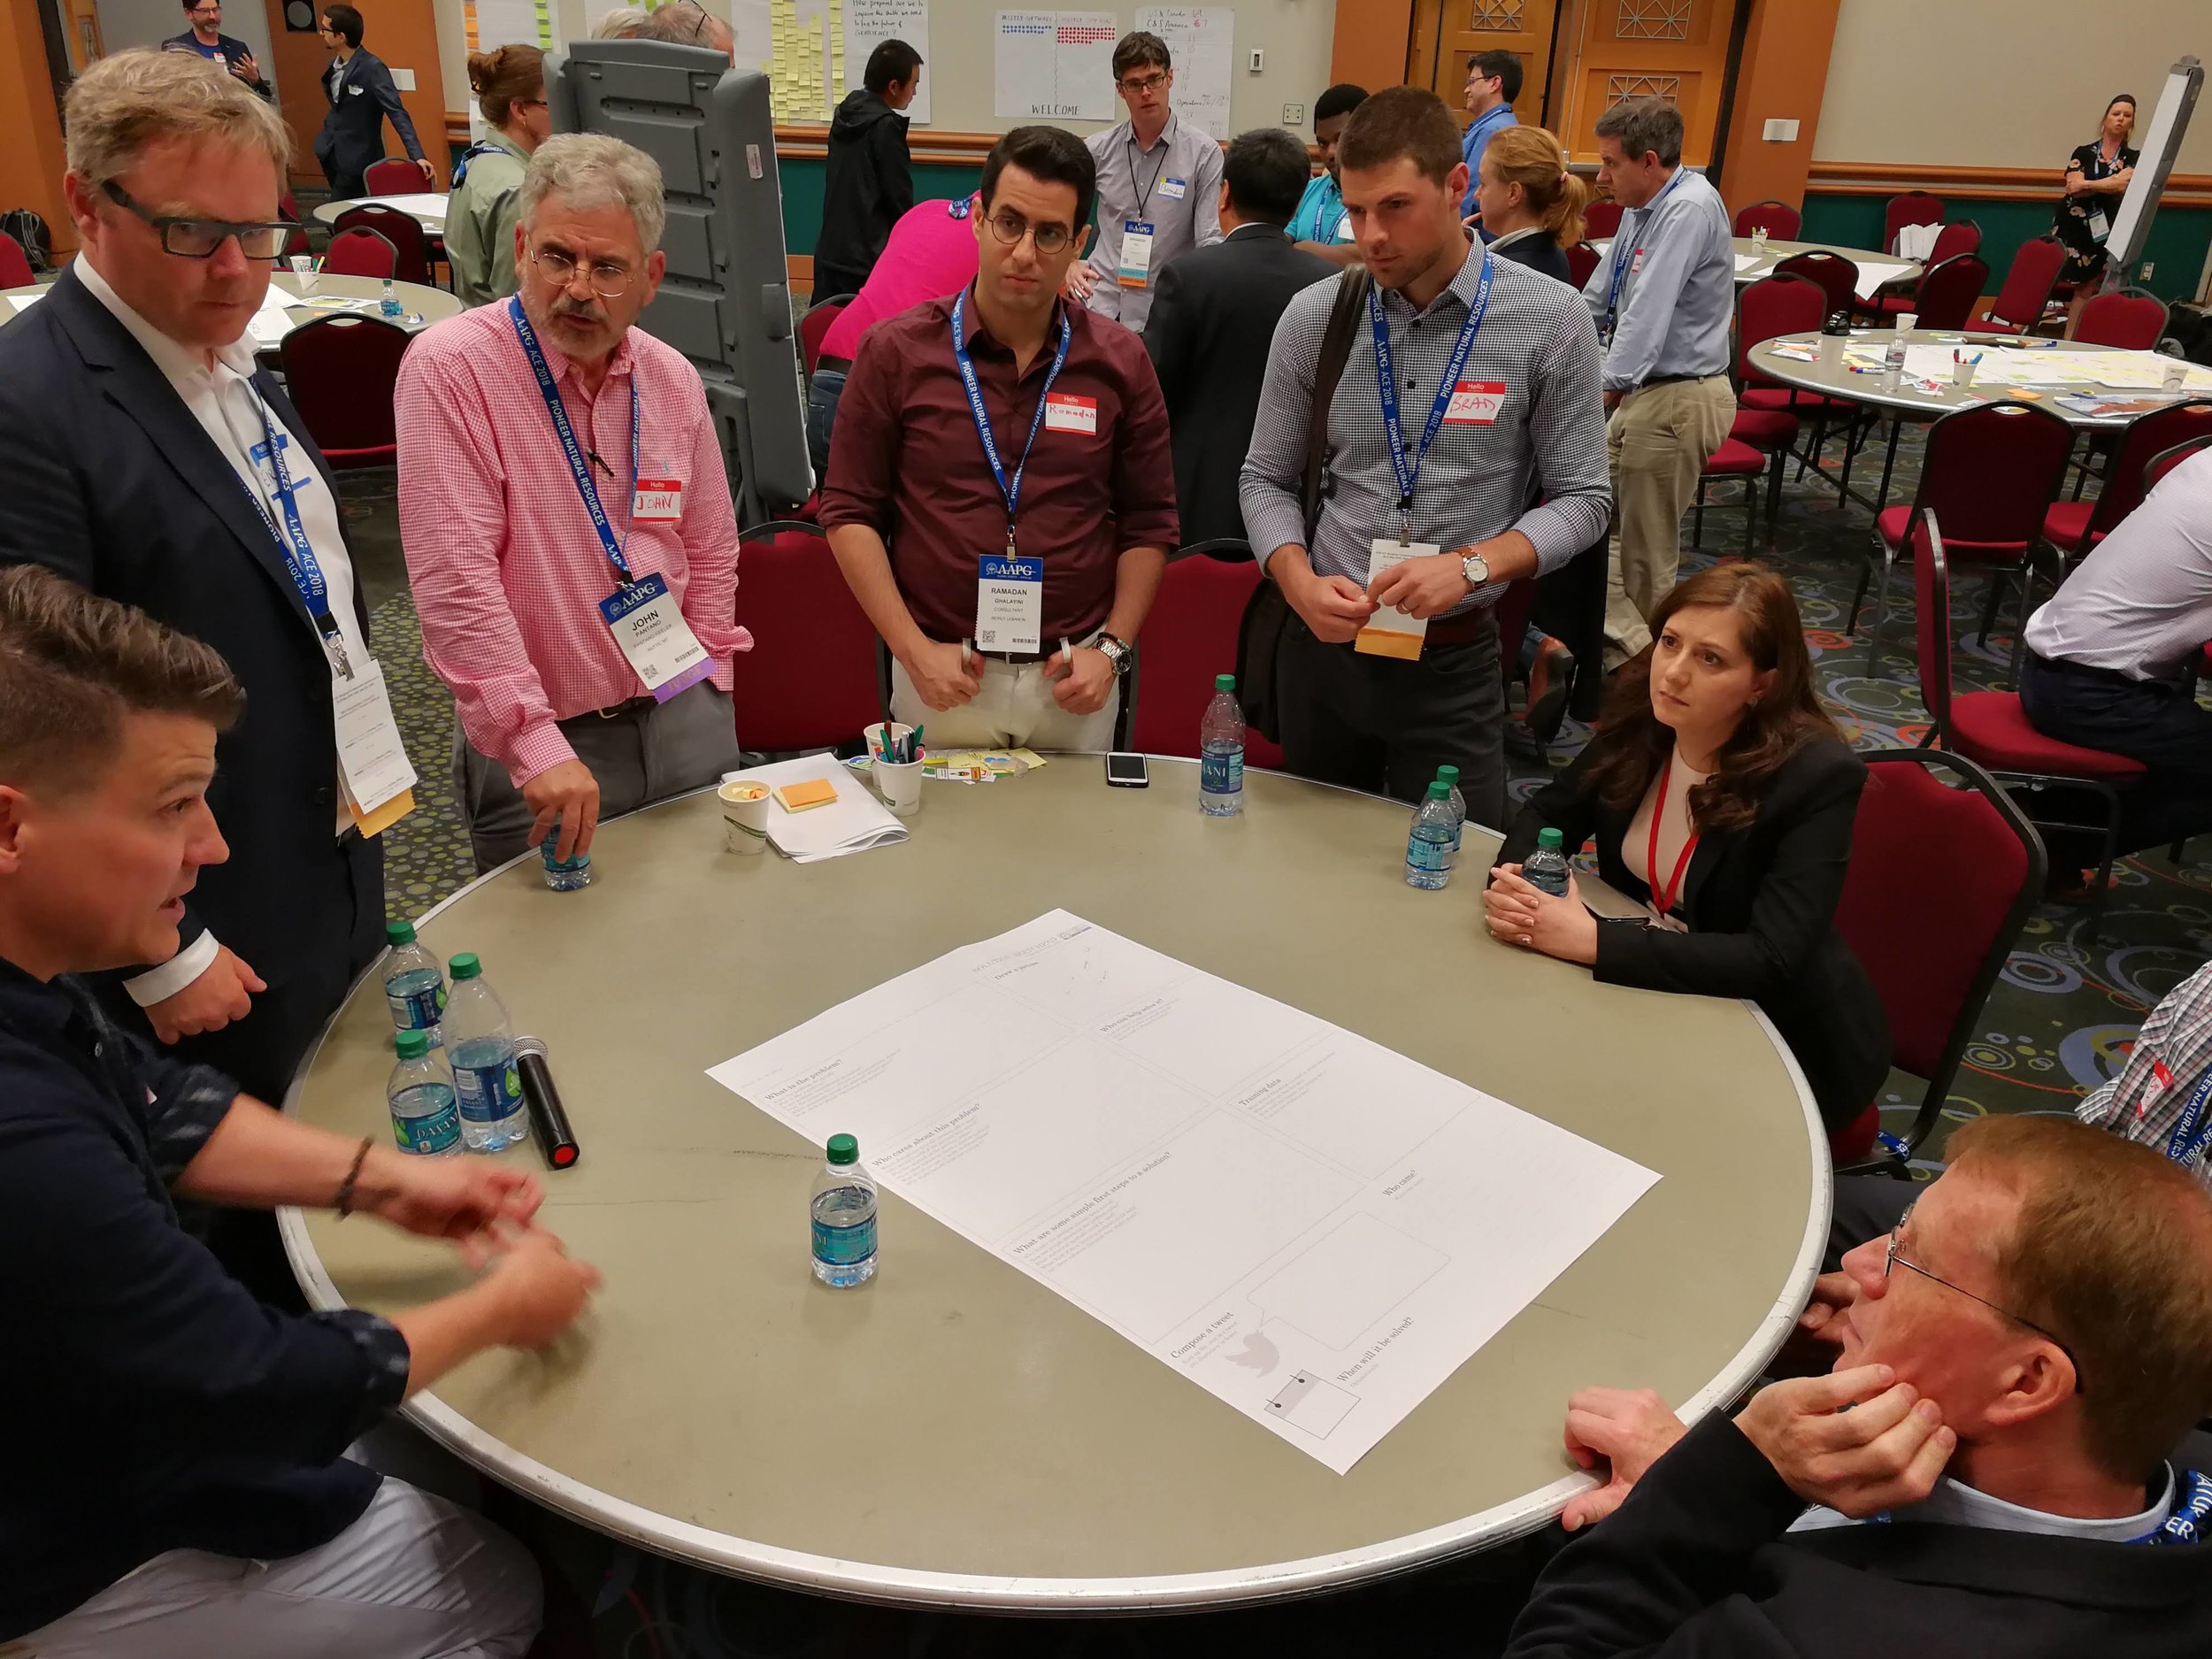
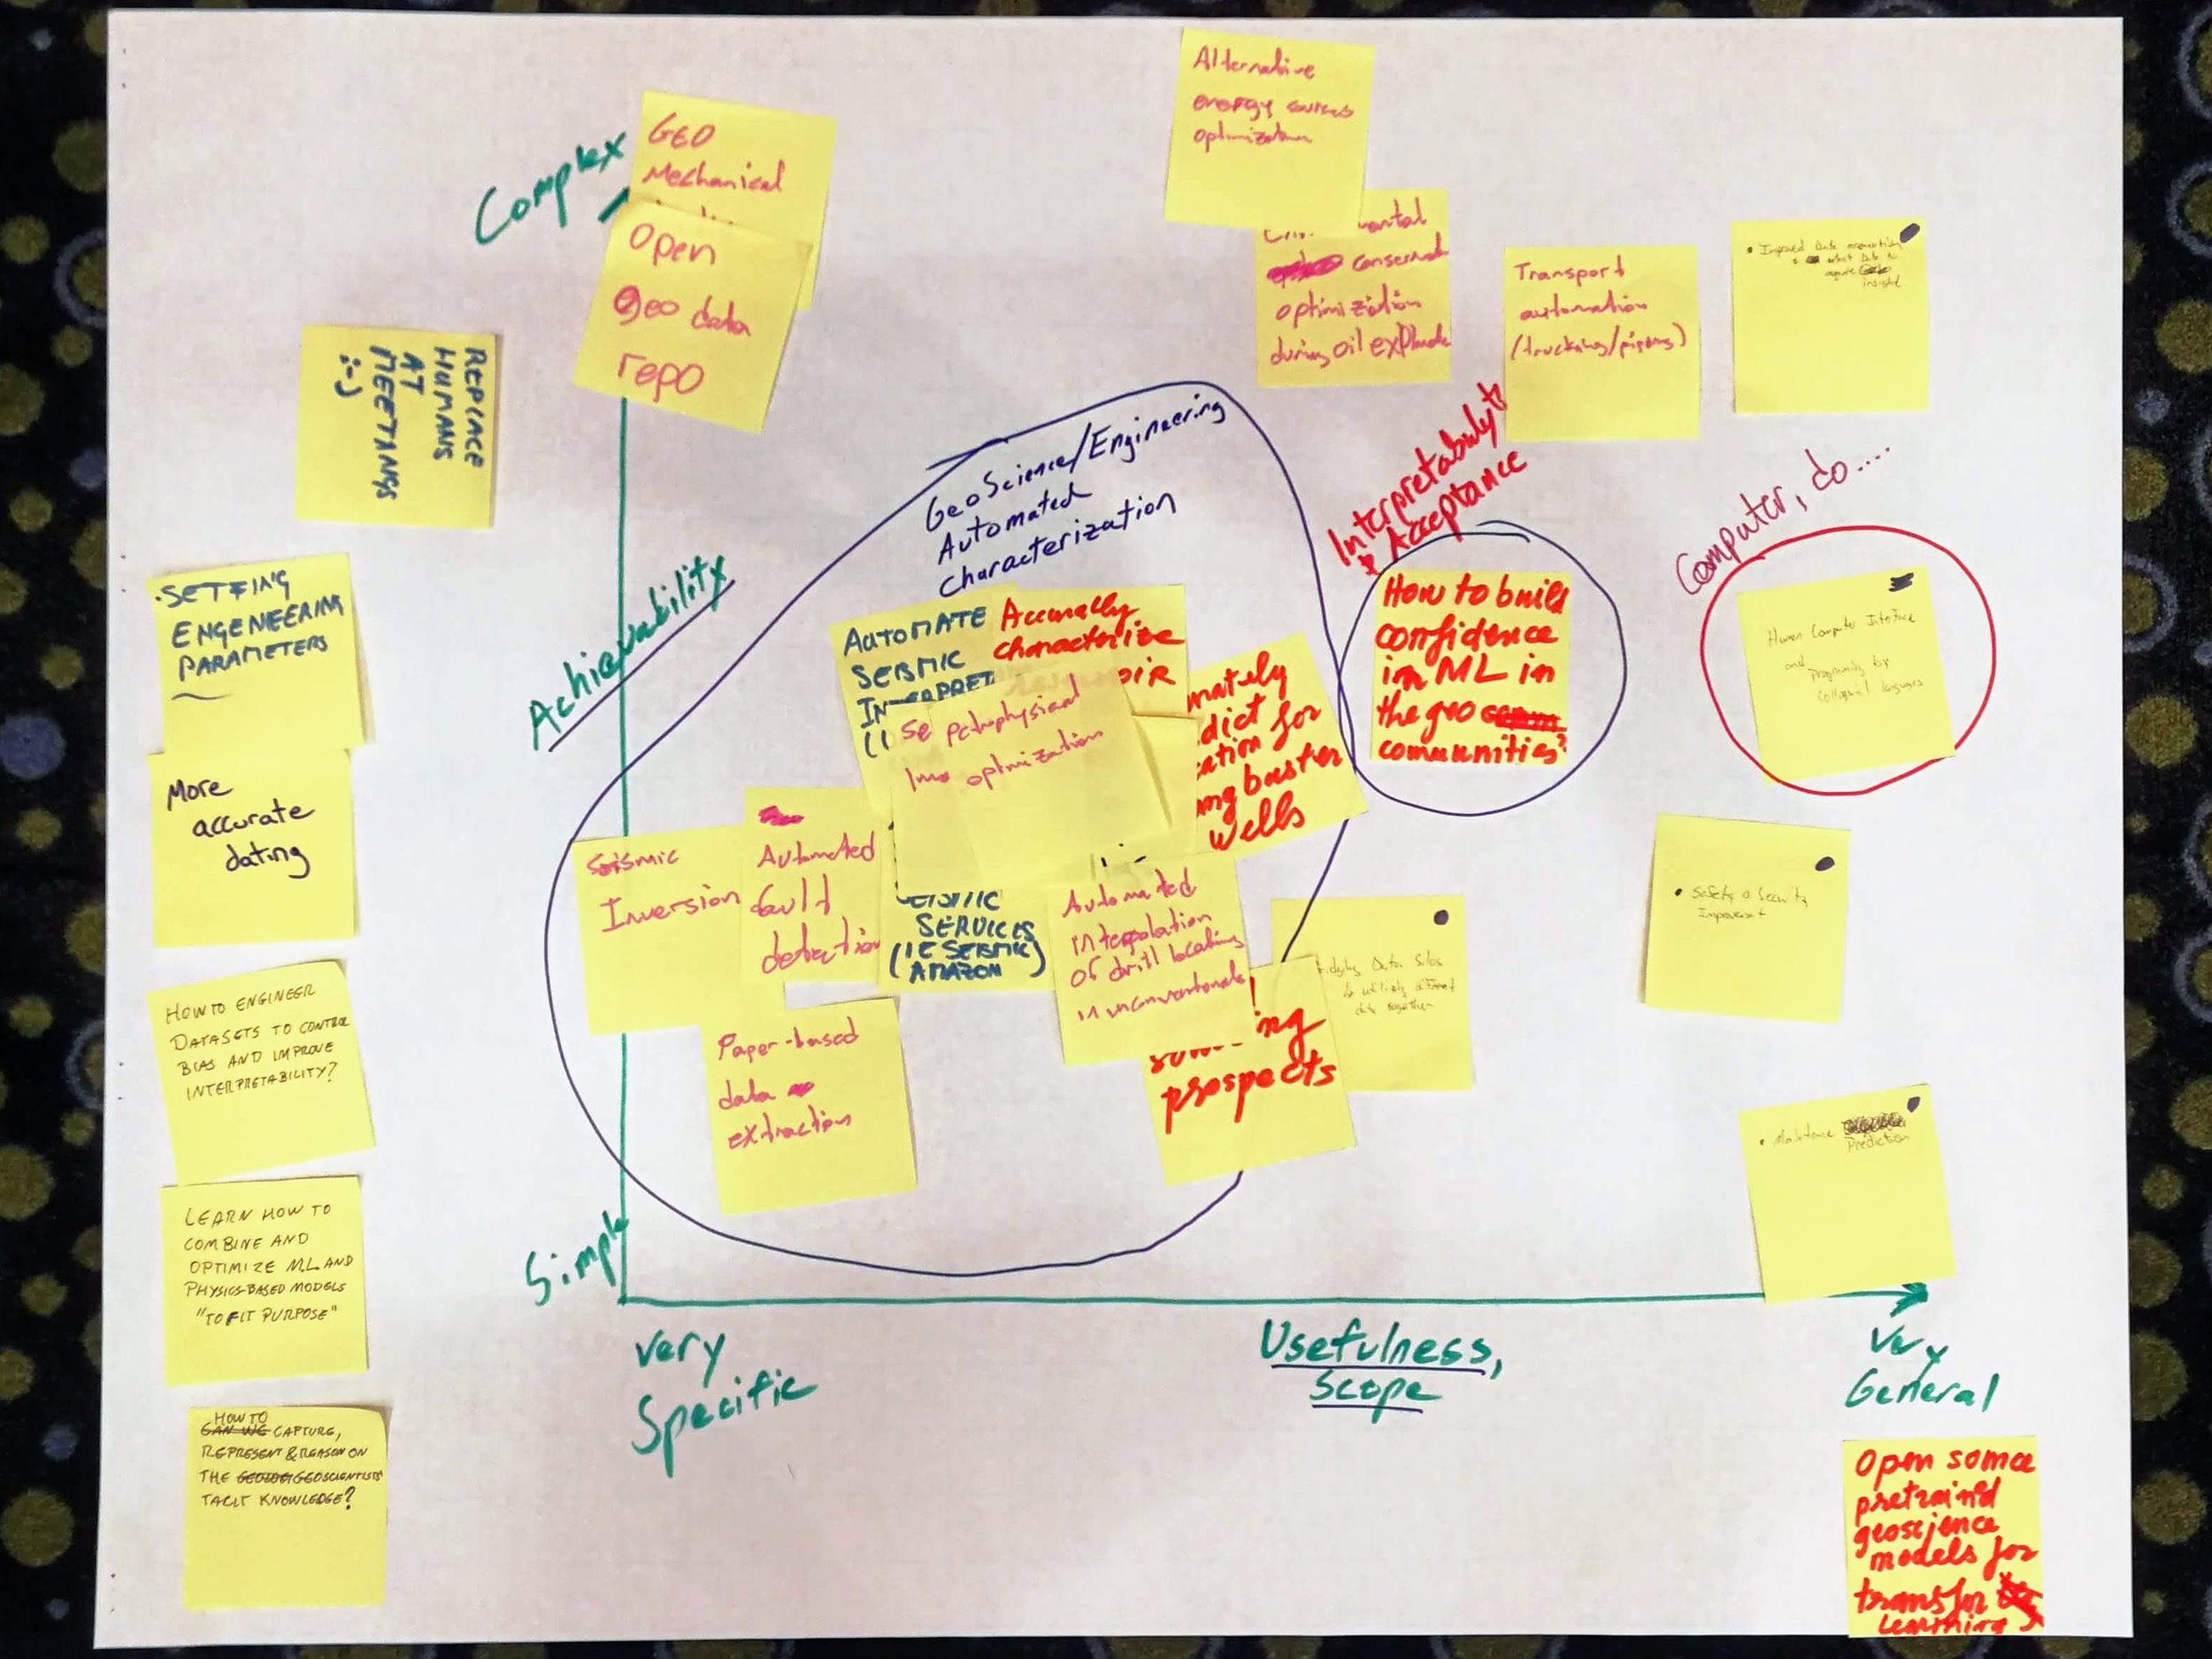
After the icebreaker, we asked the tables to respond to a big question:
What are the most pressing questions in applied geoscience that can probably be tackled with machine learning?
We realized that this sounds a bit 'hammer looking for a nail', but justified asking the question this way by drawing an anology with other important new tools of the past — well logging, or 3D seismic, or sequence stratigrapghy. The point is that we have this powerful new (to us) set of tools; what are we going to look at first? At this point, we wanted people to brainstorm, without applying constraints like time or money.
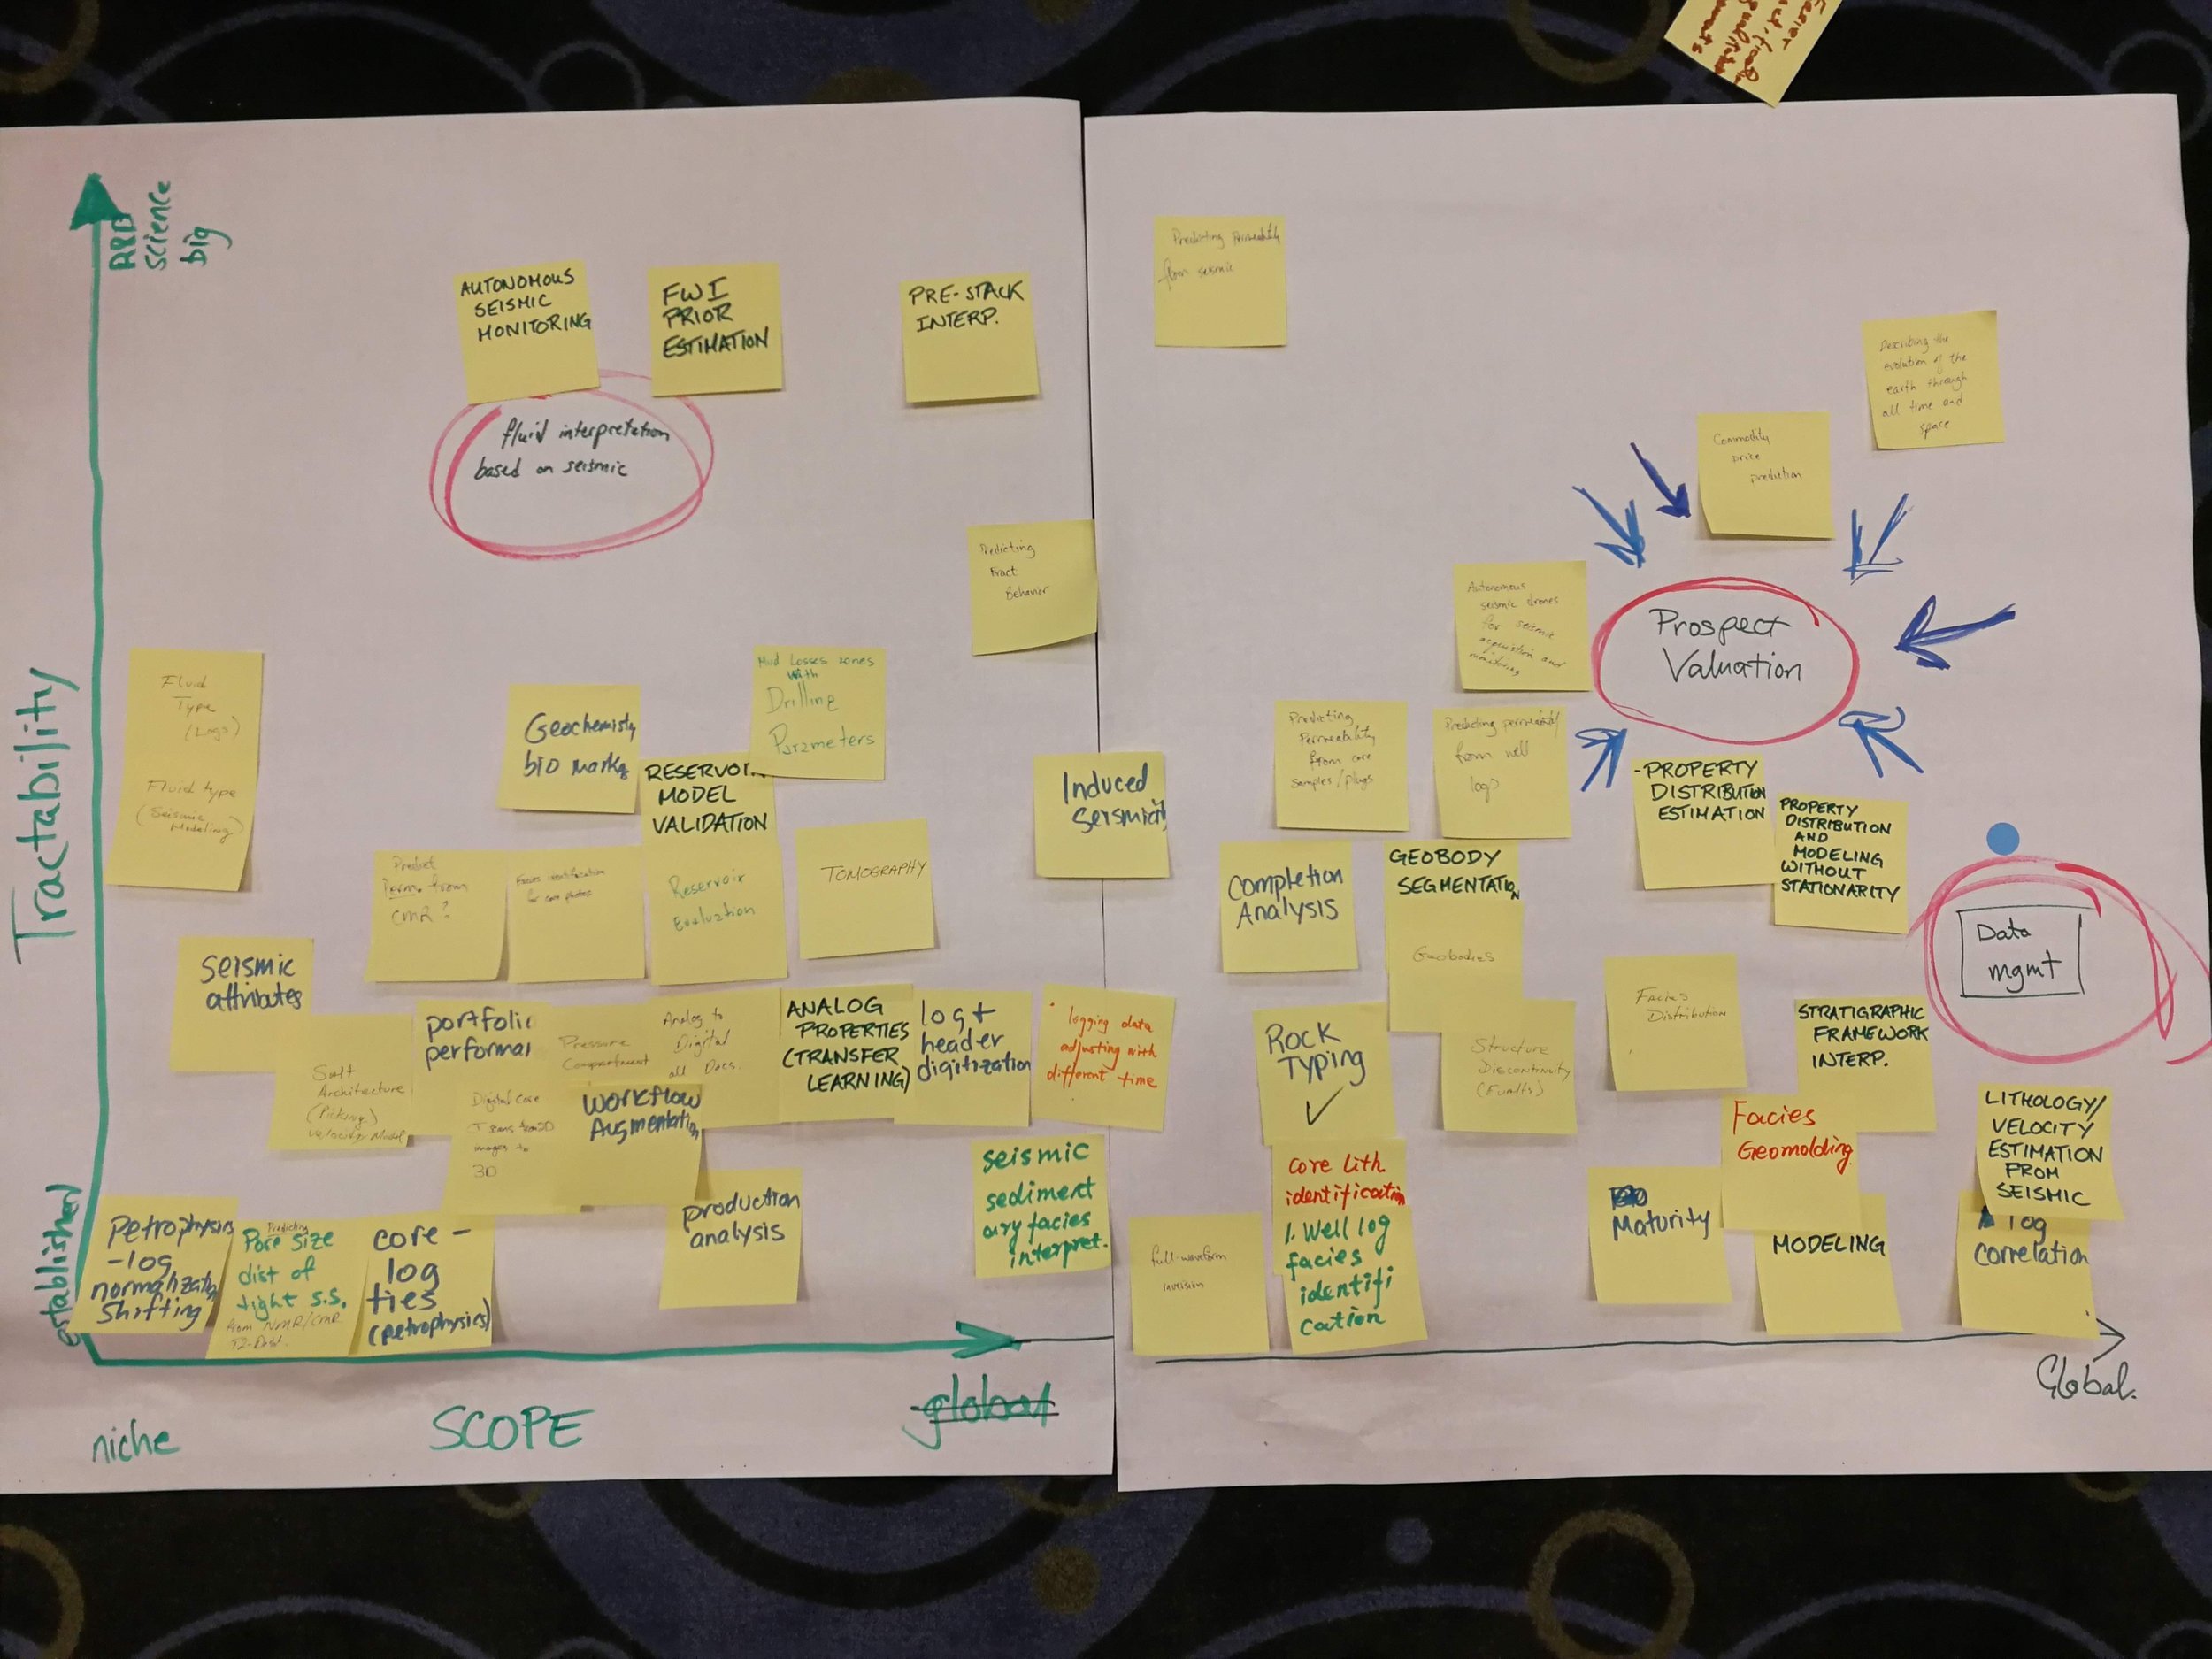
This yielded approximately 280 ideas, all documented in the Google Sheet. Once the problems had been captured, the tables rotated so that each team walked to a neighboring table, leaving all their problems behind... and adopting new ones. We then asked them to score the new problems on two axes: scope (local vs global problems) and tractability (easy vs hard problems). This provided the basis for each table to choose one problem to take to the room for voting (each person had 9 votes to cast). This filtering process resulted in the following list:
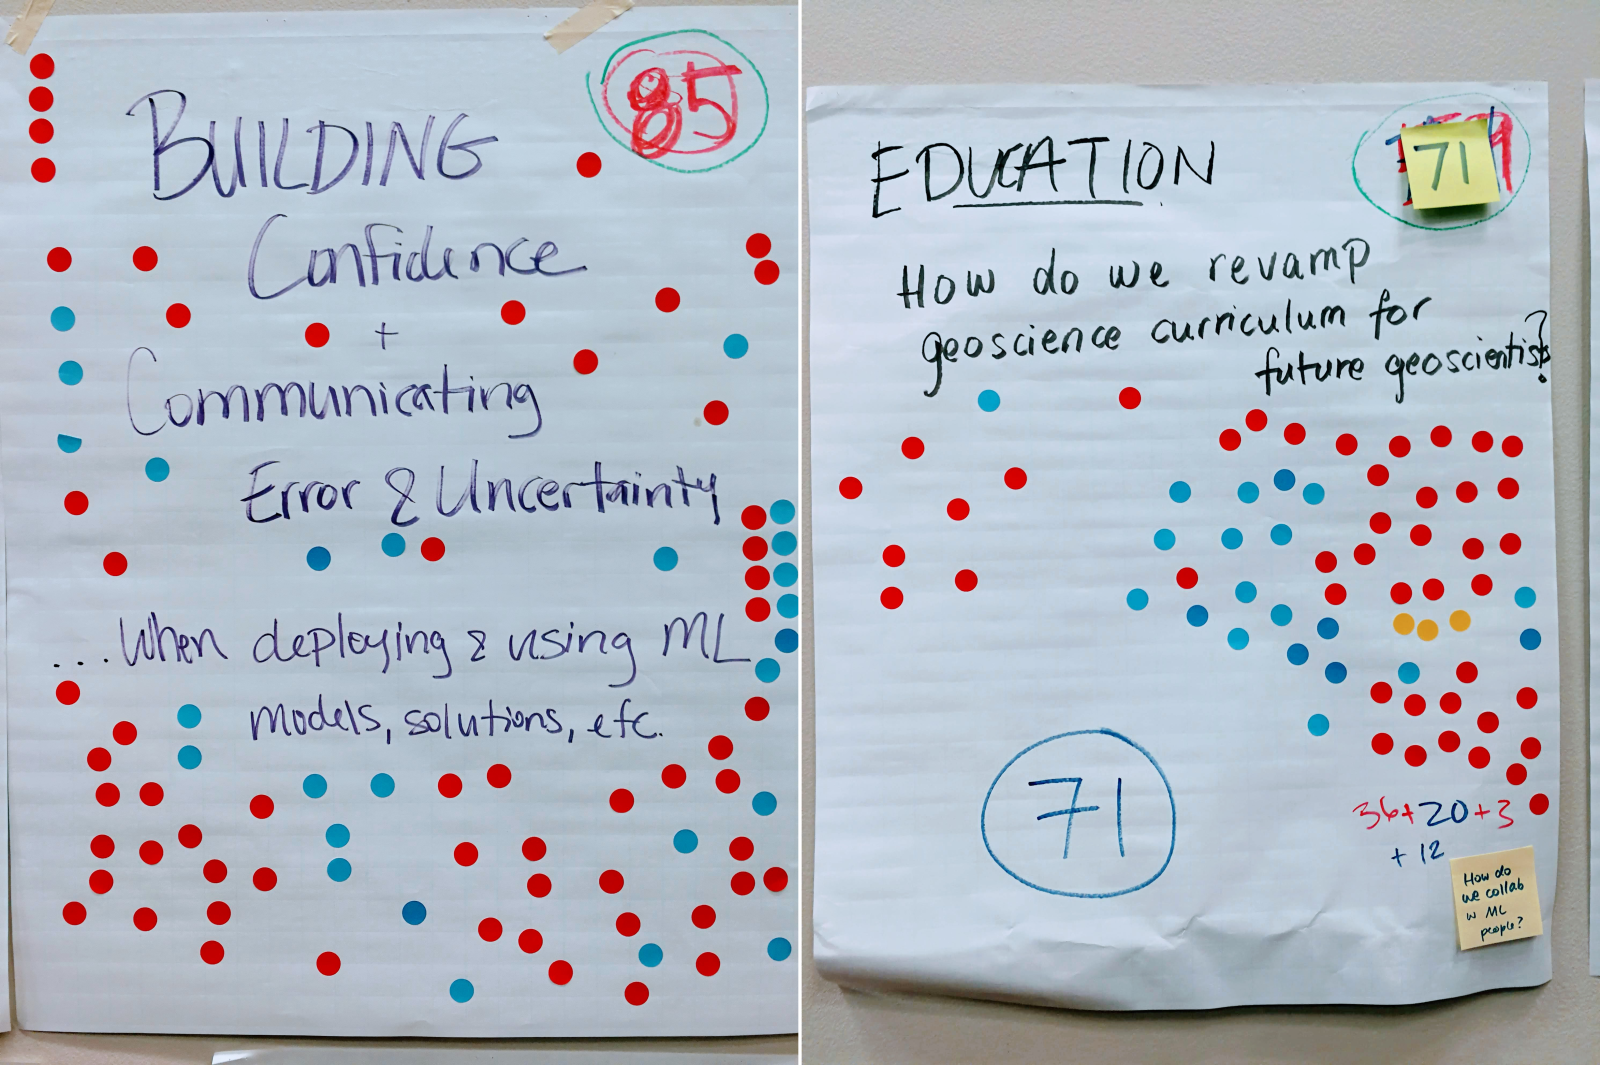
How do we communicate error and uncertainty when using machine learning models and solutions? 85 votes.
How do we account for data integration, integrity, and provenance in our models? 78 votes.
How do we revamp the geoscience curriculum for future geoscientists? 71 votes.
What does guided, searchable, legacy data integration look like? 68 votes.
How can machine learning improve seismic data quality, or provide assistive technology on poor data? 65 votes.
How does the interpretability of machine learning model predictions affect their acceptance? 54 votes.
How do we train a model to assign value to prospects? 51 votes.
How do we teach artificial intelligences foundational geology? 45 votes.
How can we implement automatic core description? 42 votes.
How can we contain bad uses of AI? 40 votes.
Is self-steering well drilling possible? 21 votes.
I am paraphrasing most of those, but you can read the originals in the Google Sheet data harvest.
Exploring the questions
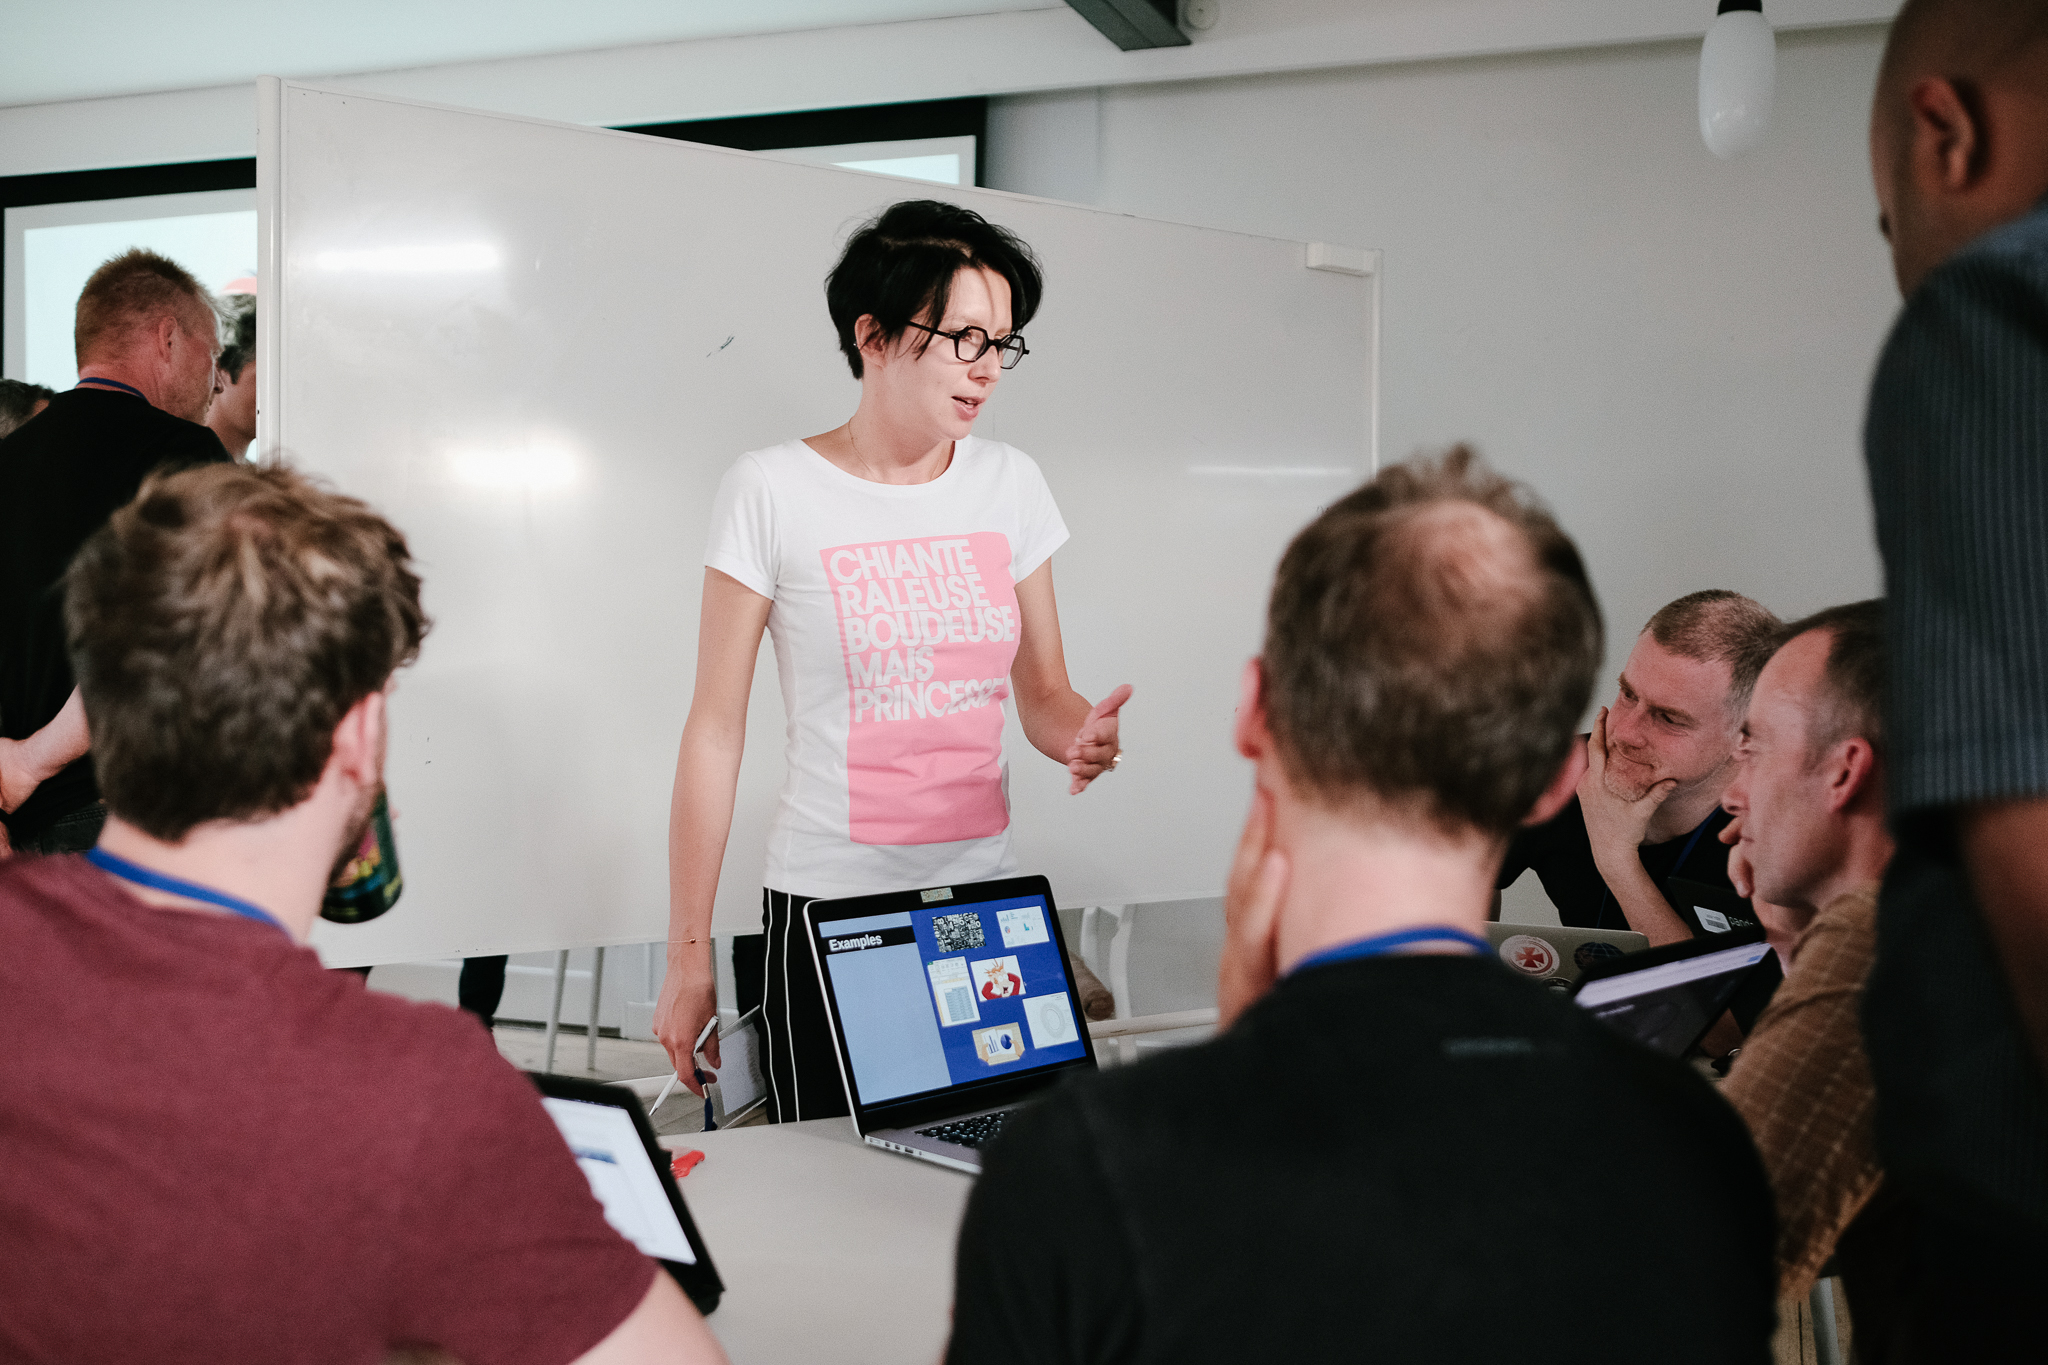
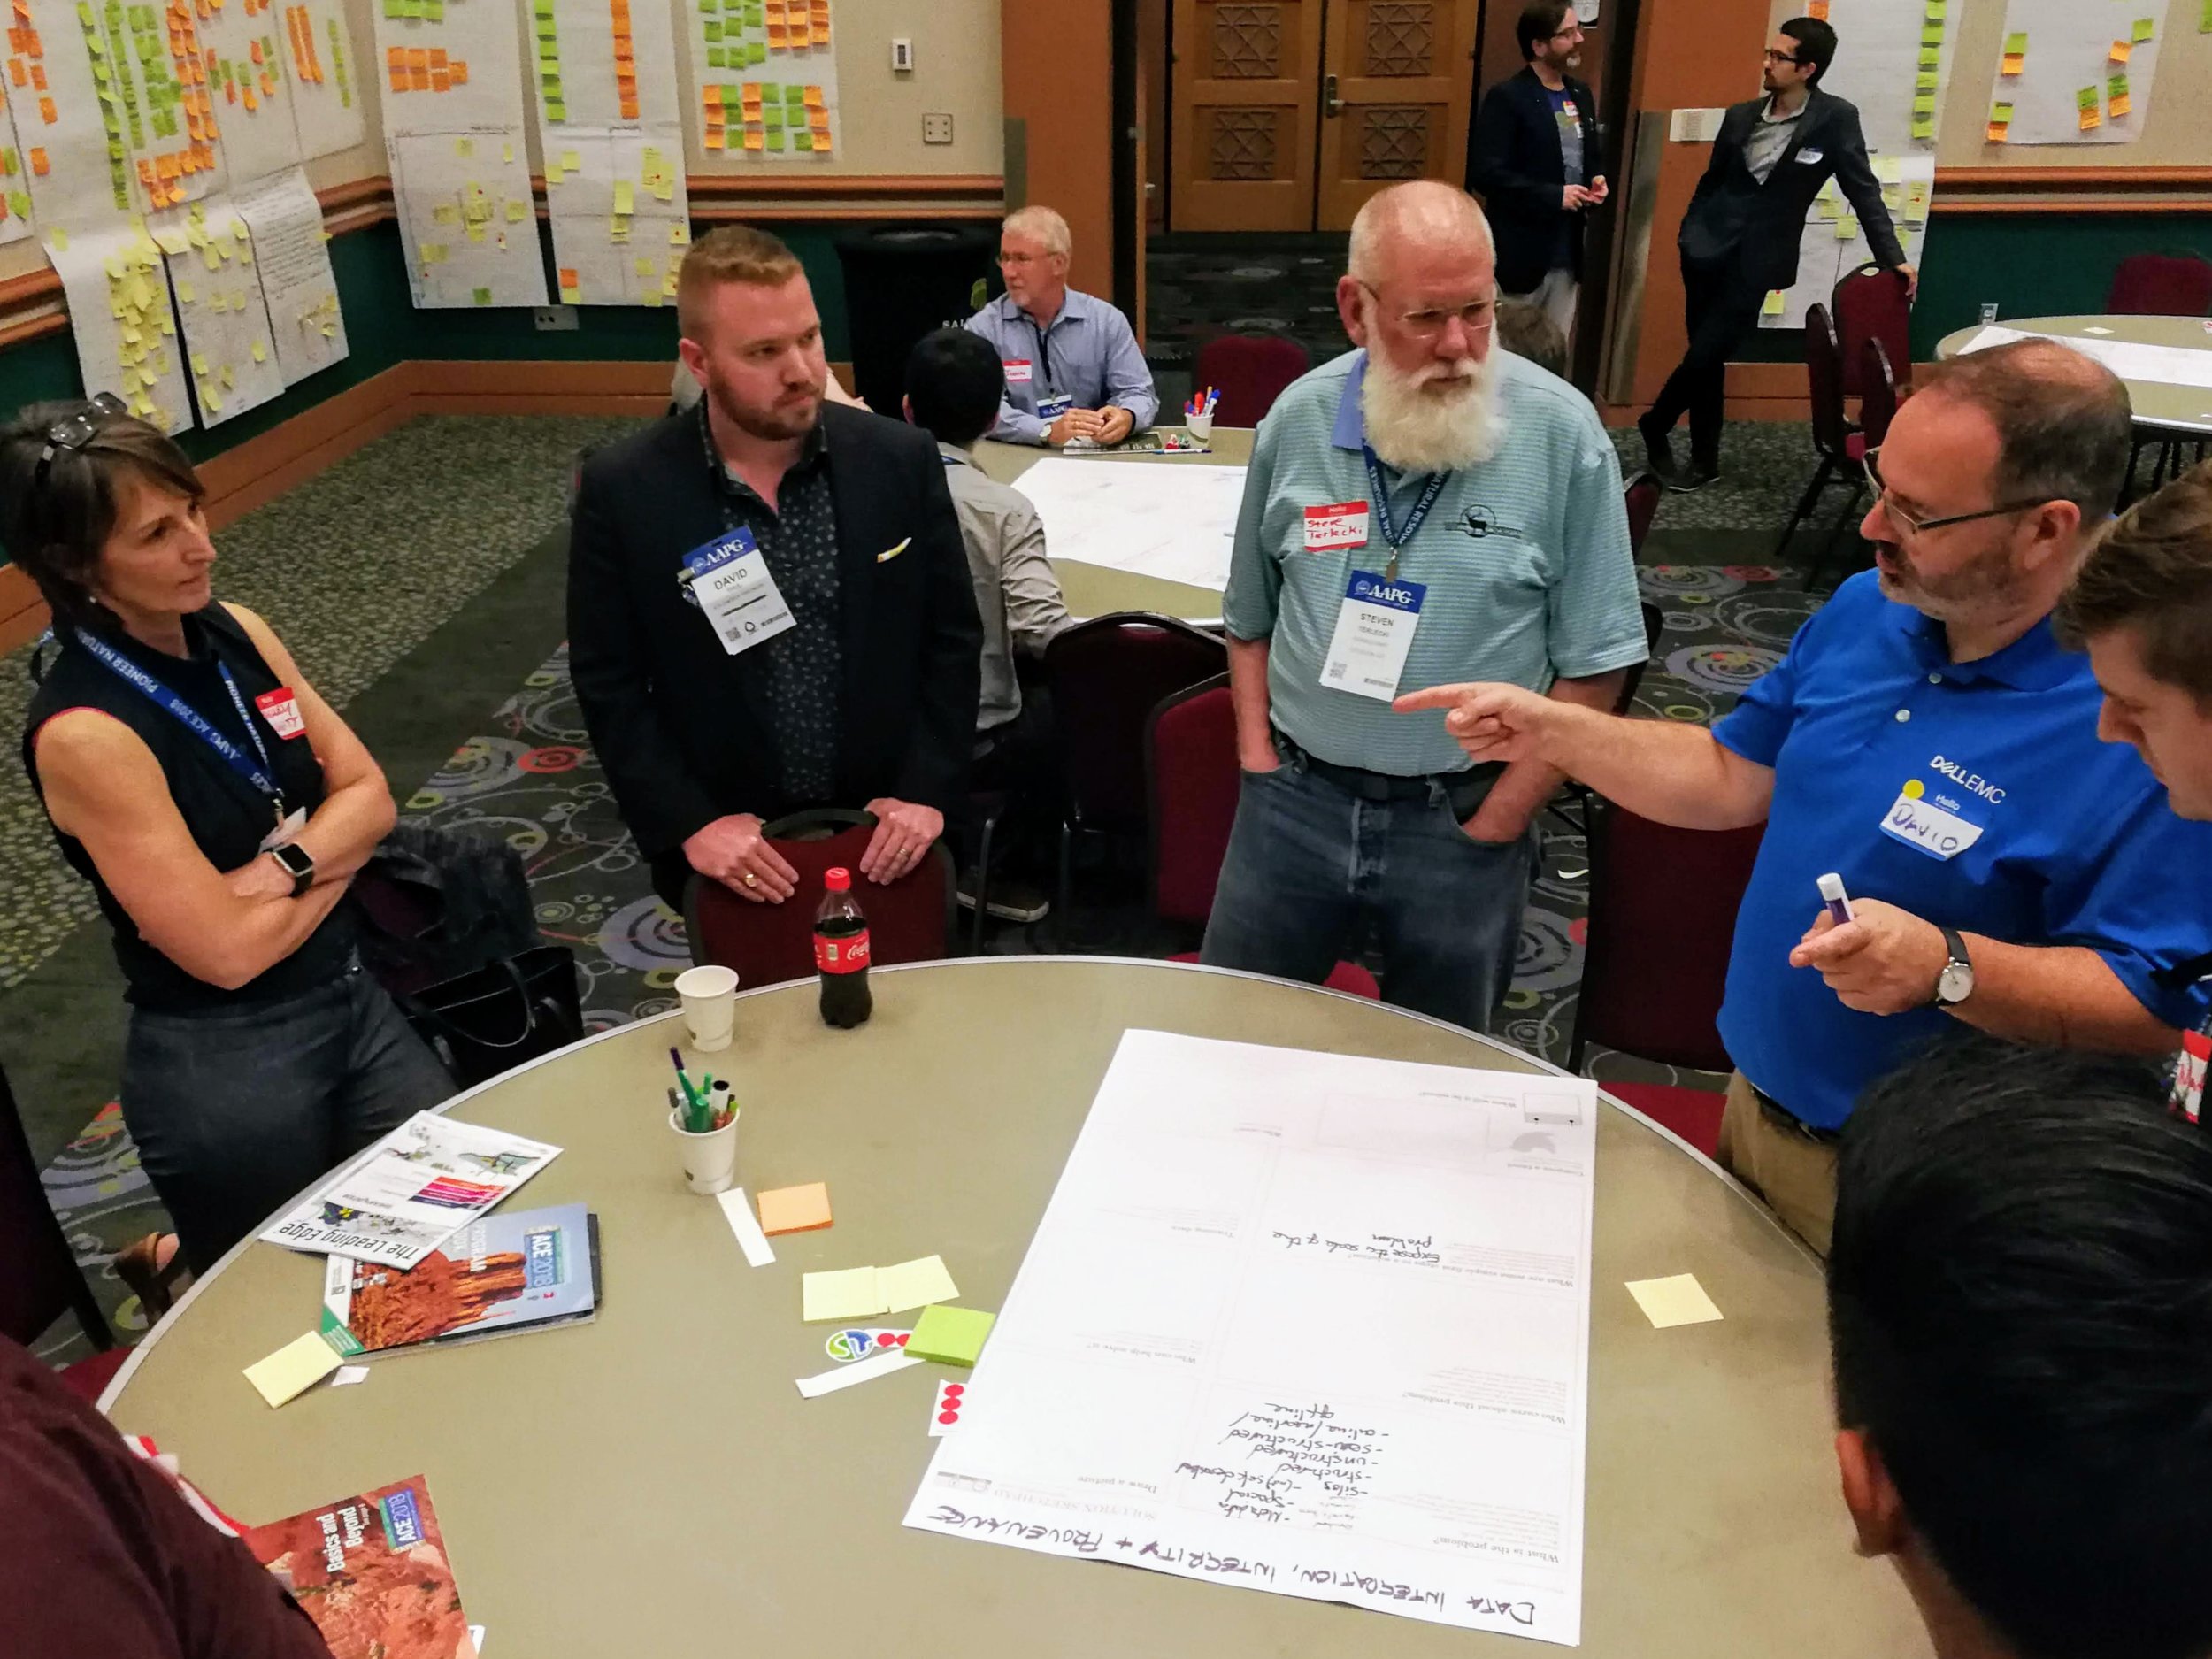
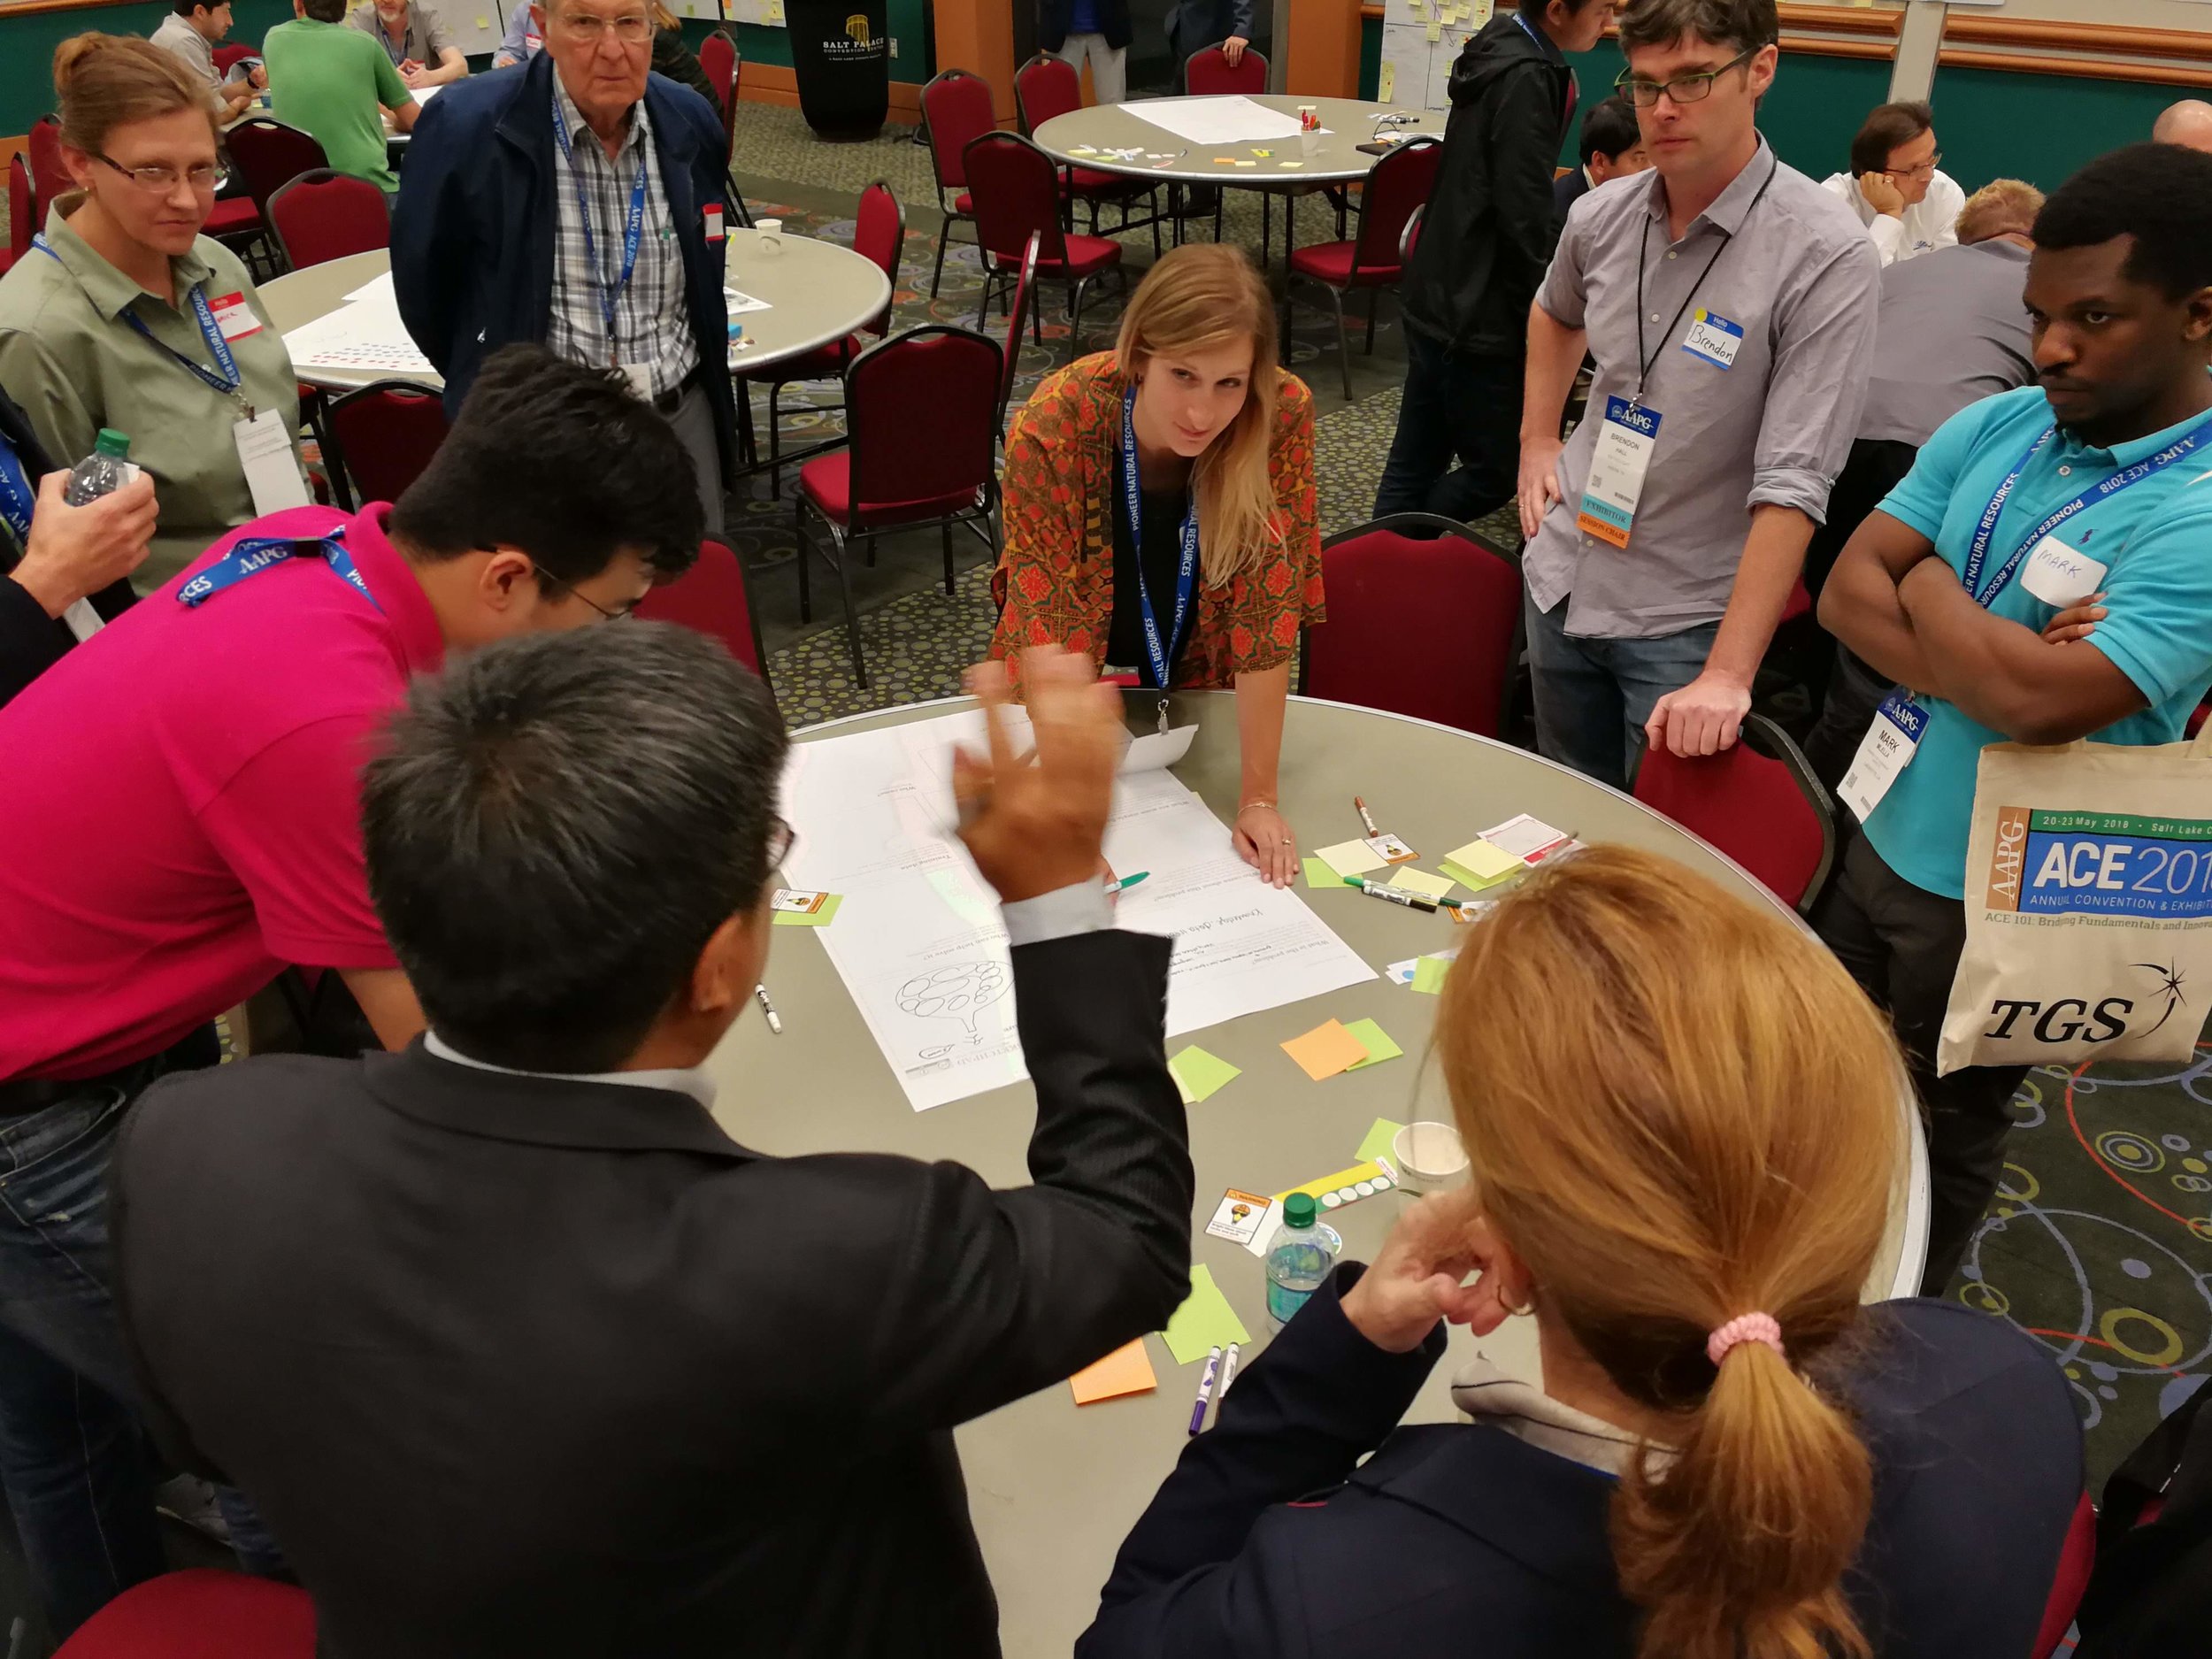
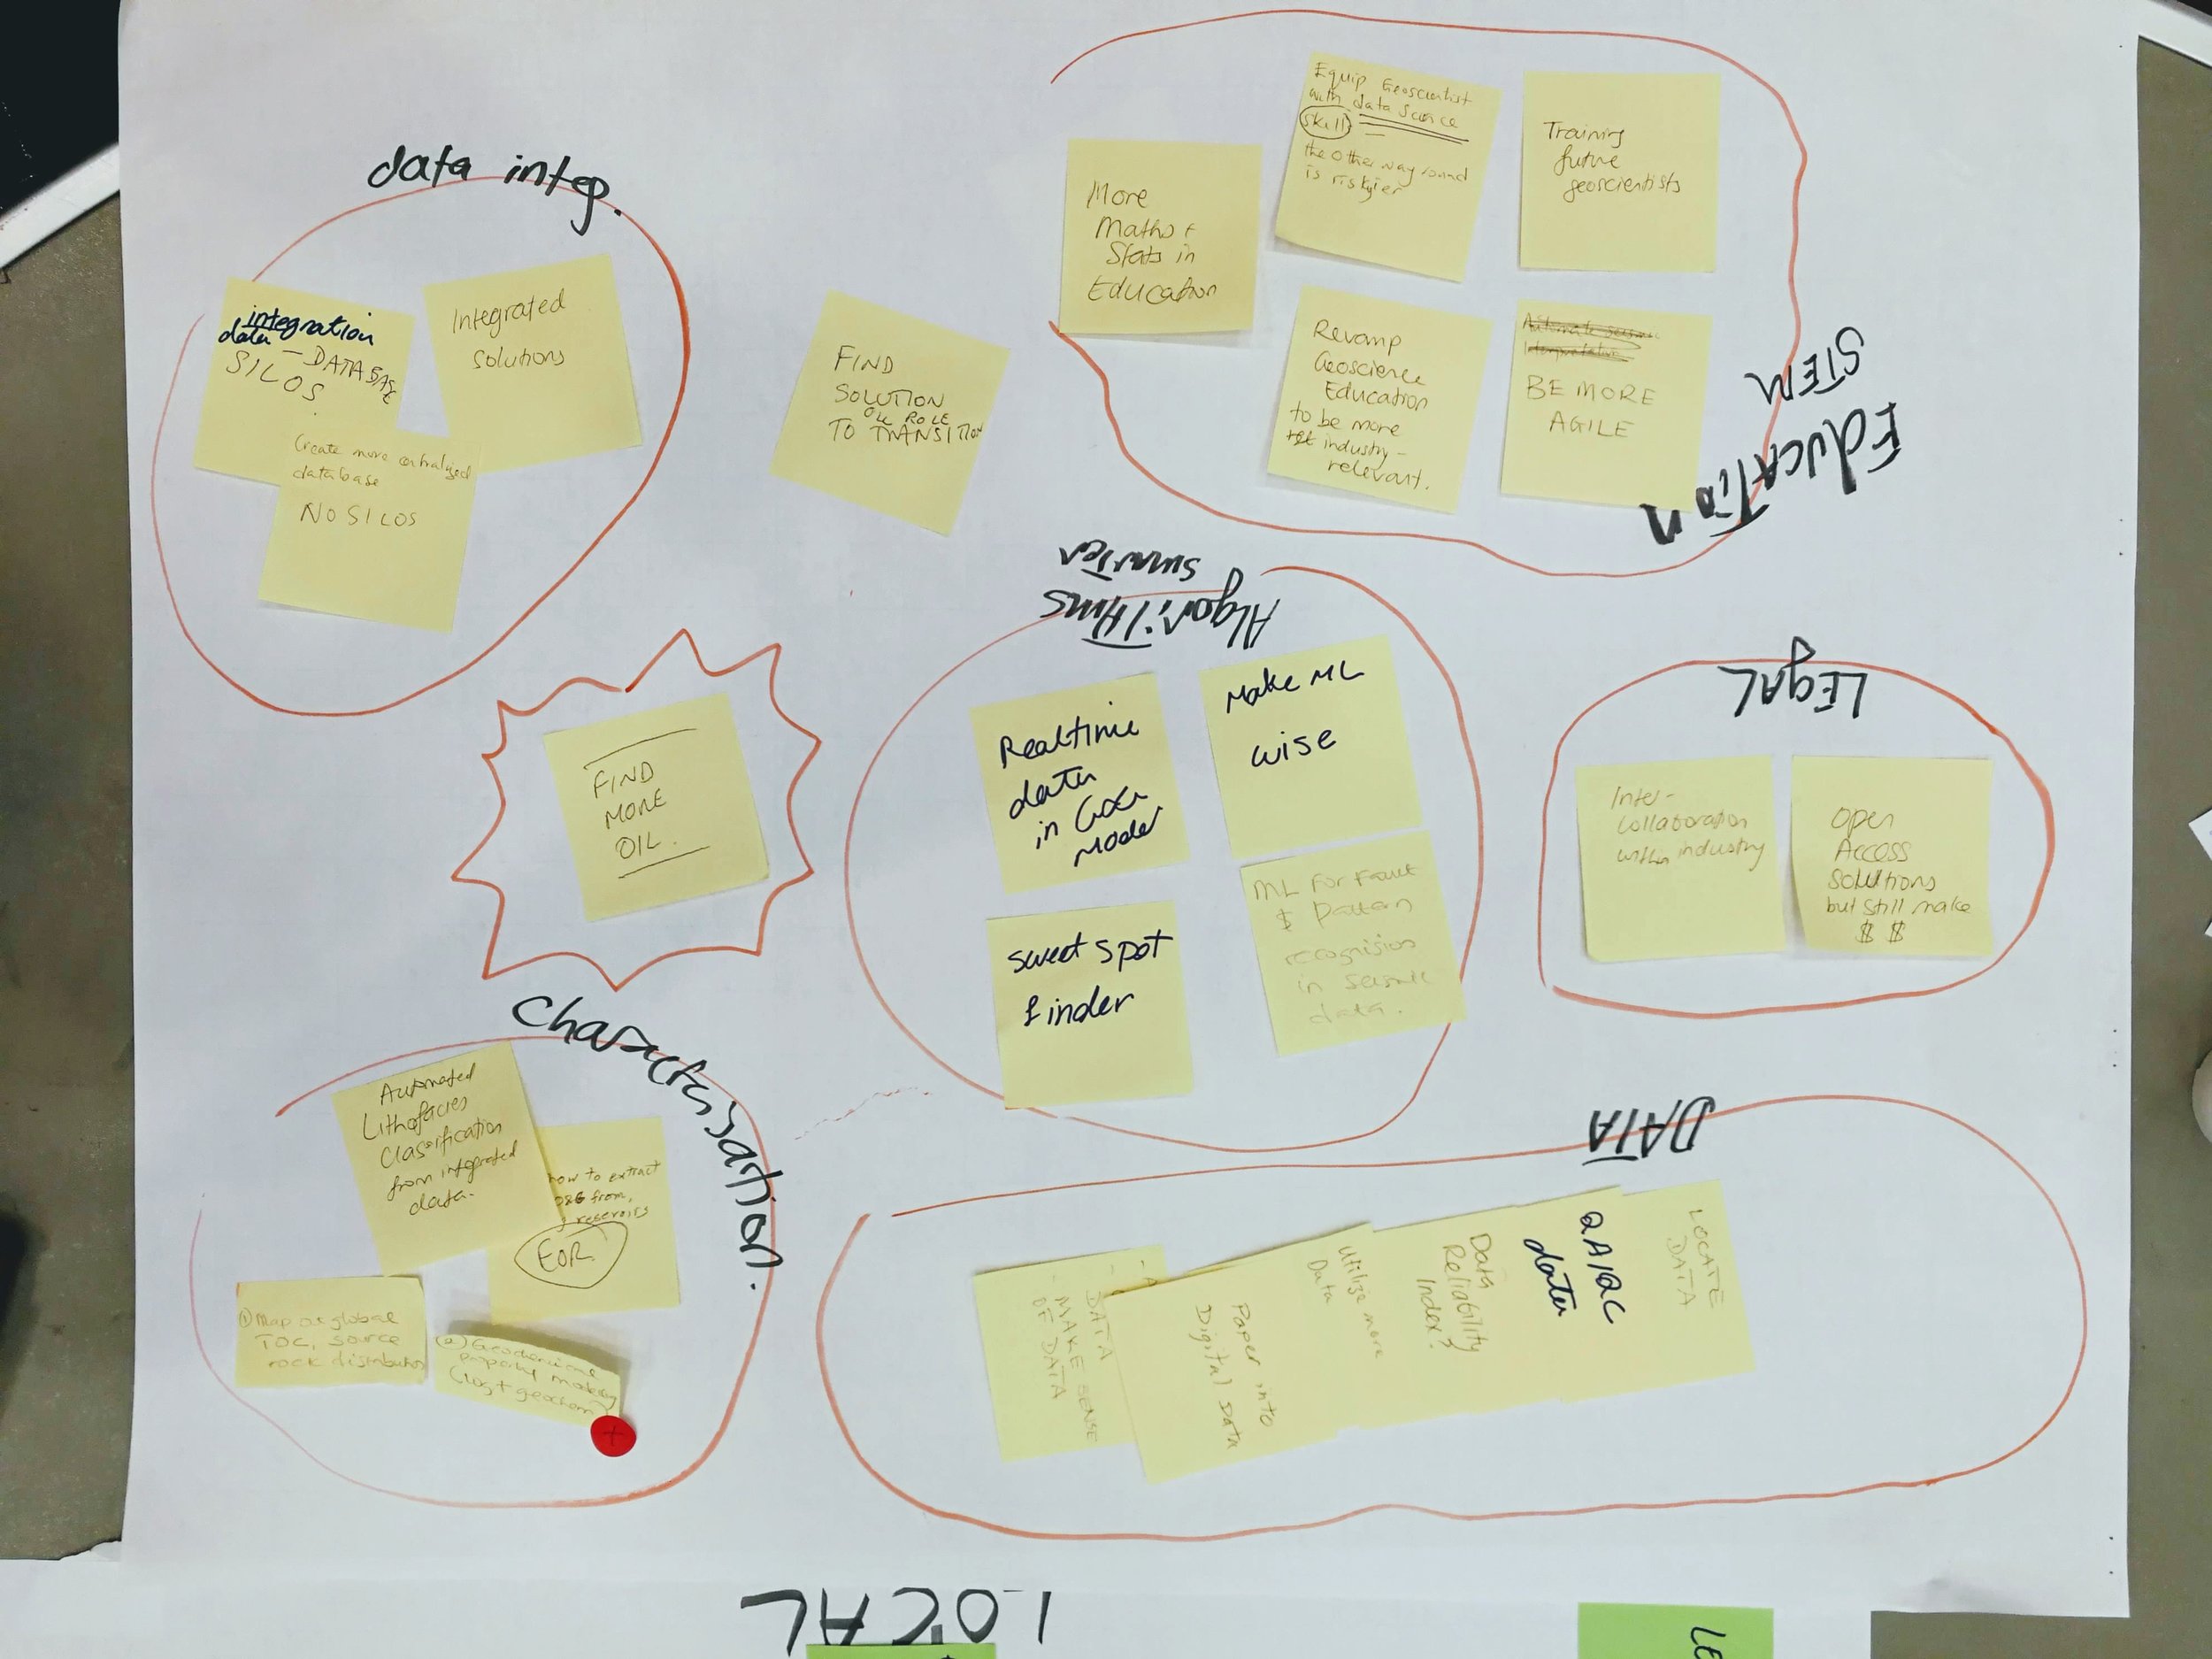
In the final stage of the afternoon, we took the top 6 questions from the list above, and dug into them a little deeper. Tables picked their way through our Solution Sketchpads — especially updated for machine learning problems — to help them navigate the problems. Clearly, these questions were too enormous to make much progress in the hour or so left in the day, but the point here was to sound out some ideas, identify some possible actions, and connect with others interested in working on the problem.
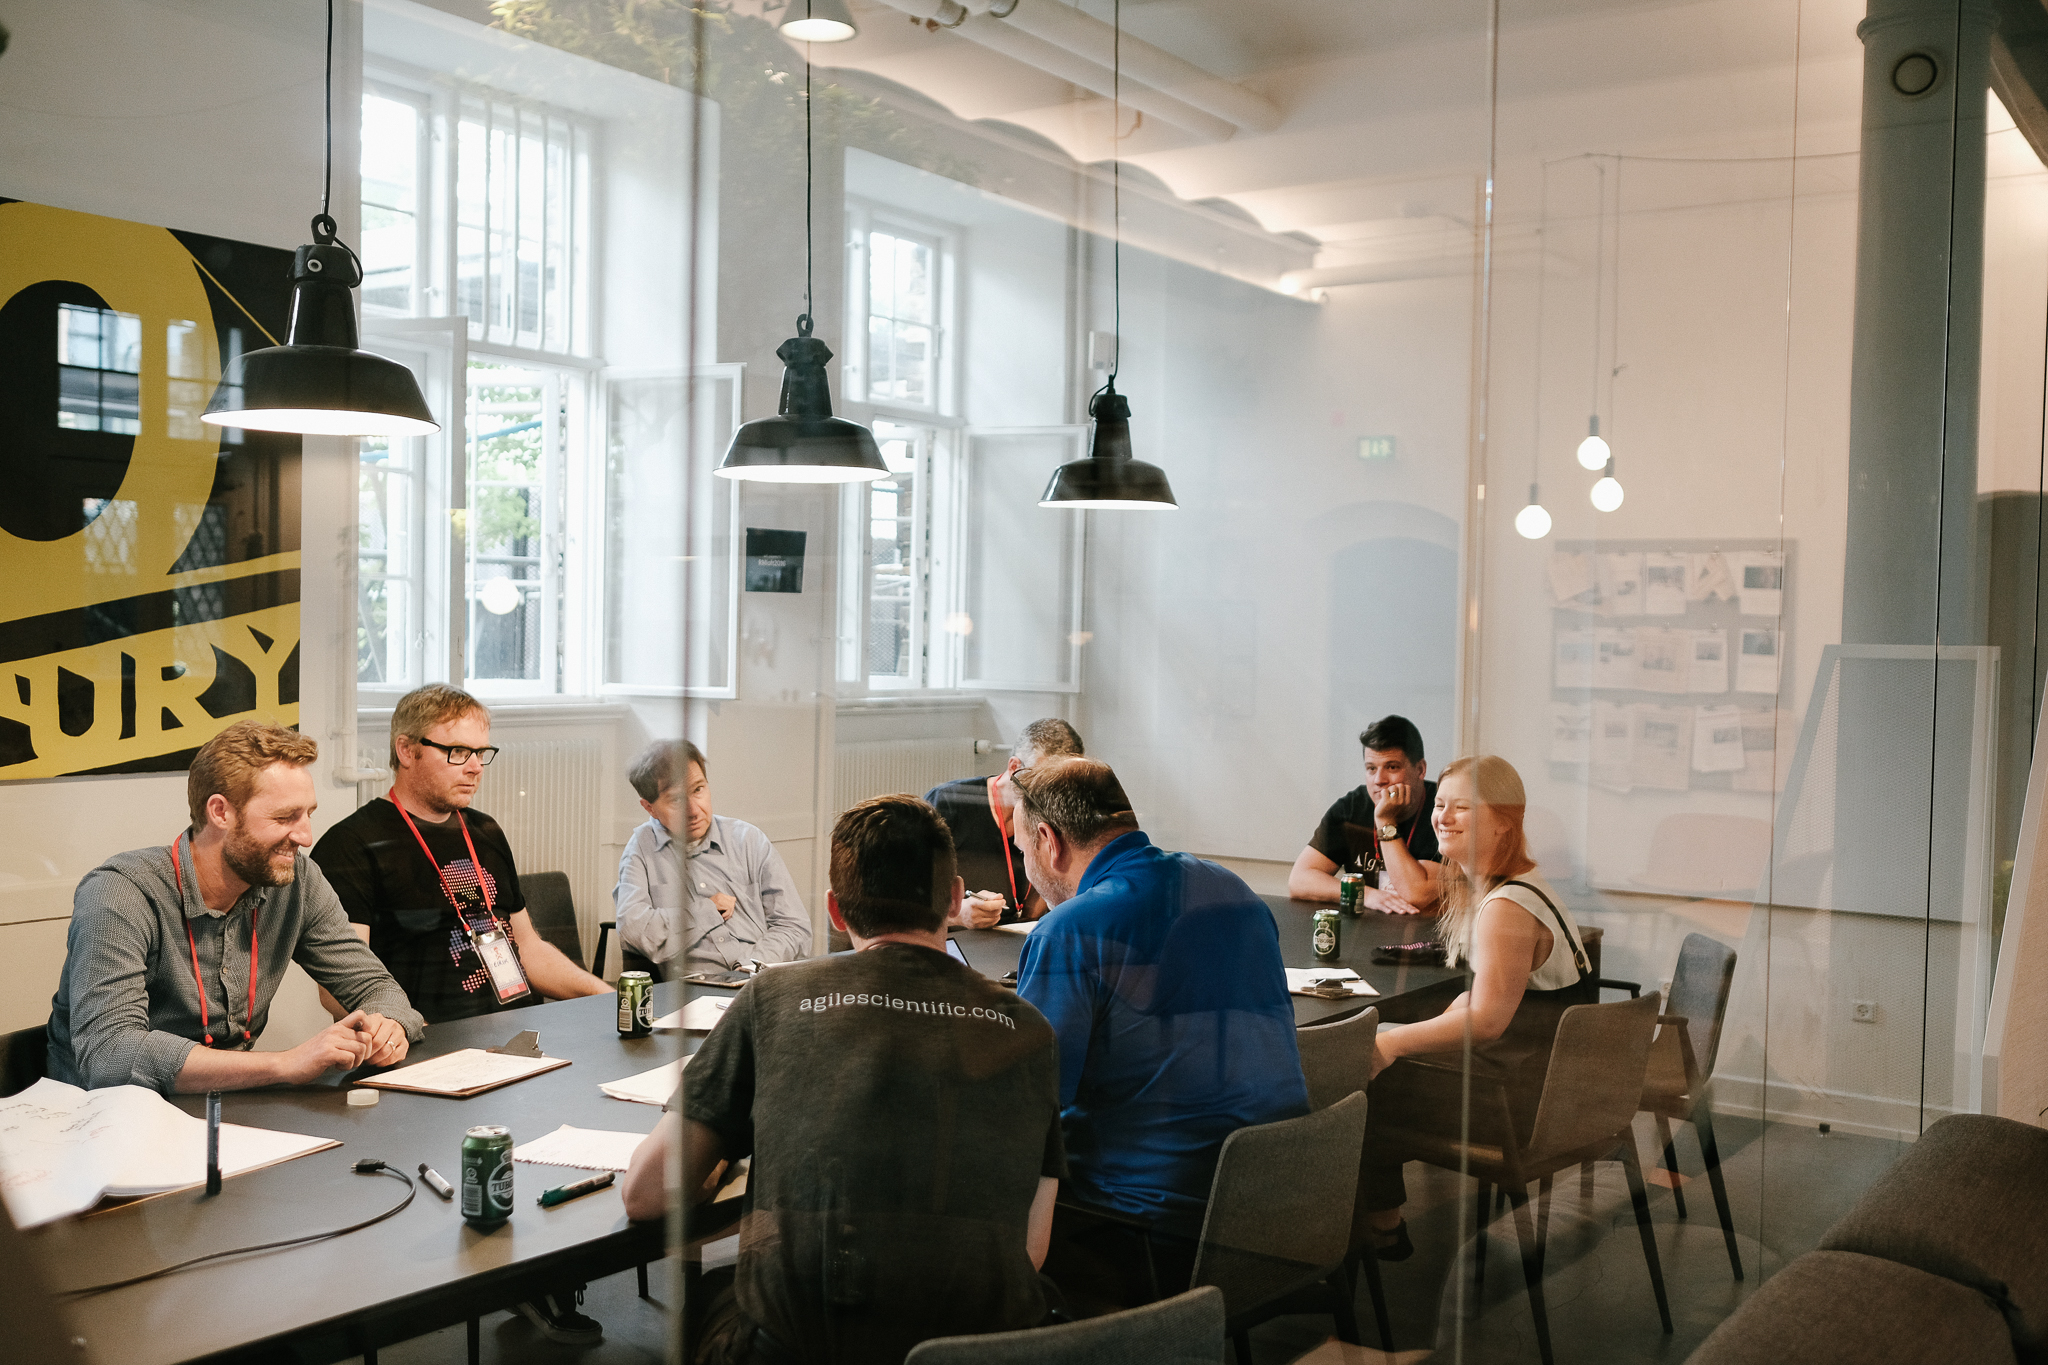
One of the solution sketches is shown here (right), for the Revamp the geoscience curriculum problem. They discussed the problem animatedly for an hour.
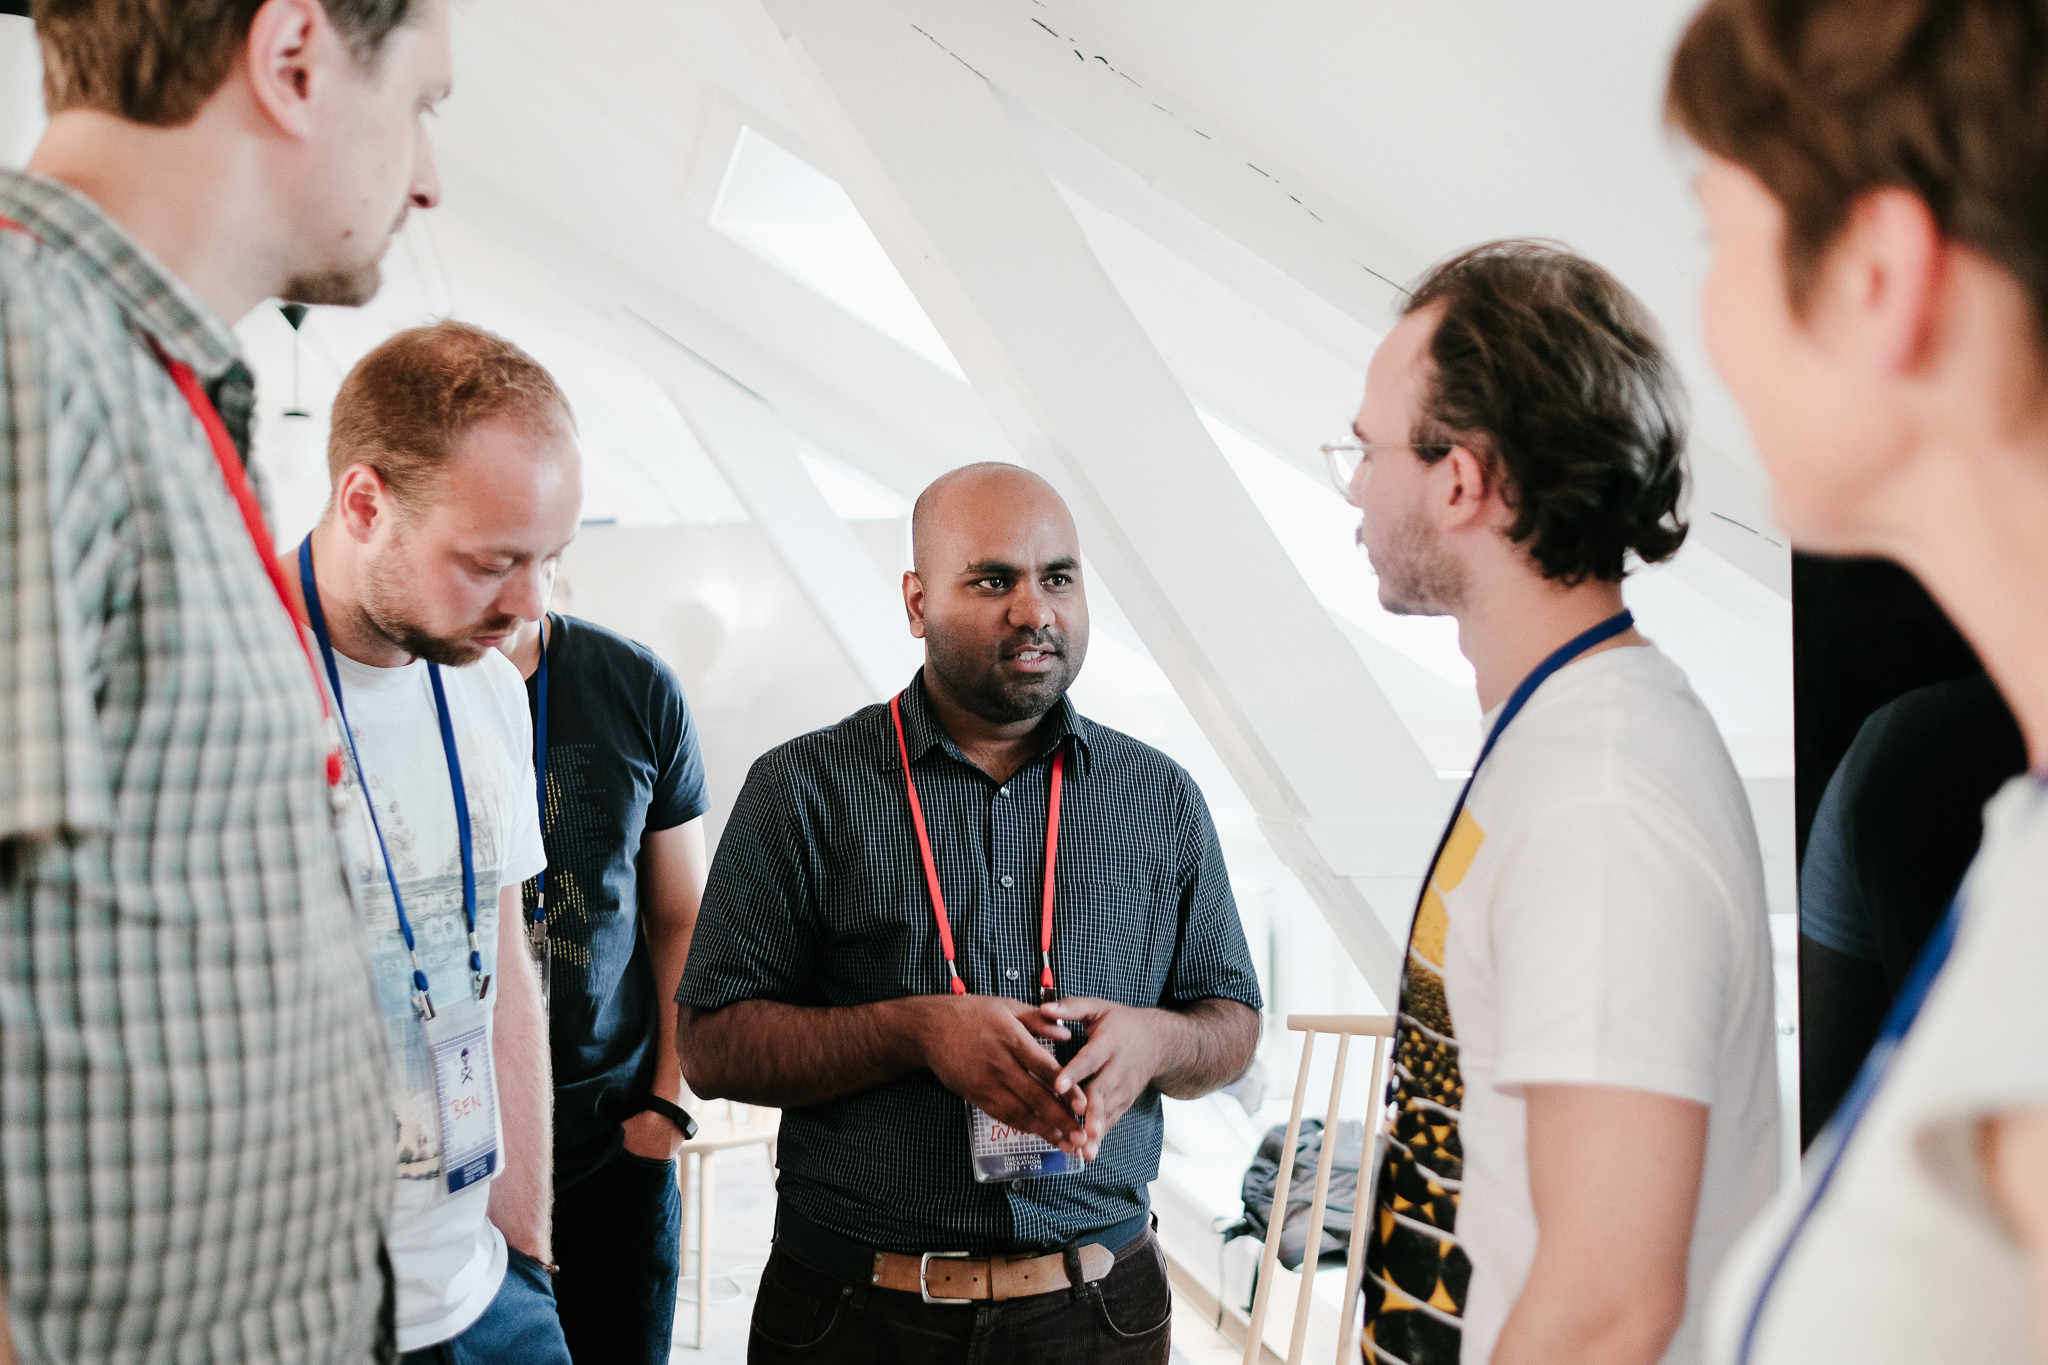
This team included — among others — an academic geostatistician, an industry geostatistician, a PhD student, a DOE geophysicist, an SEC geologist, and a young machine learning brainbox. Amazingly, this kind of diversity was typical of the tables.
That's it! Many thanks to Evan Bianco for the labour of capturing and digitizing the data from the event. Thanks also to AAPG for the great photos, and for granting them an open license. And thank you to my co-chairs Brendon Hall and Yan Zaretskiy of Enthought, and all the other folks who helped make the event happen — see the Productive chaos post for details.
To dig deeper, look for the complete write up in Google Docs, and the photos in Flickr.

Just a reminder... if it's Python and machine learning skills you want, we're running a Summer School in downtown Houston the week of 13 August. Come along and get your hands on the latest in geocomputing methods. Suitable for beginners or intermediate programmers.
Don't miss out! Find out more or register now.


 Except where noted, this content is licensed