Visualize this!

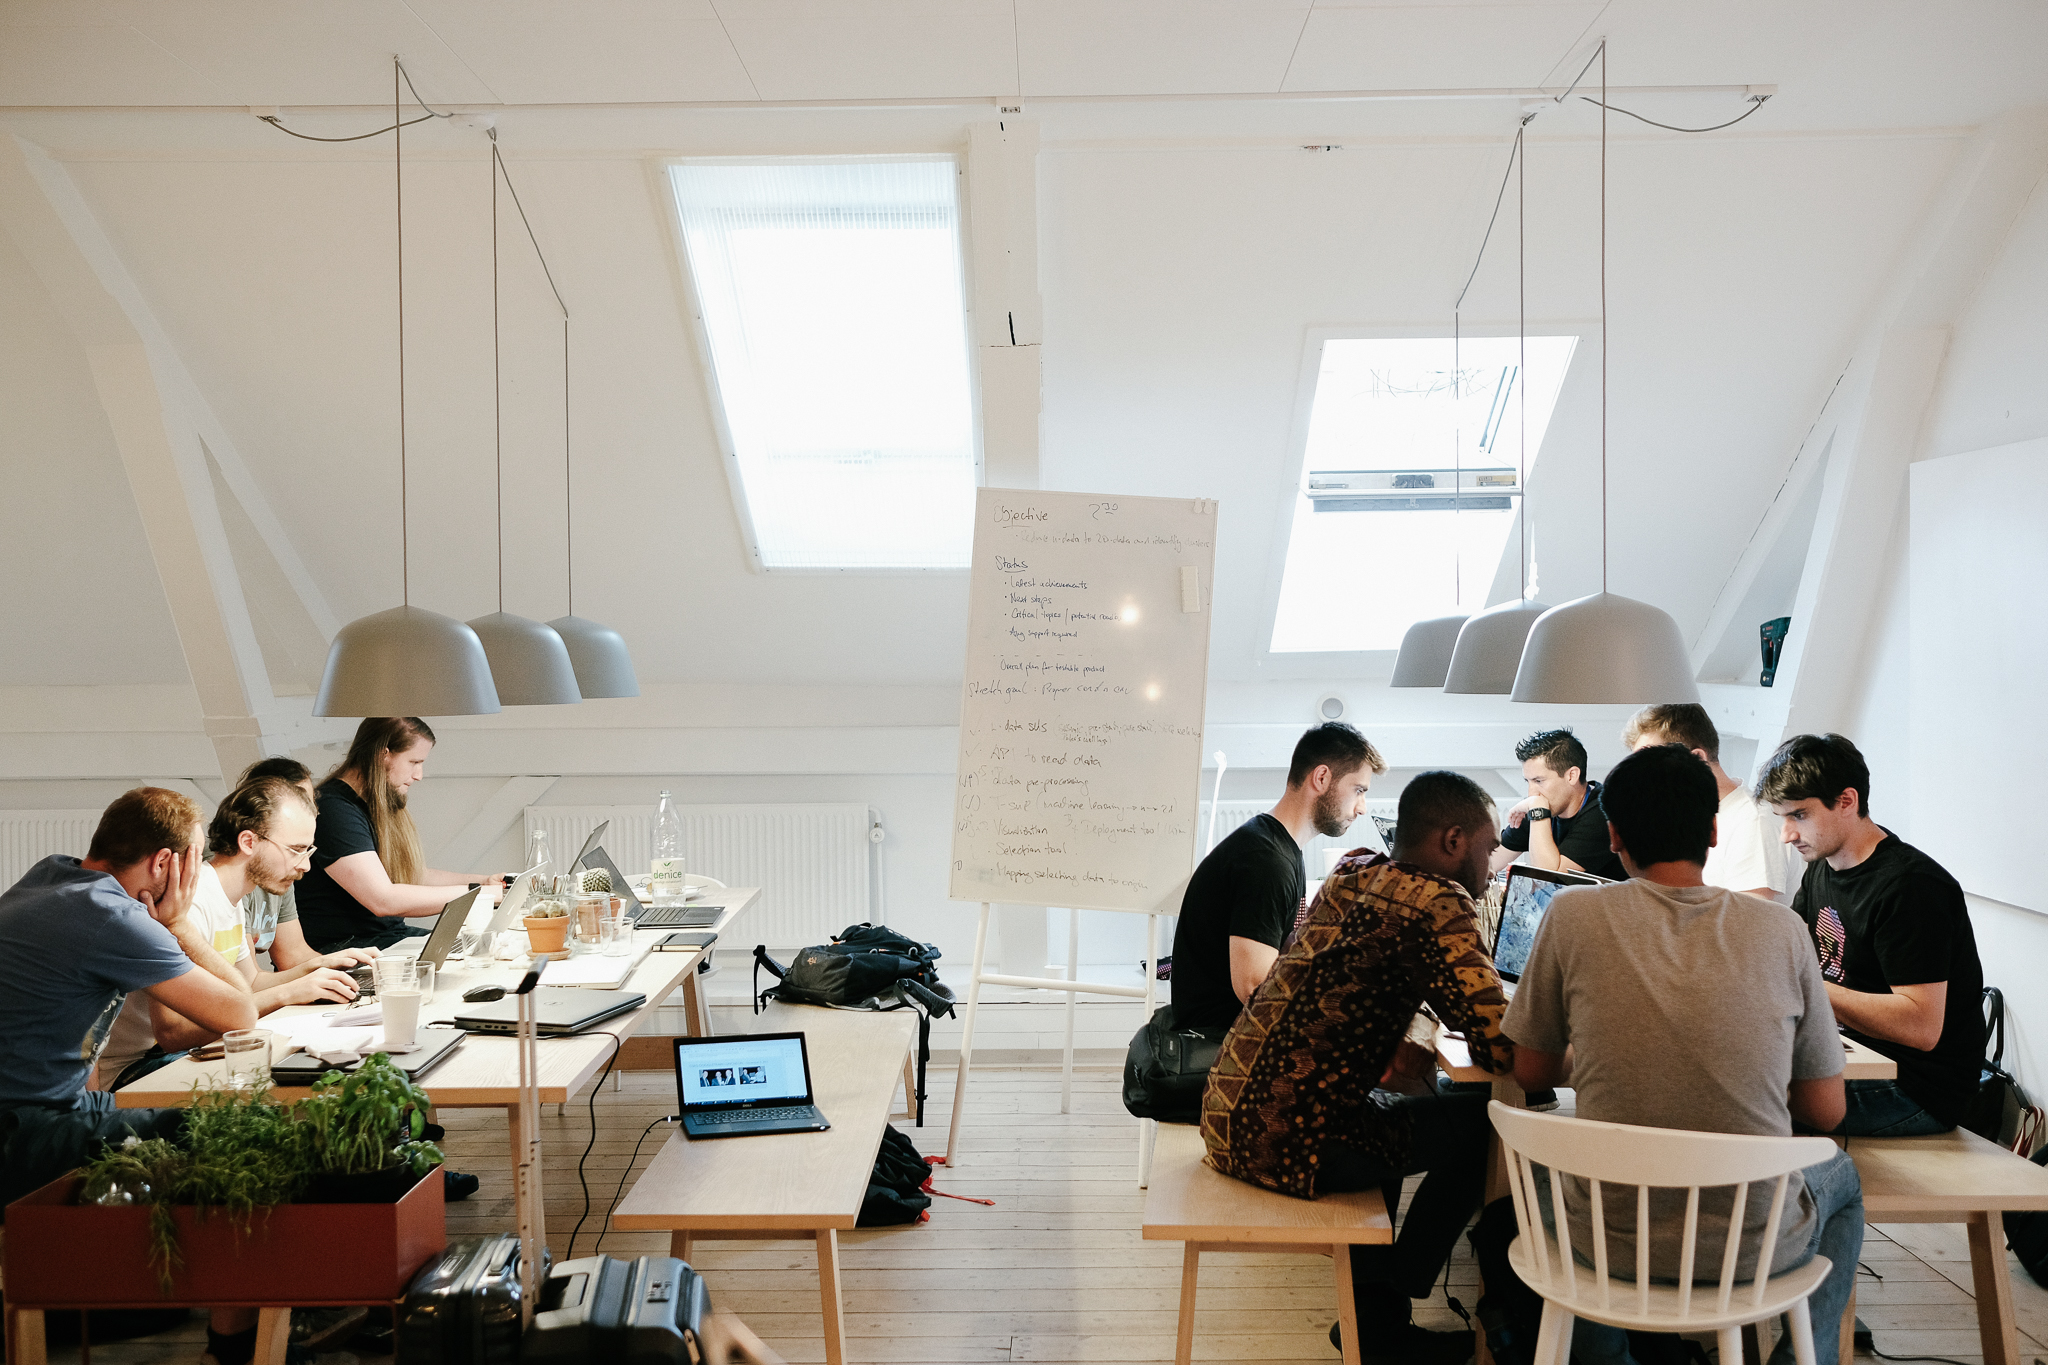
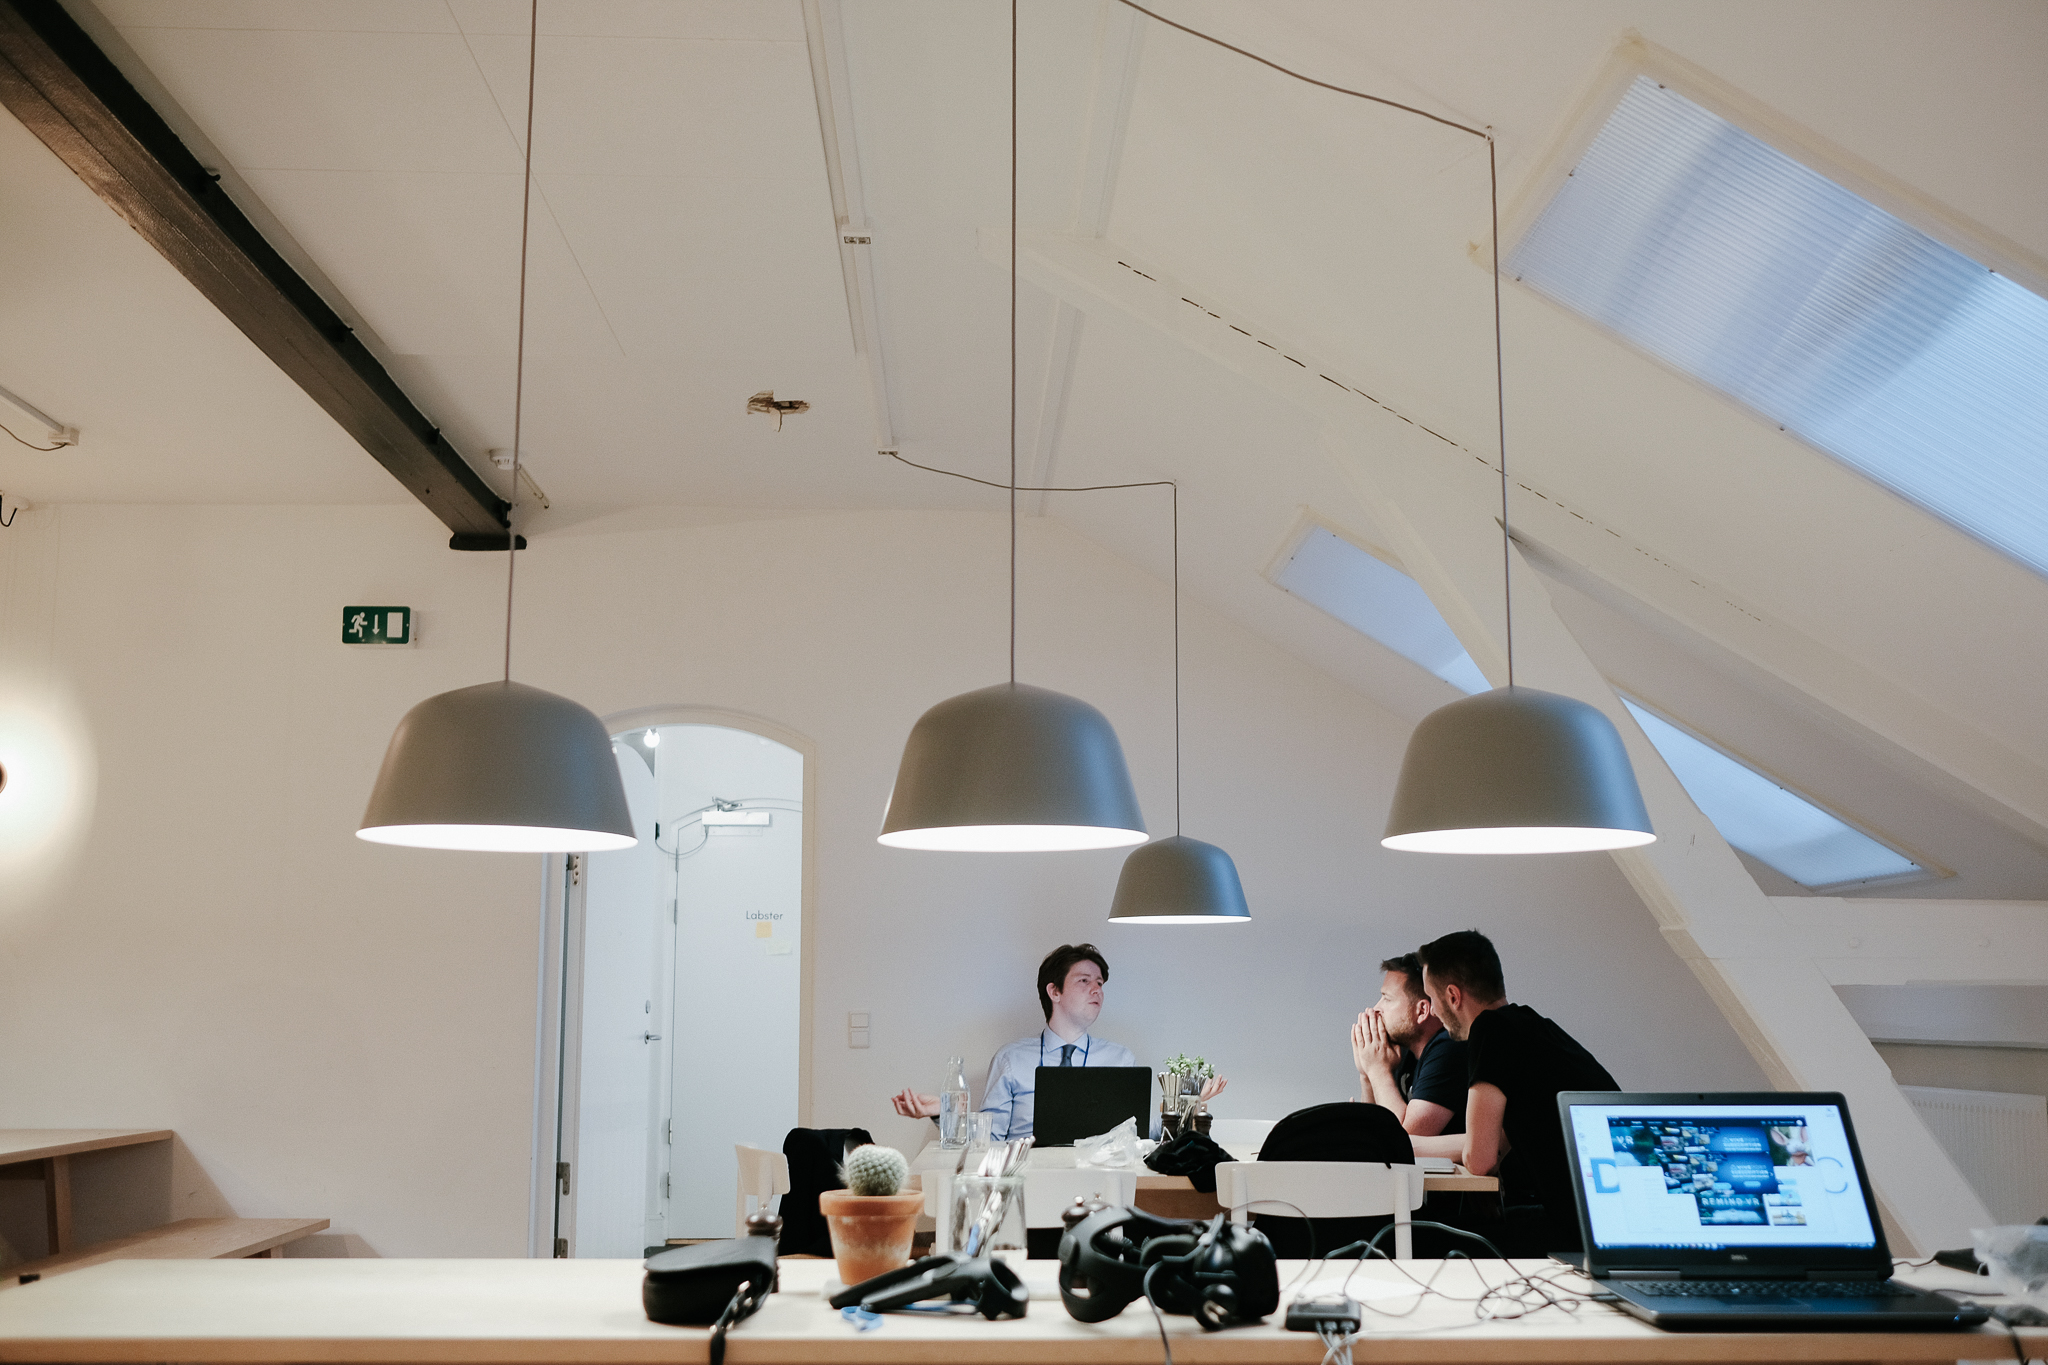
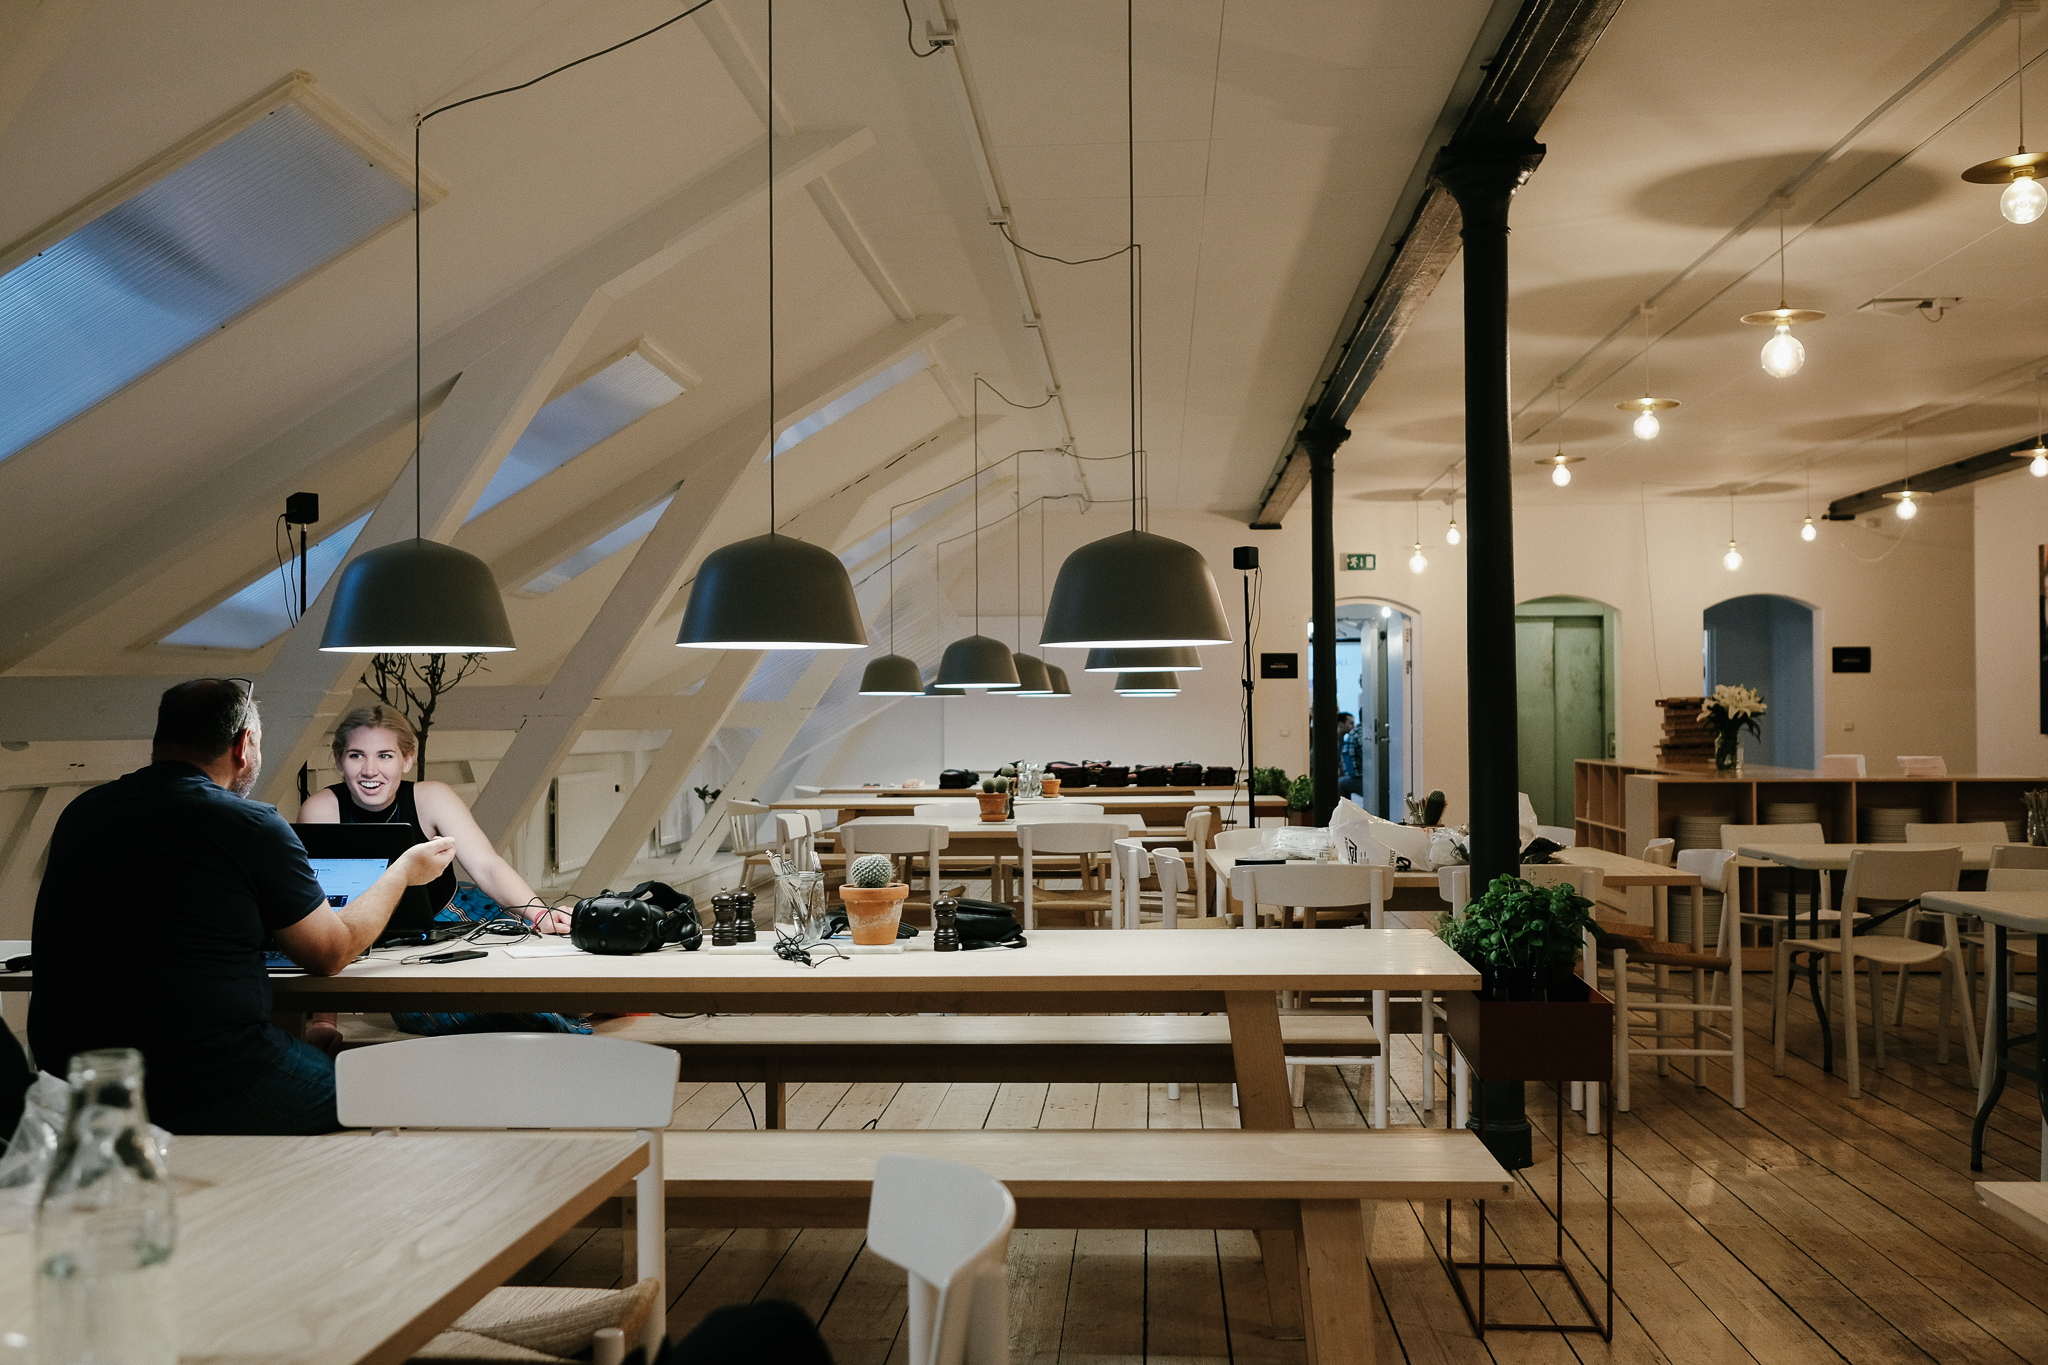
The Copenhagen edition of the Subsurface Hackathon is over! For three days during the warmest June in Denmark for over 100 years, 63 geoscientists and programmers cooked up hot code in the Rainmaking Loft, one of the coolest, and warmest, coworking spaces you've ever seen. As always, every one of the participants brought their A game, and the weekend flew by in a blur of creativity, coffee, and collaboration. And croissants.

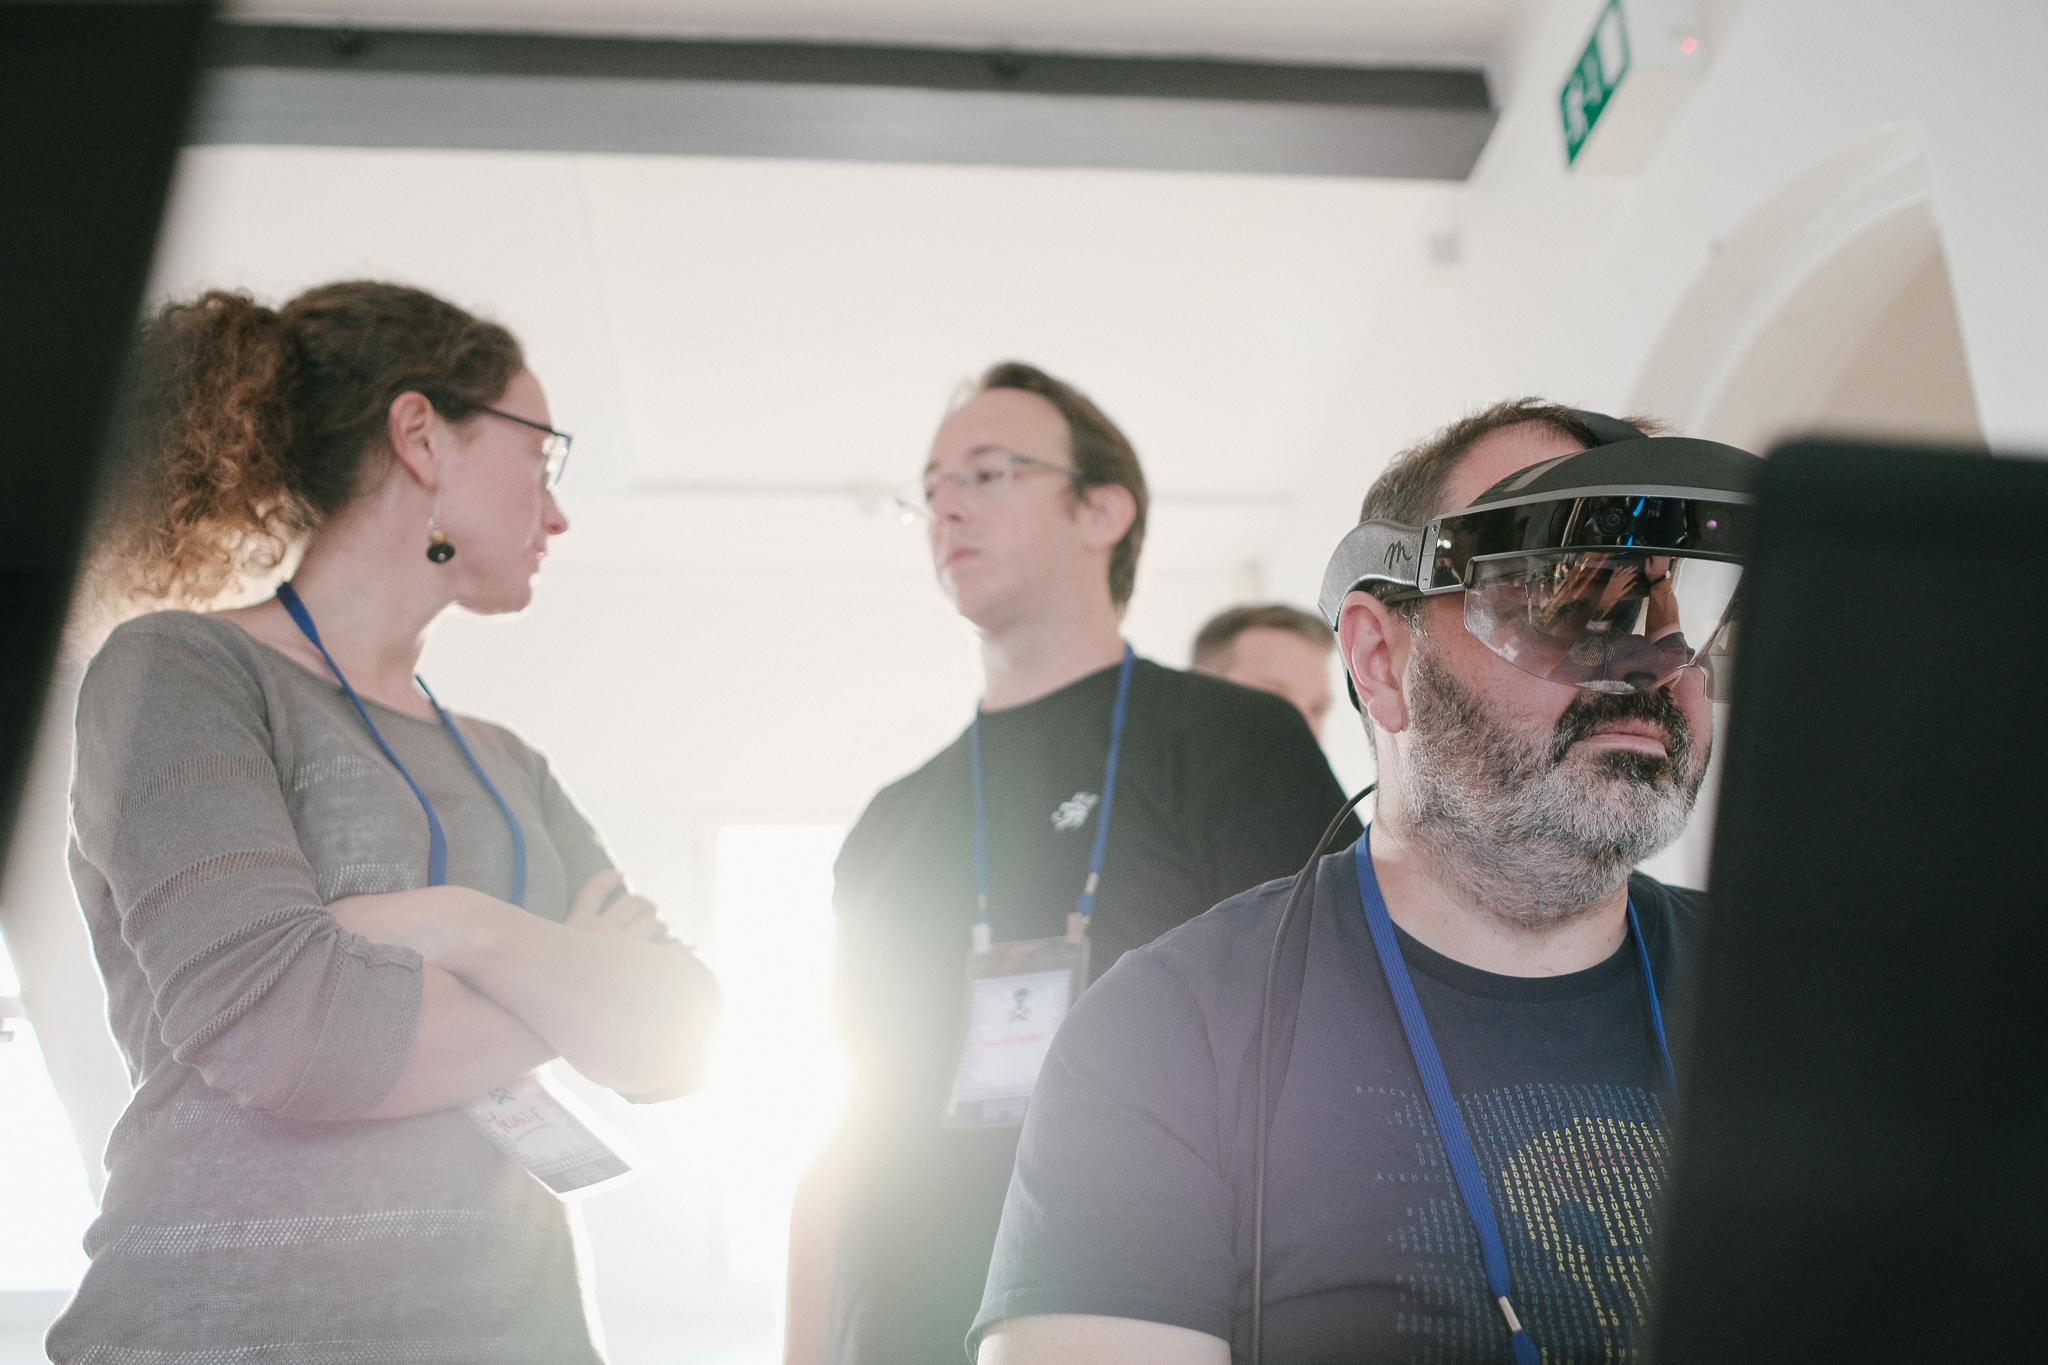
Pierre enjoying the Meta AR headset that DEll EMC provided.

Pierre enjoying the Meta AR headset that DEll EMC provided.

Our sponsors have always been unusually helpful and inspiring, pushing us to get more audacious, but this year they were exceptionally engaged and proactive. Dell EMC, in the form of David and Keith, provided some fantastic tech for the teams to explore; Total supported Agile throughout the organization phase, and Wintershall kindly arranged for the event to be captured on film — something I hope to be able to share soon. See below for the full credit roll!

sponsors.png

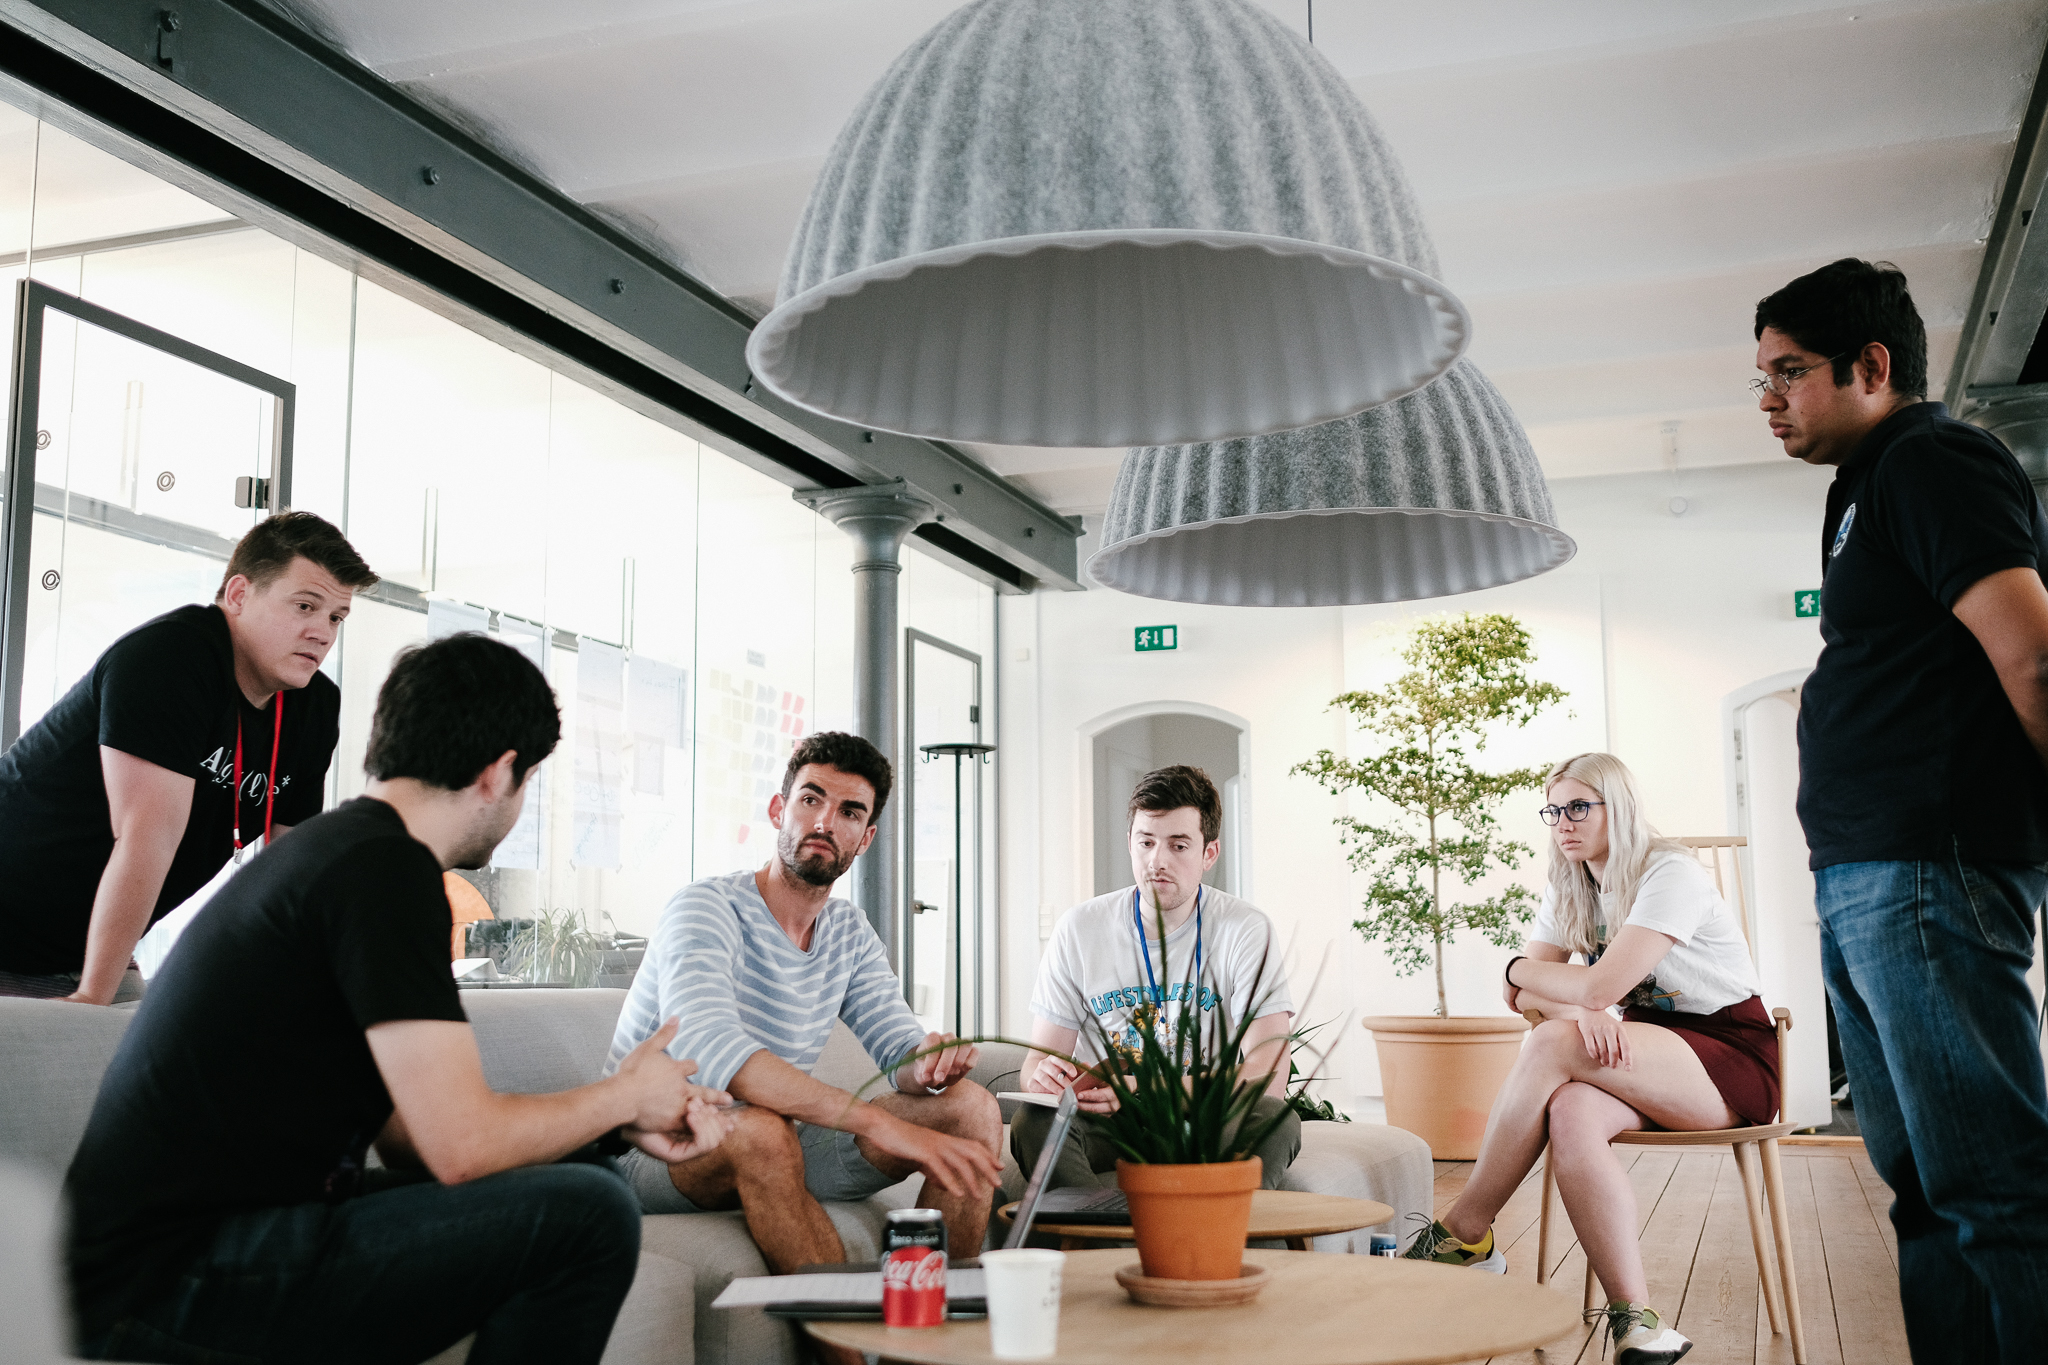
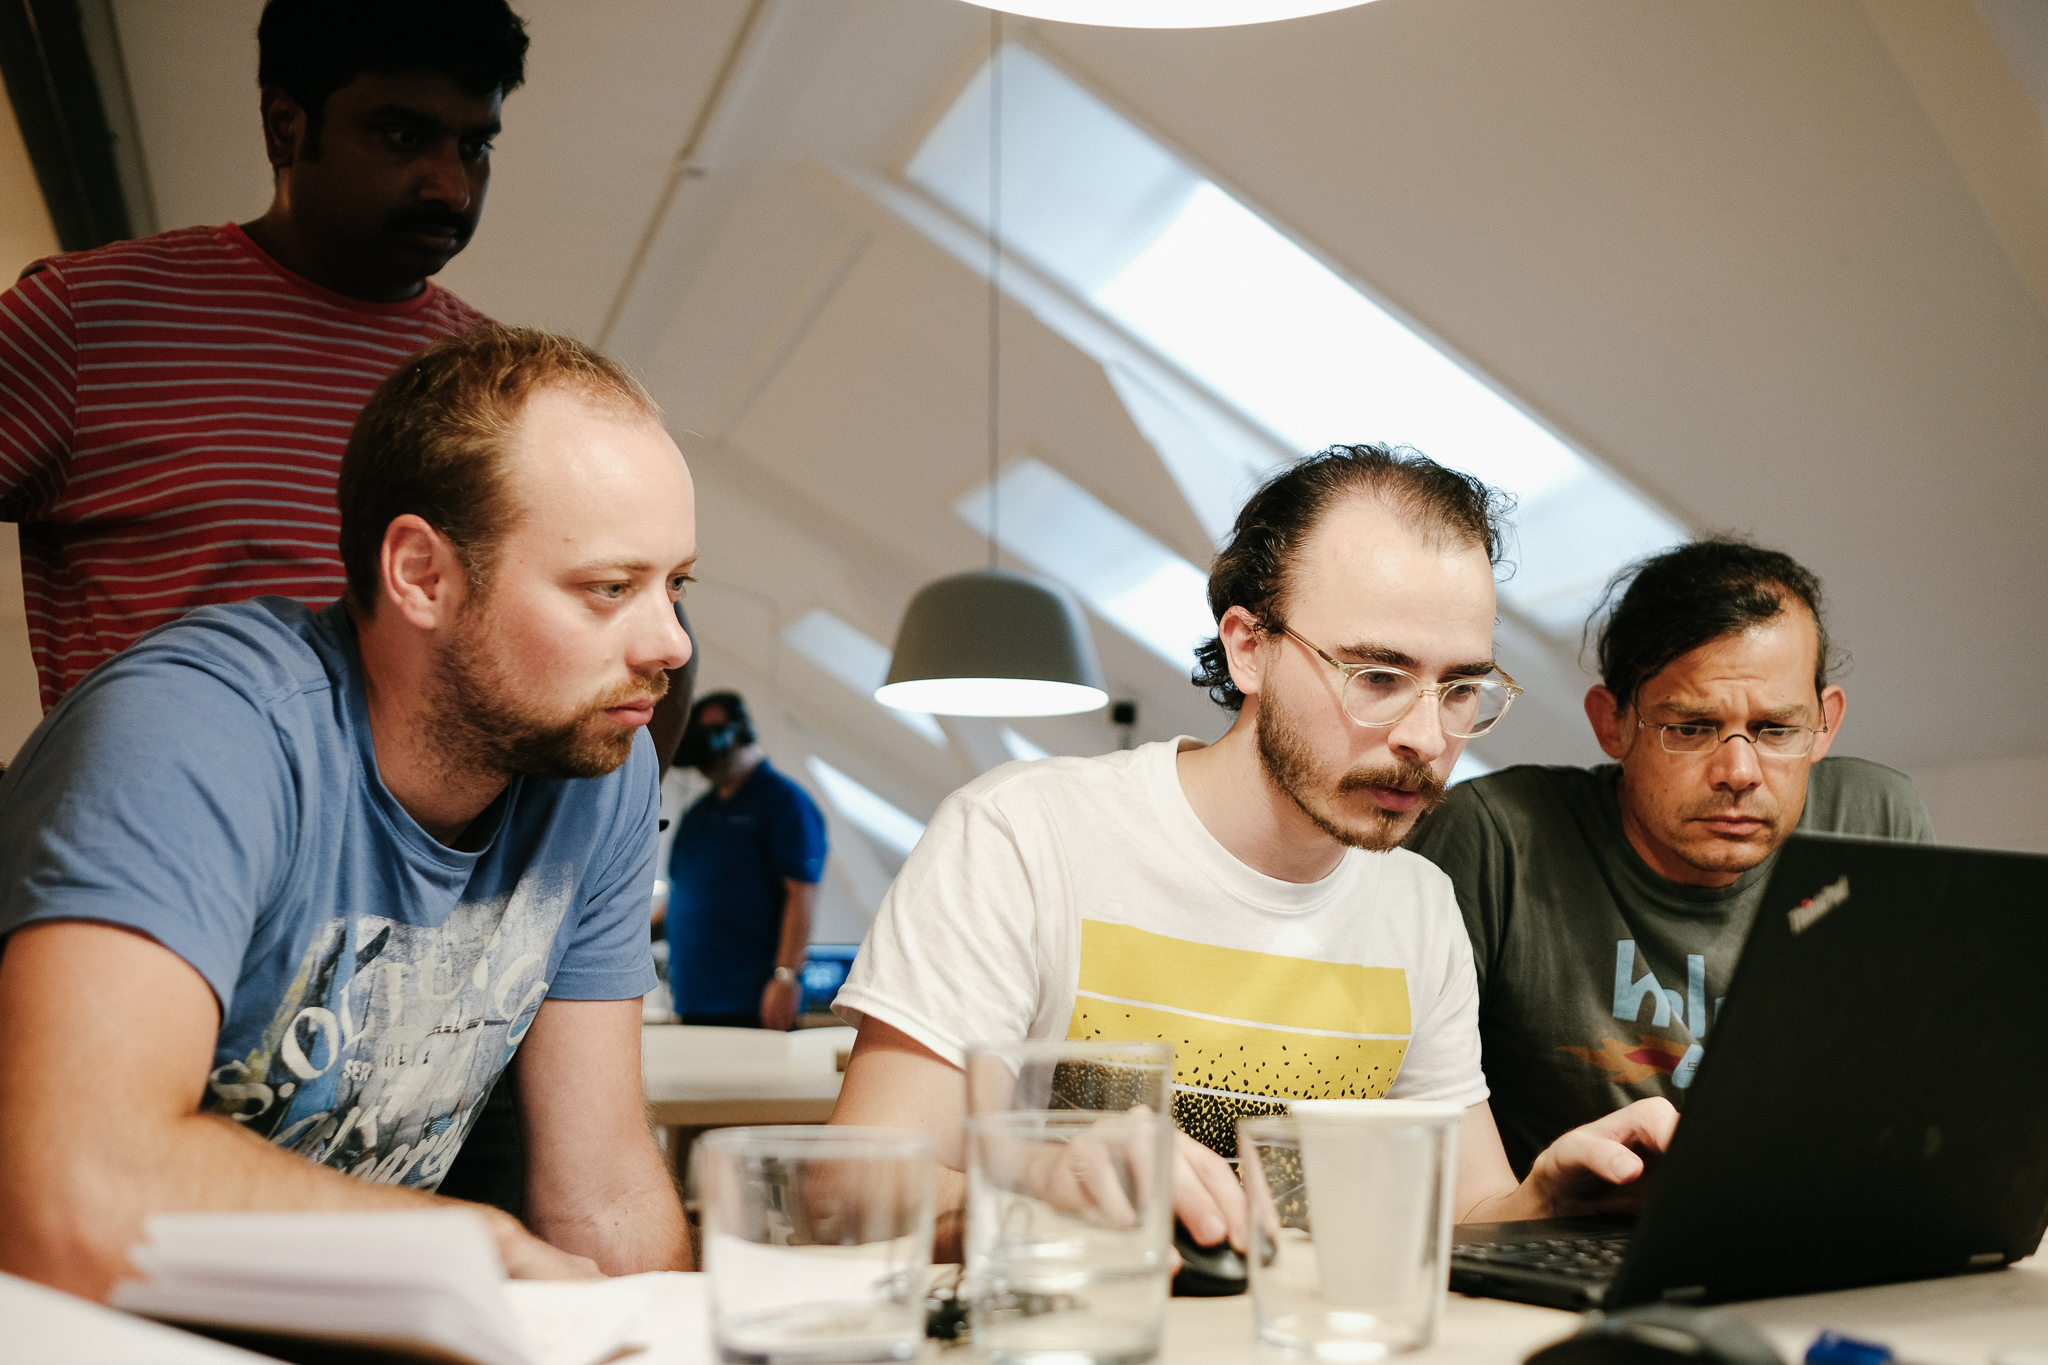
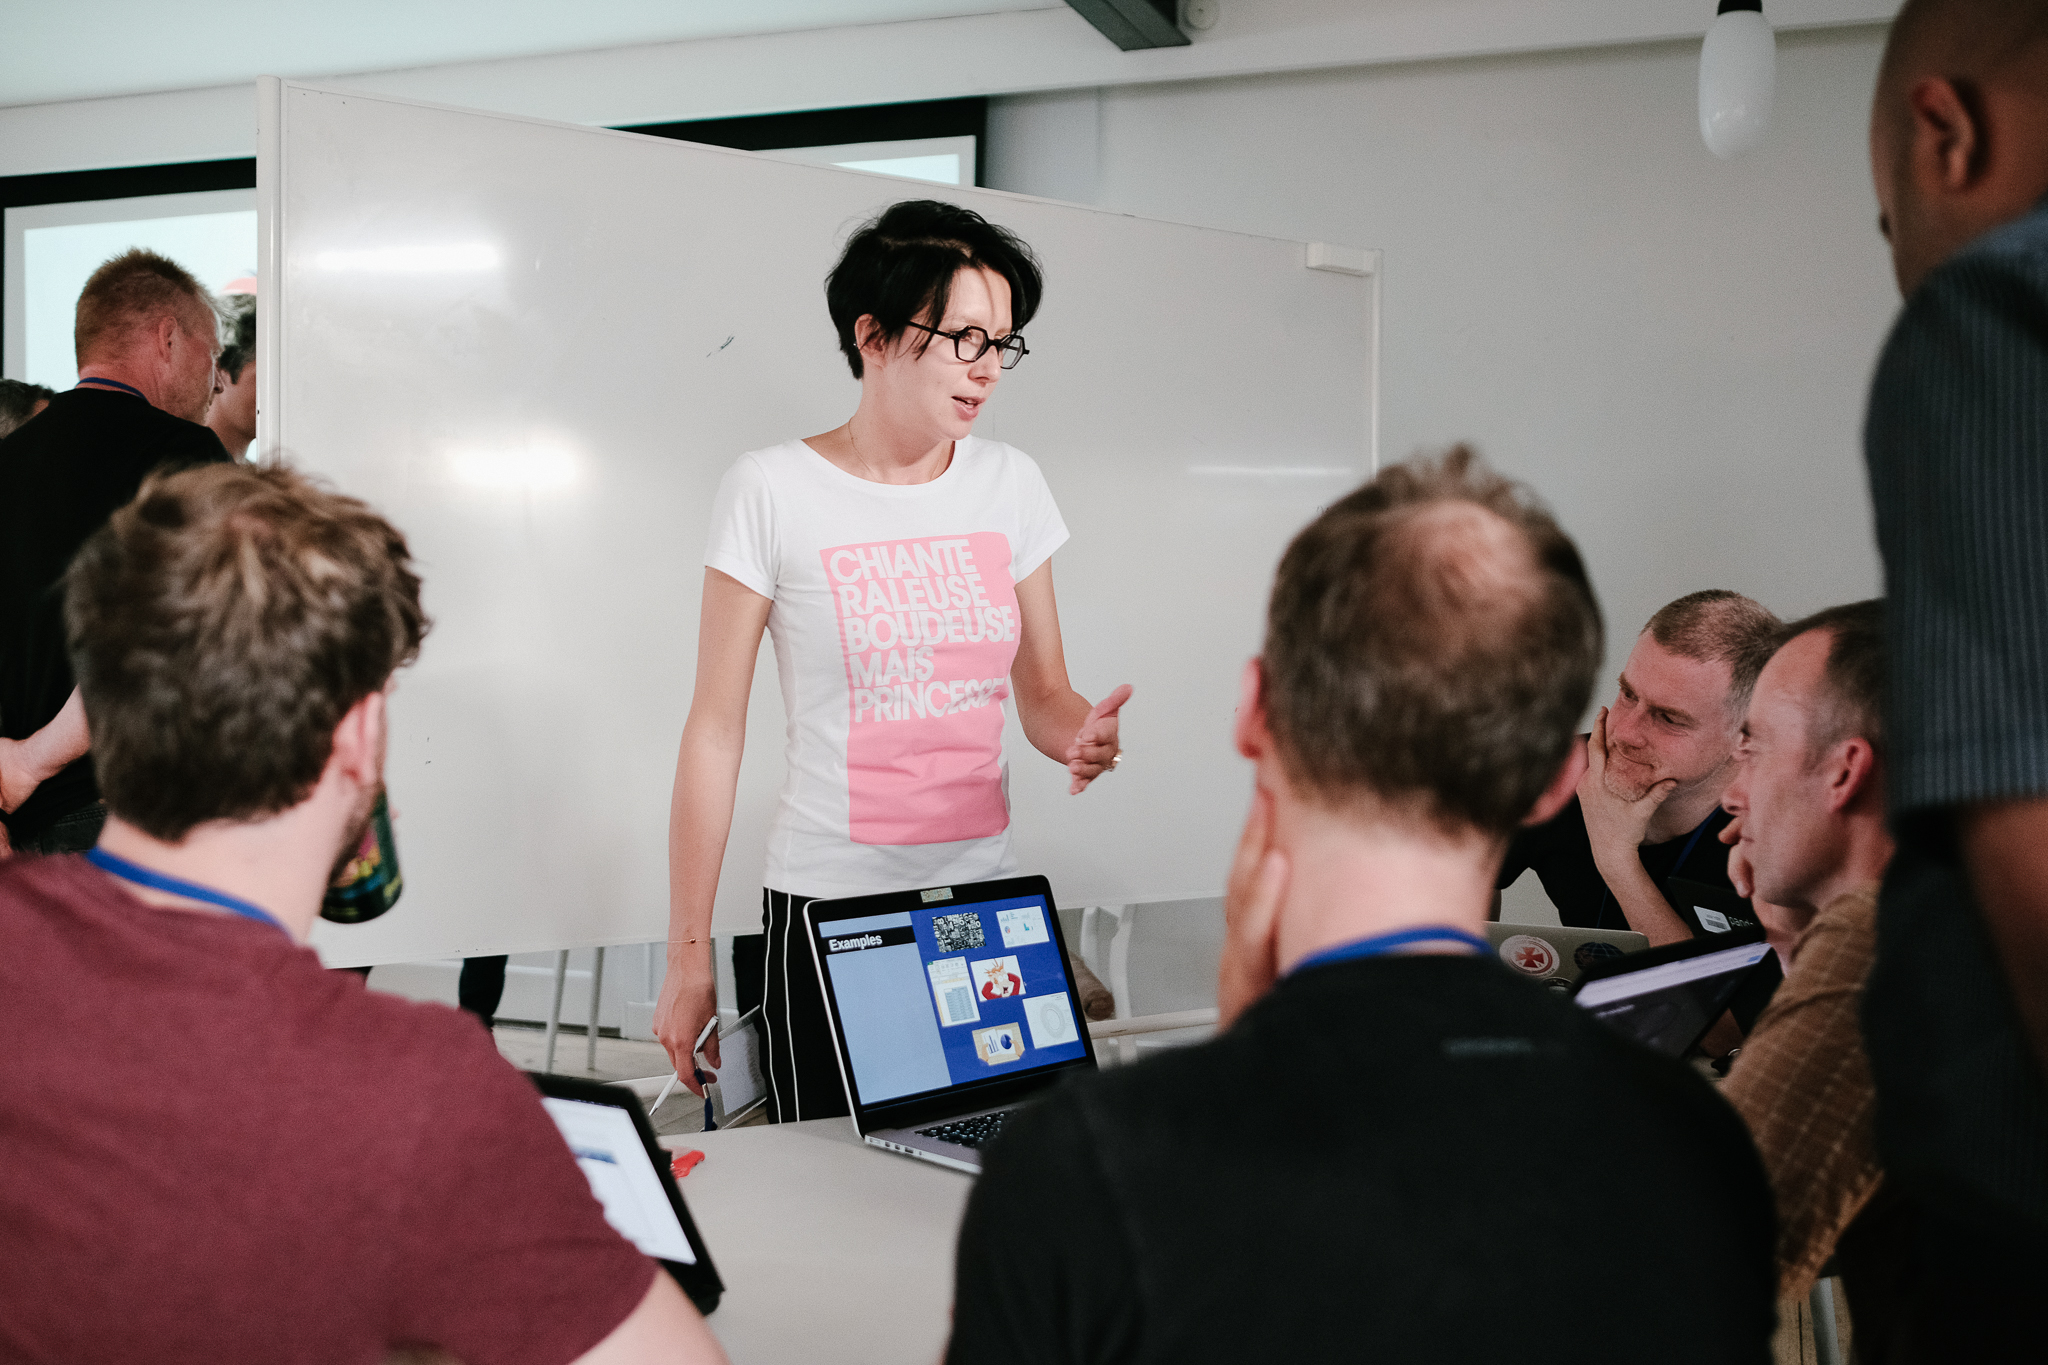
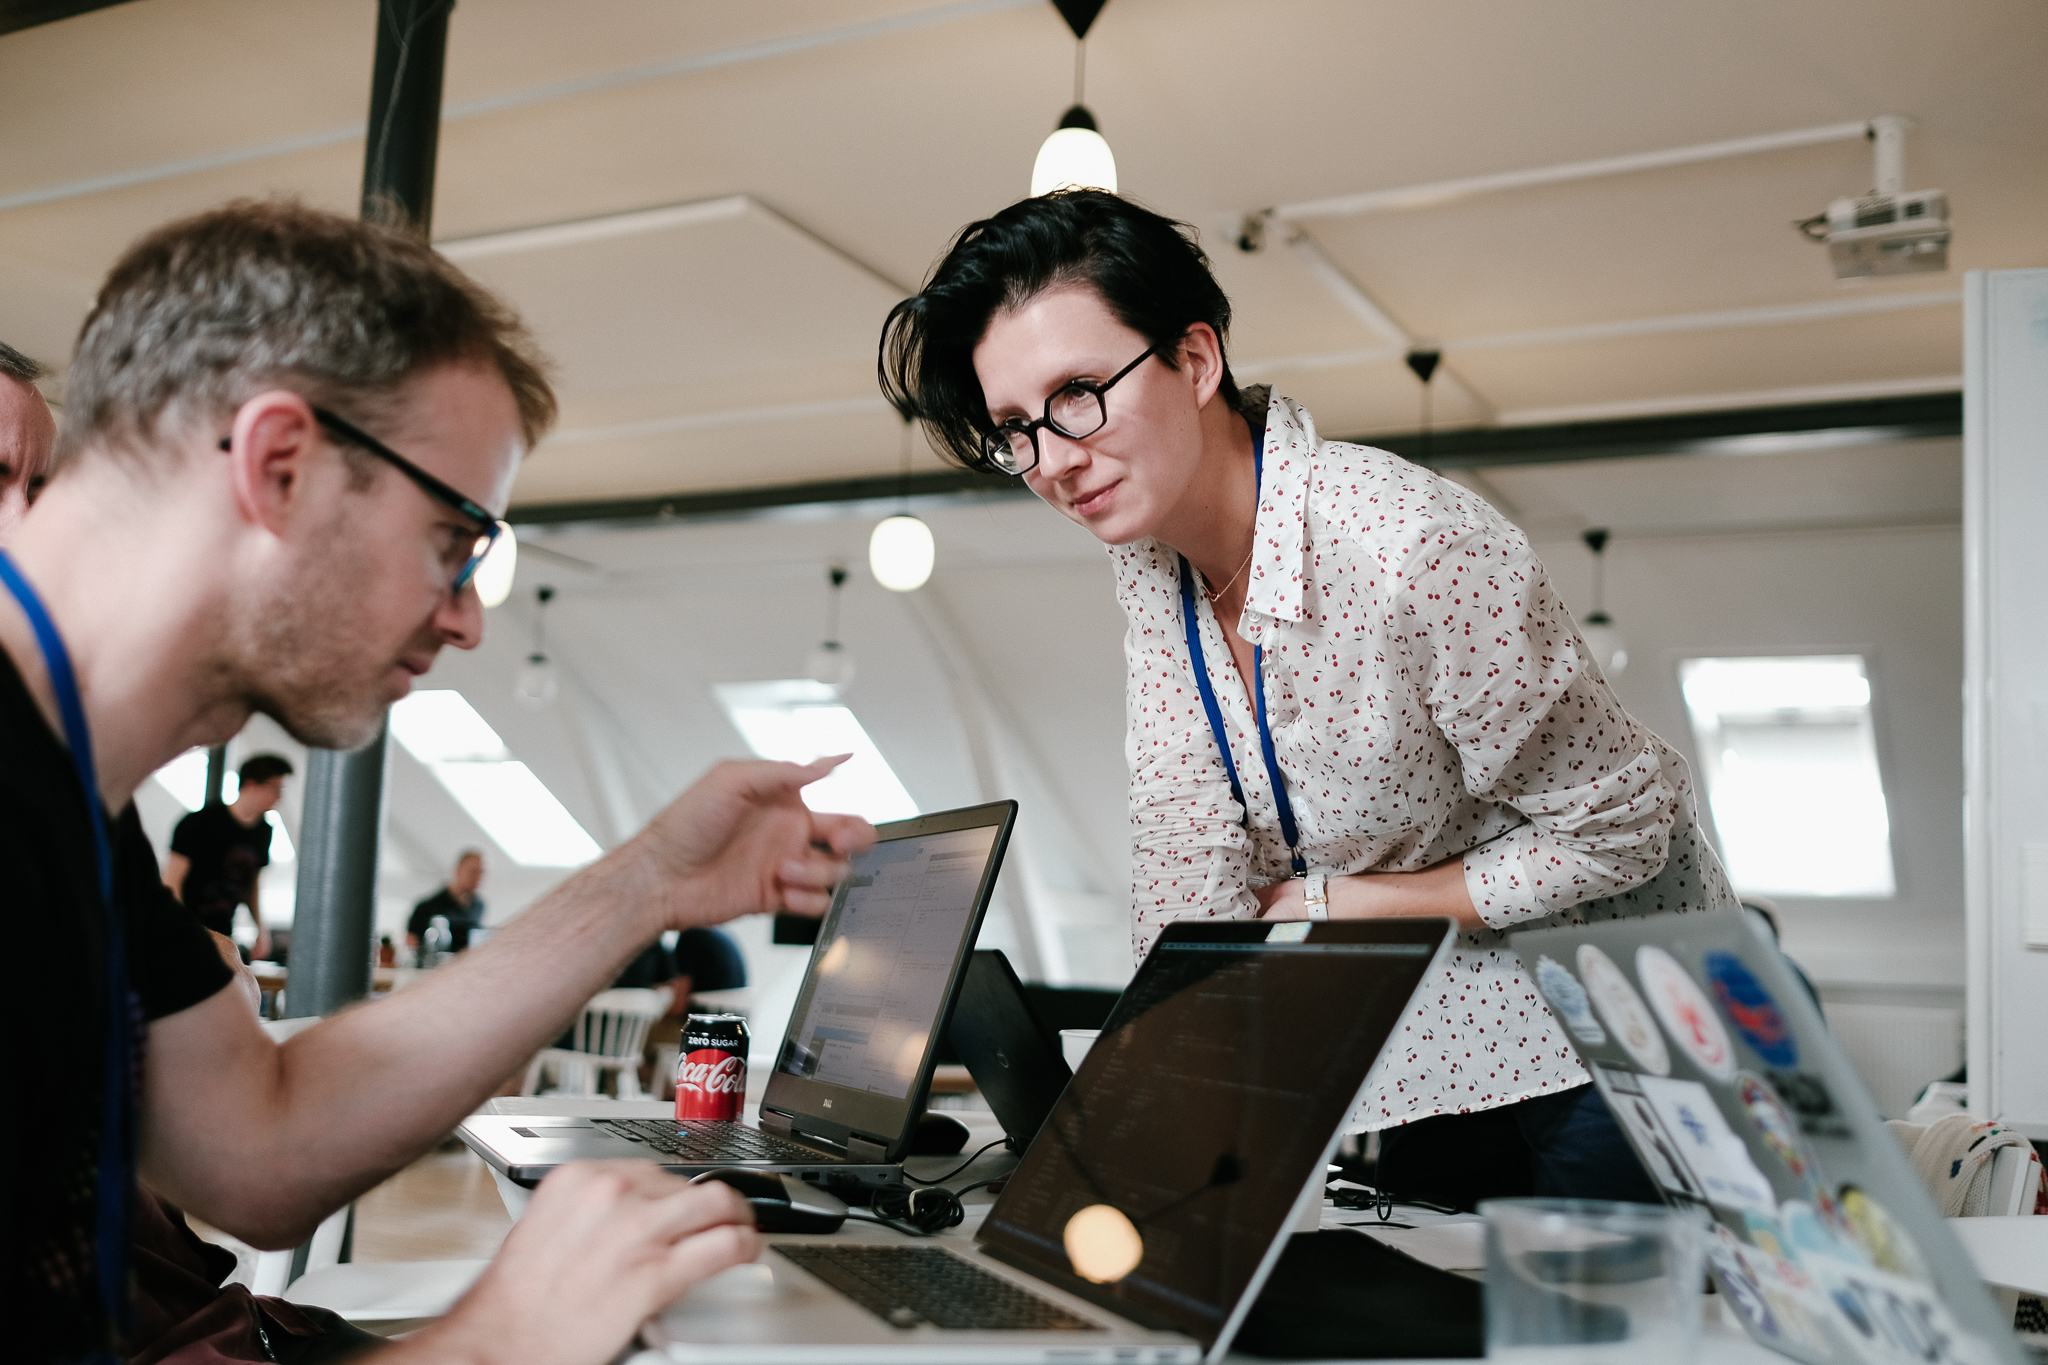
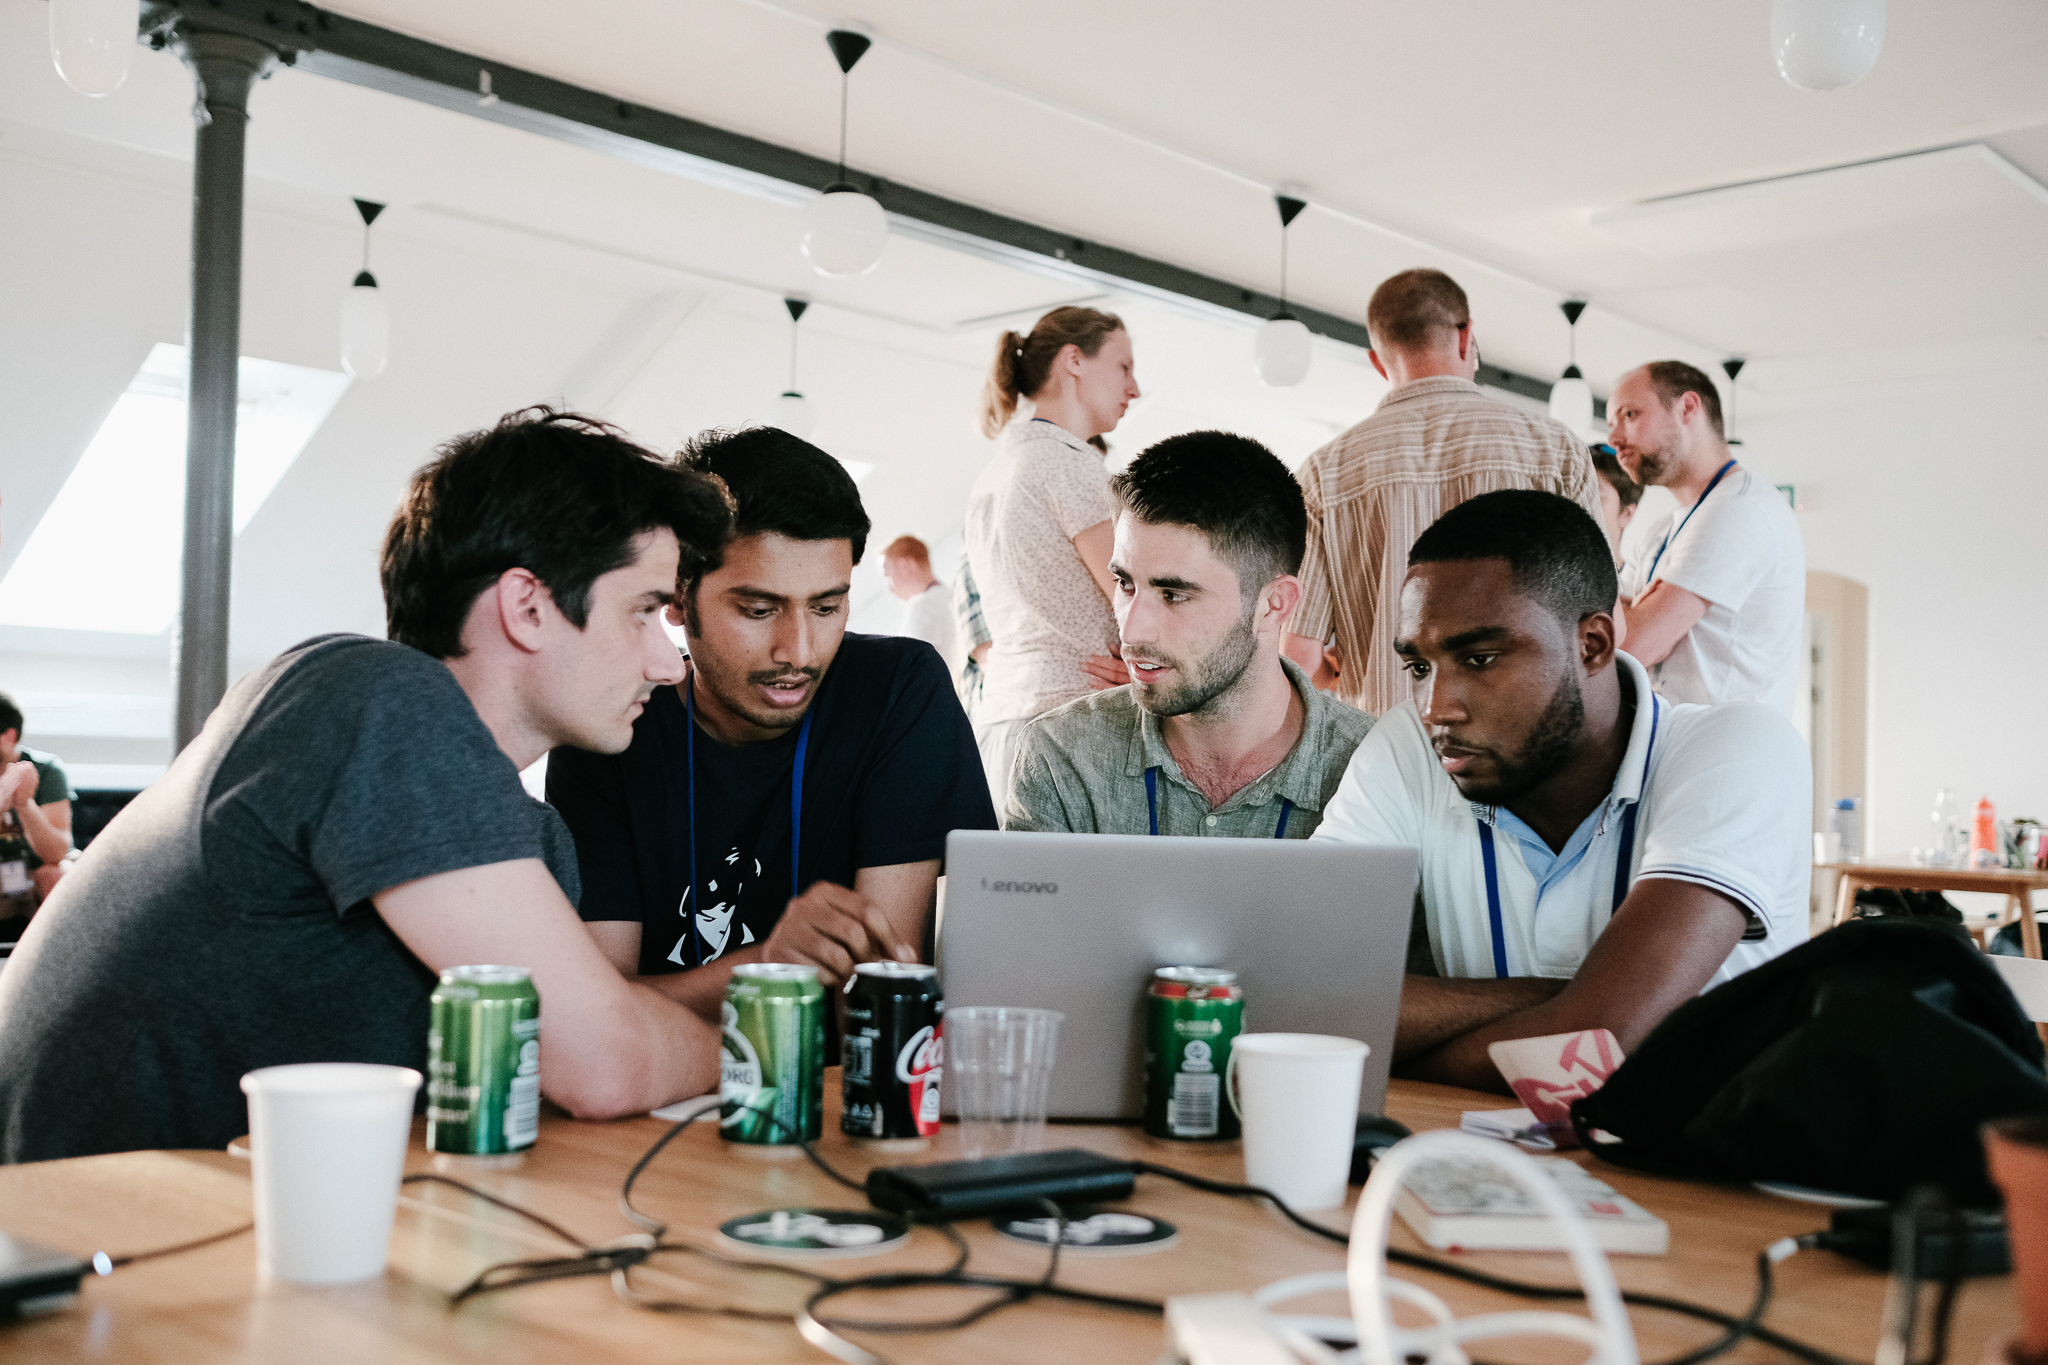
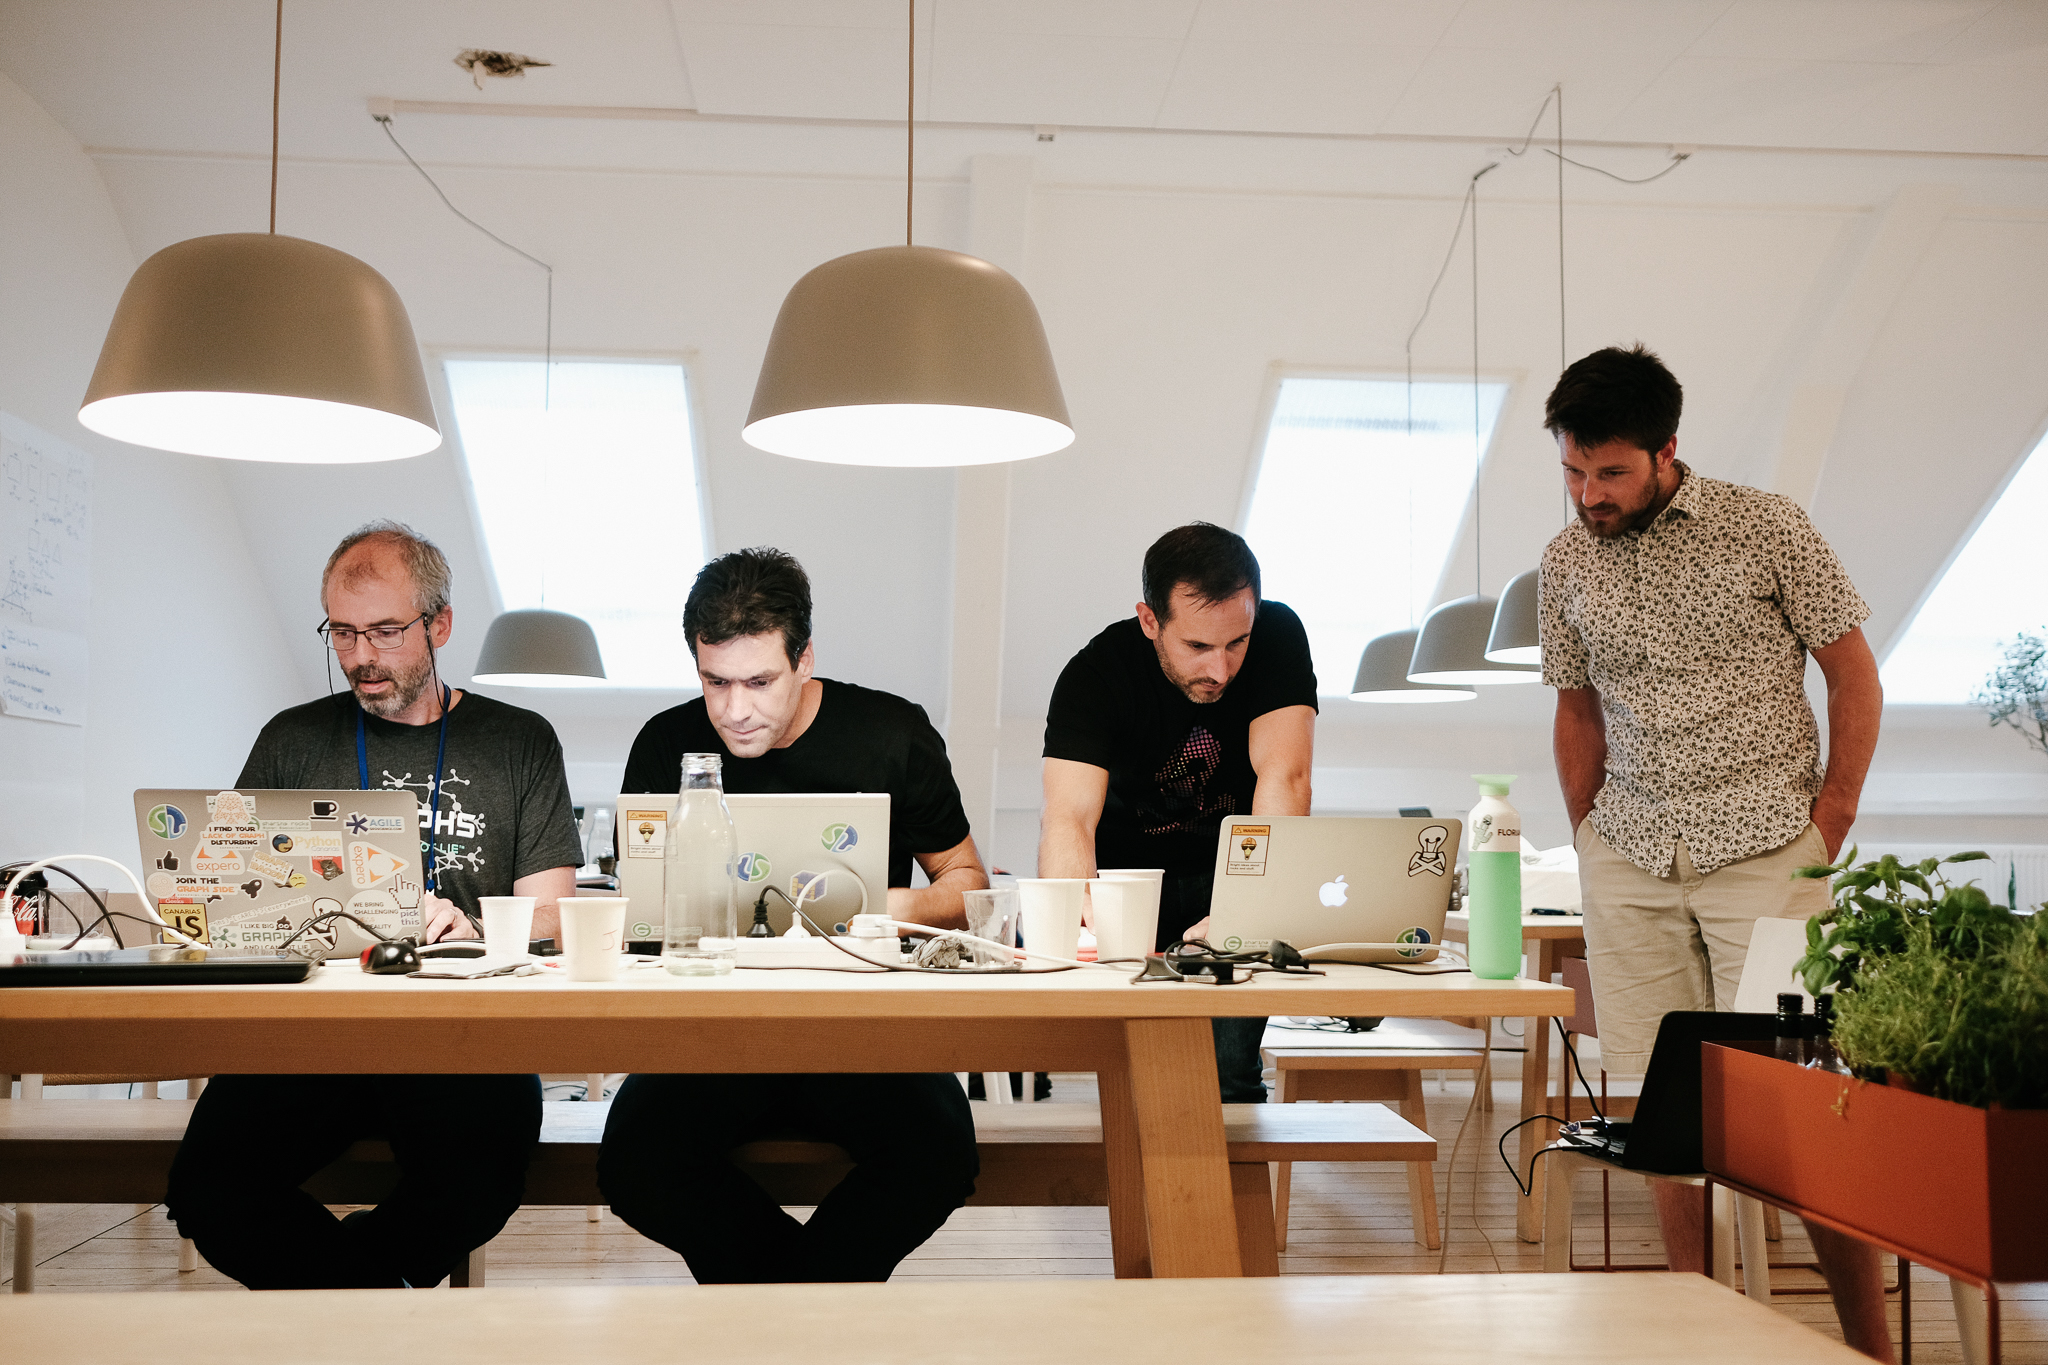
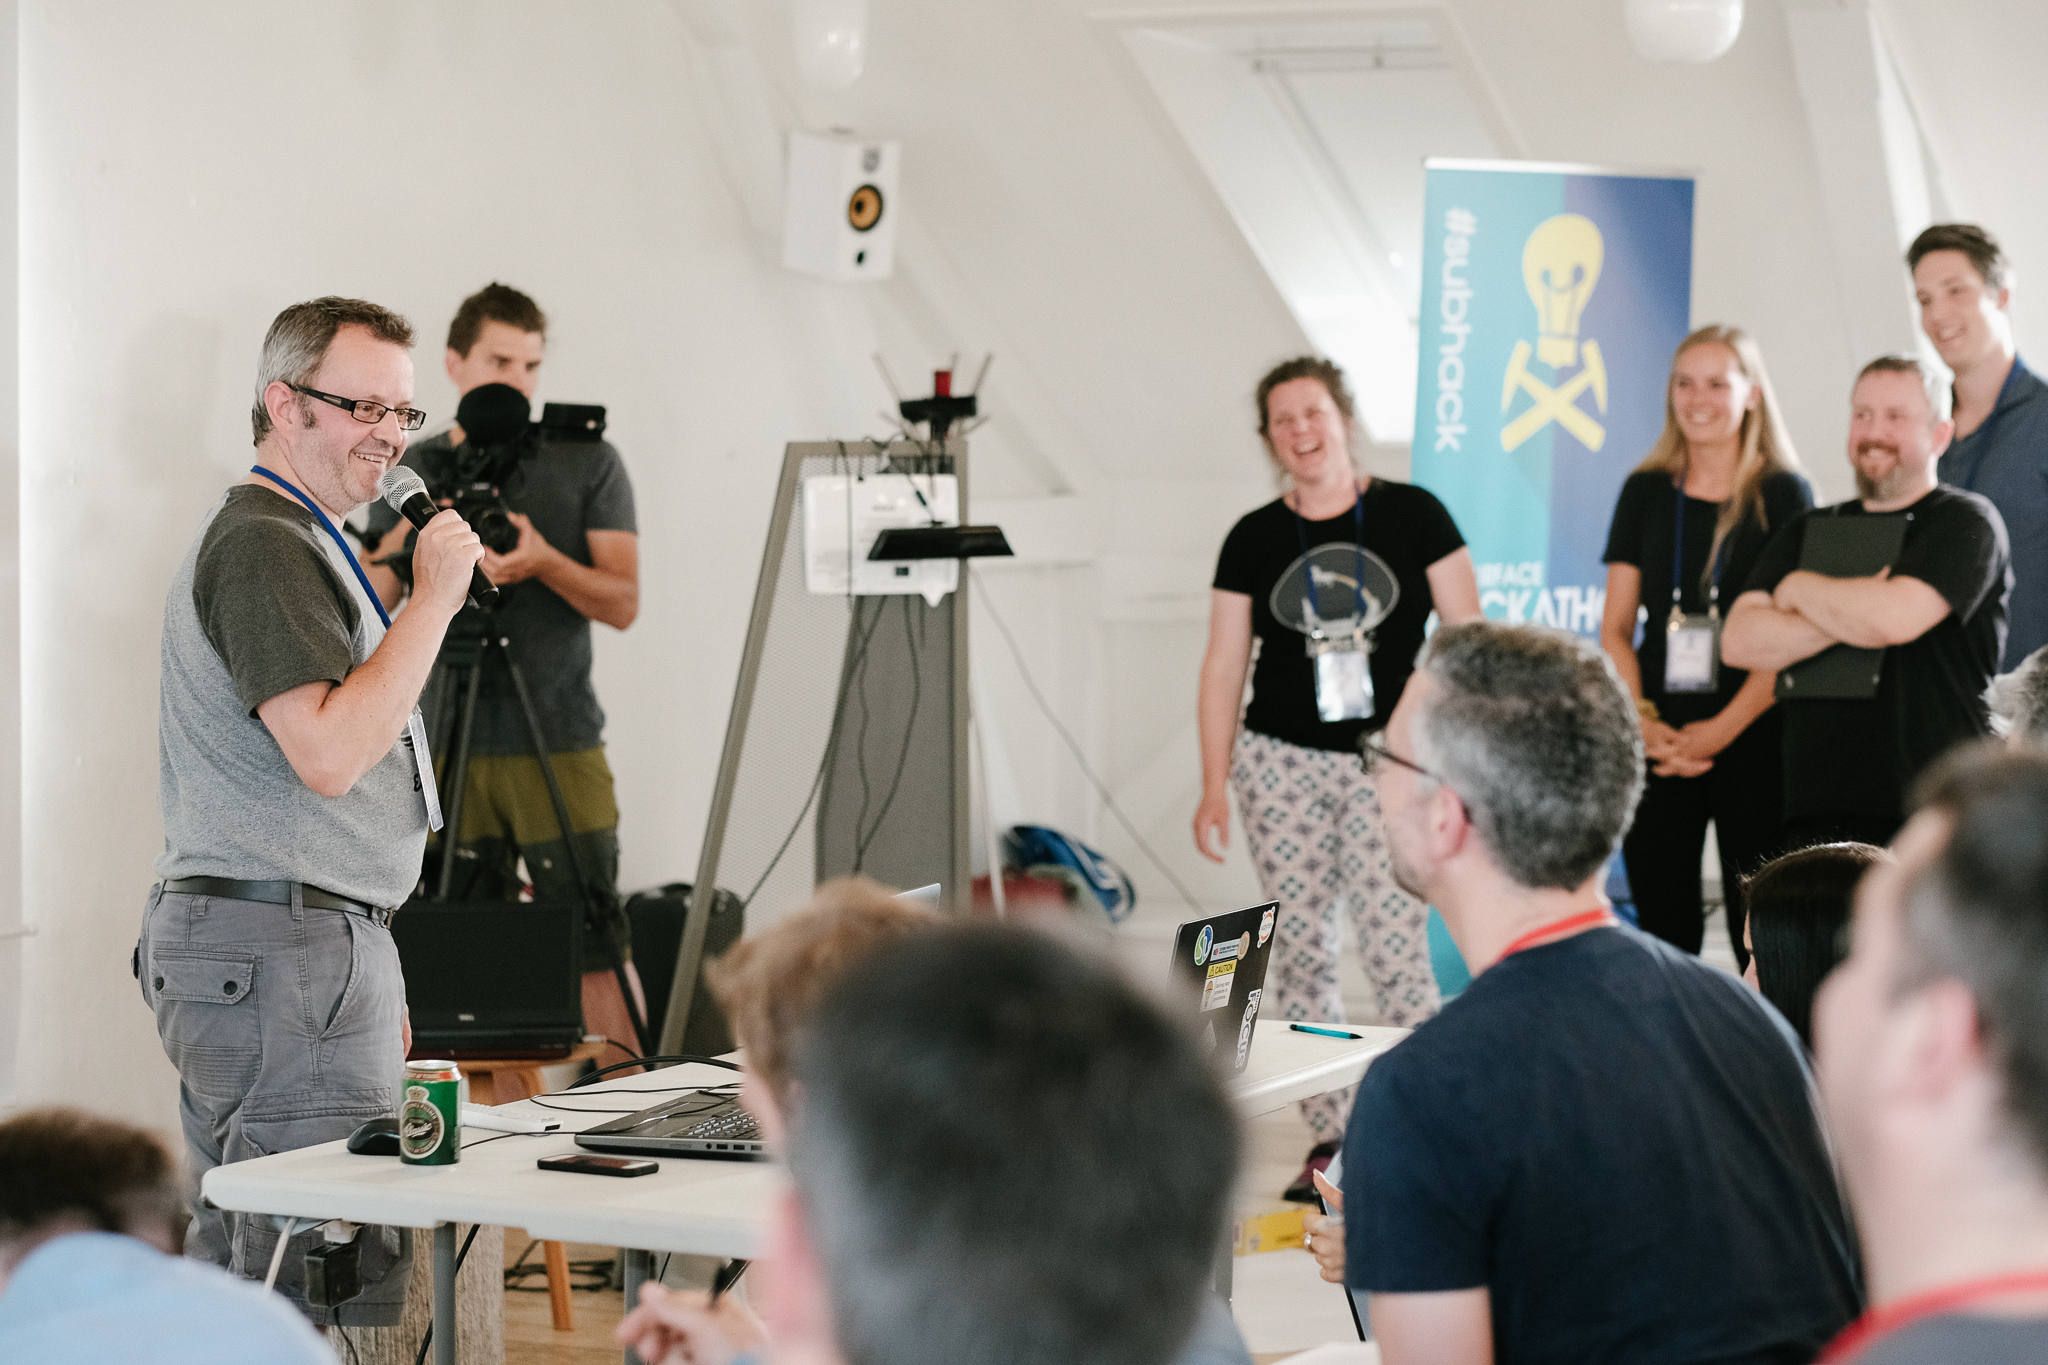
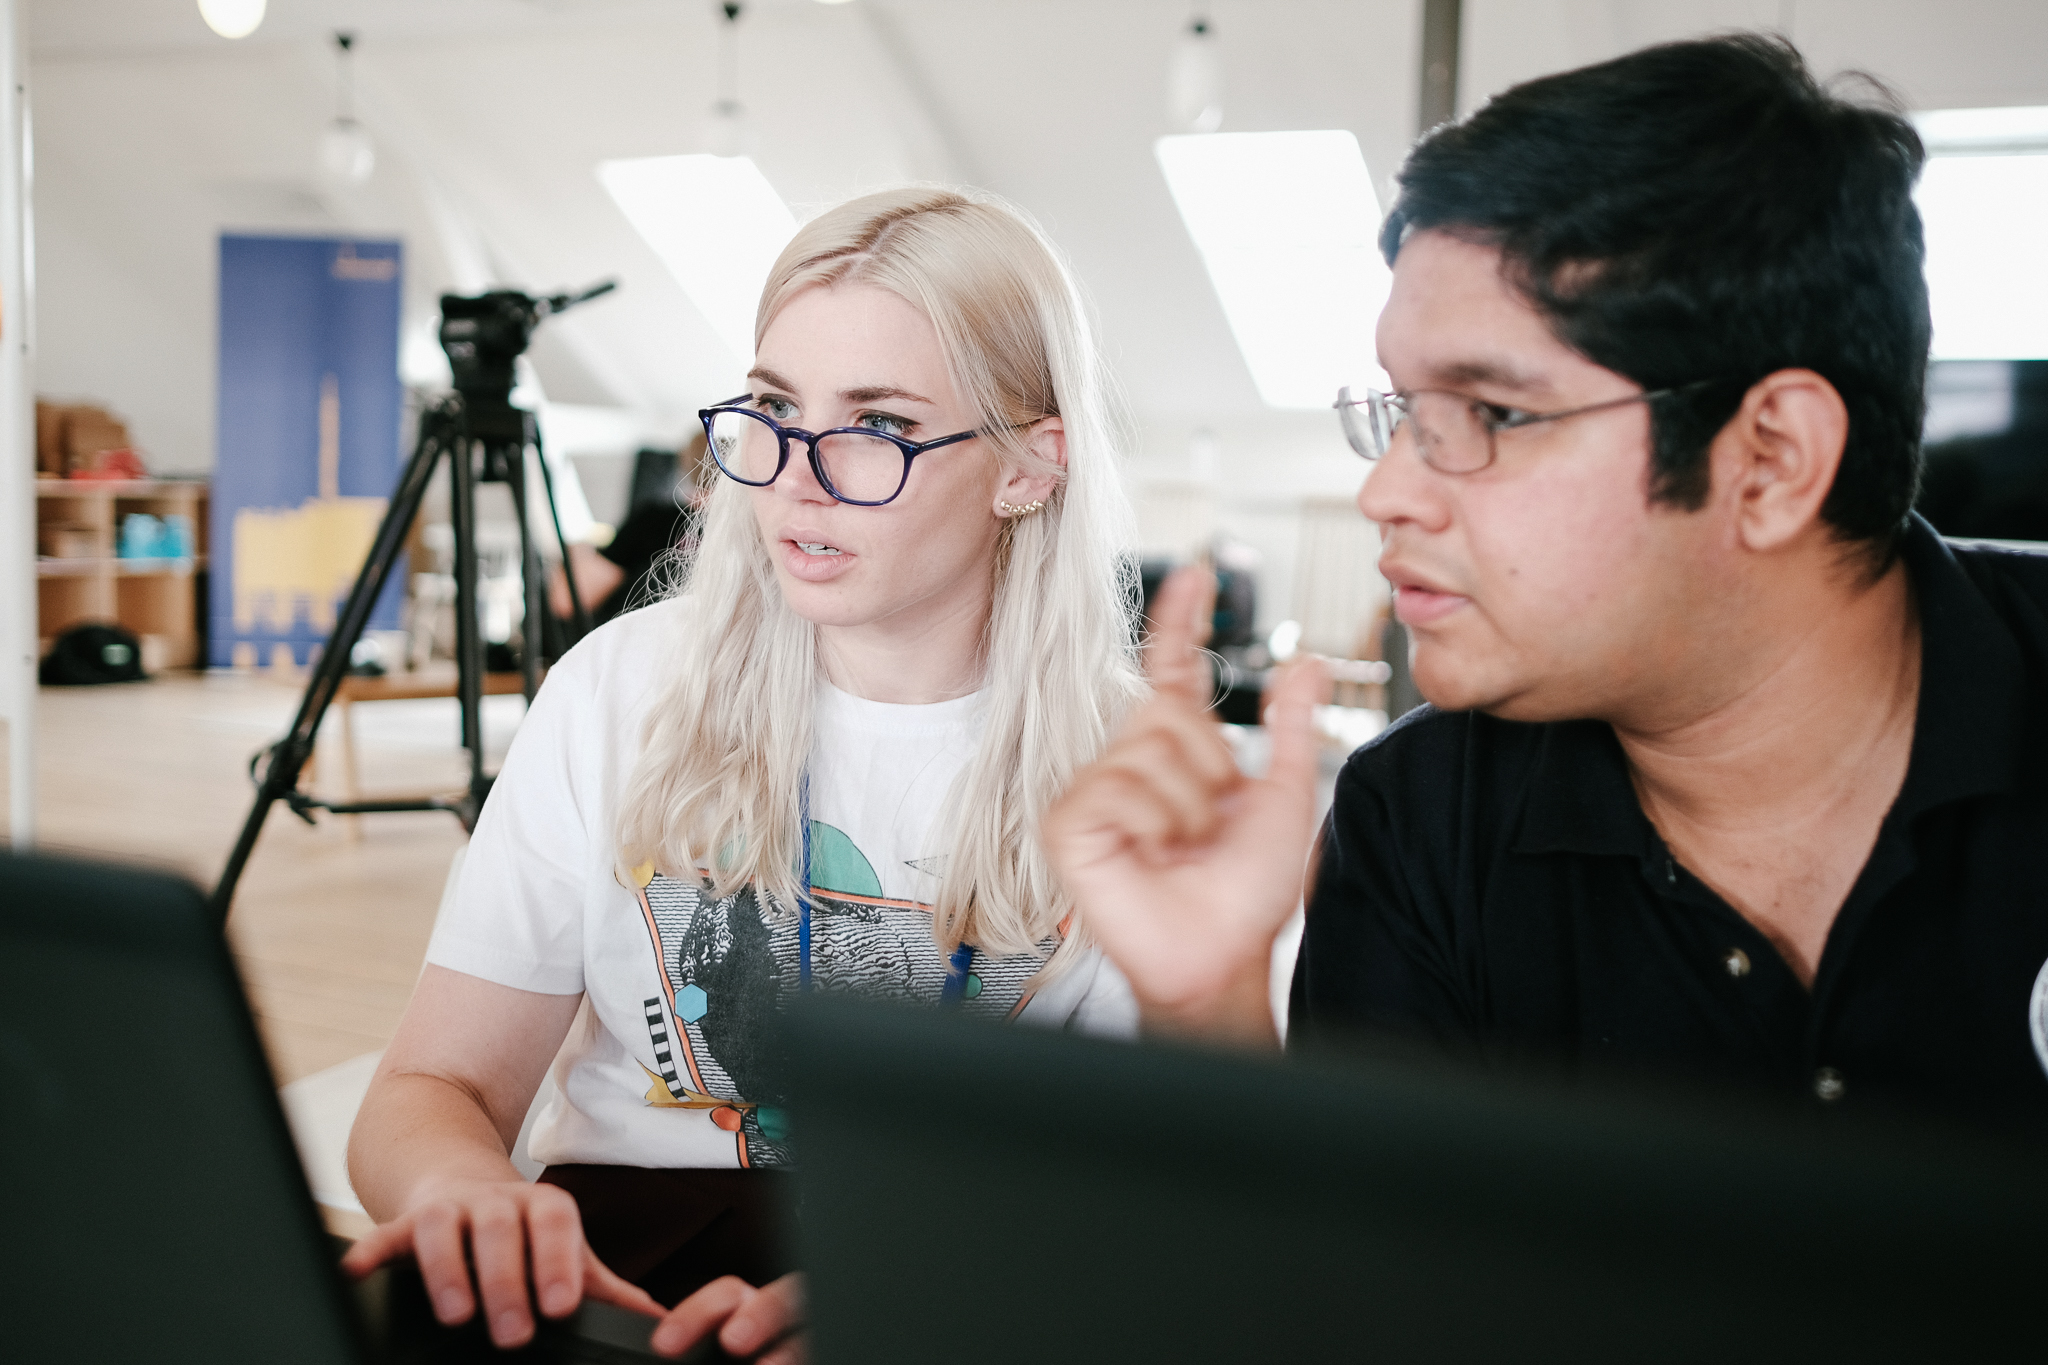
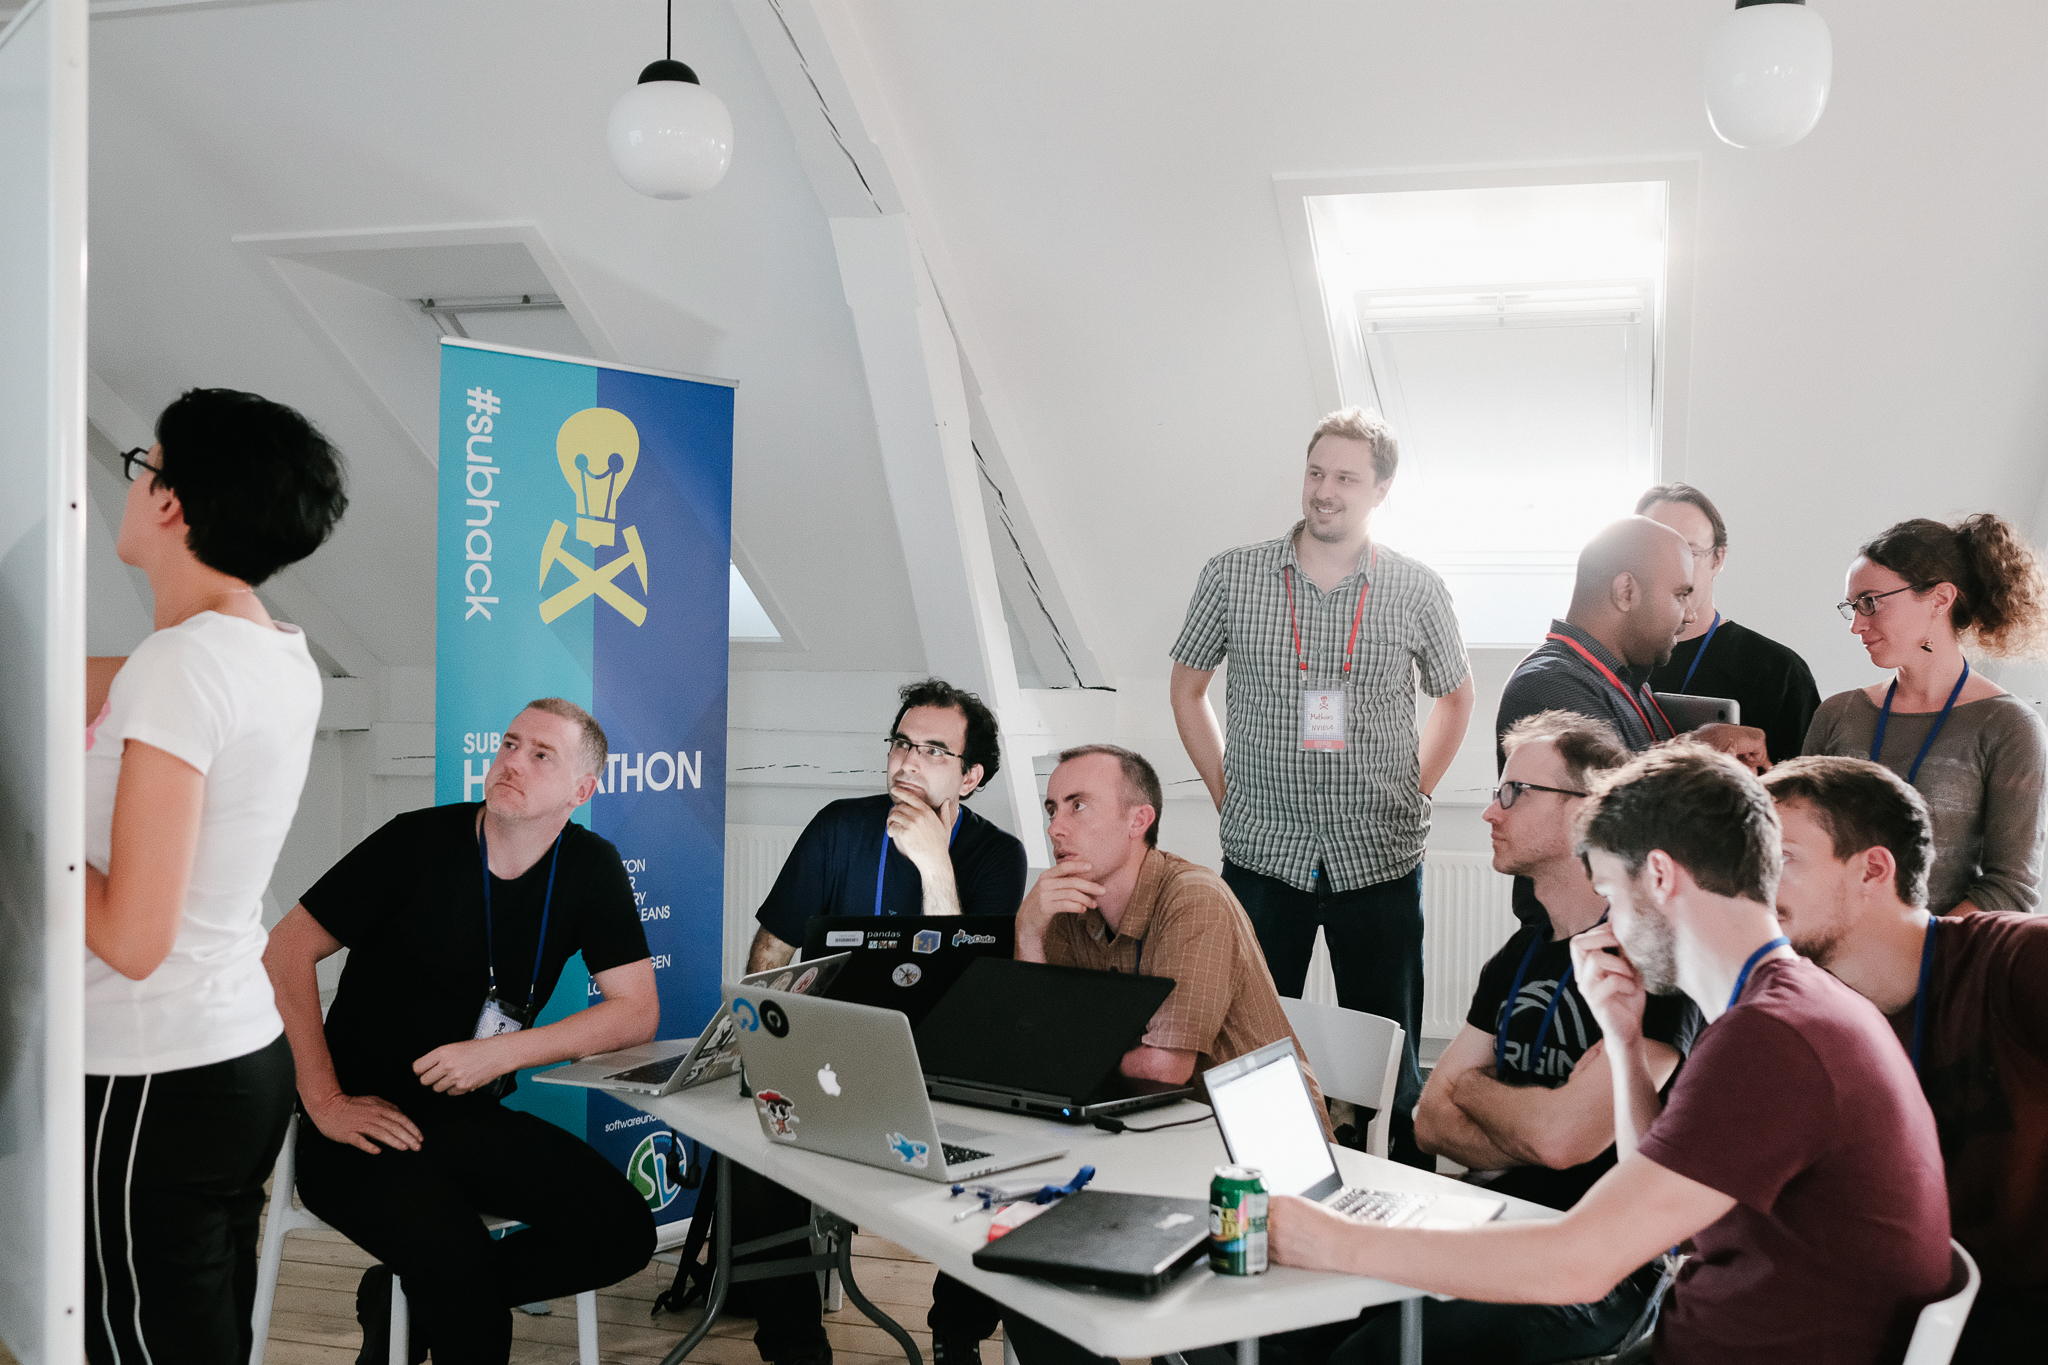
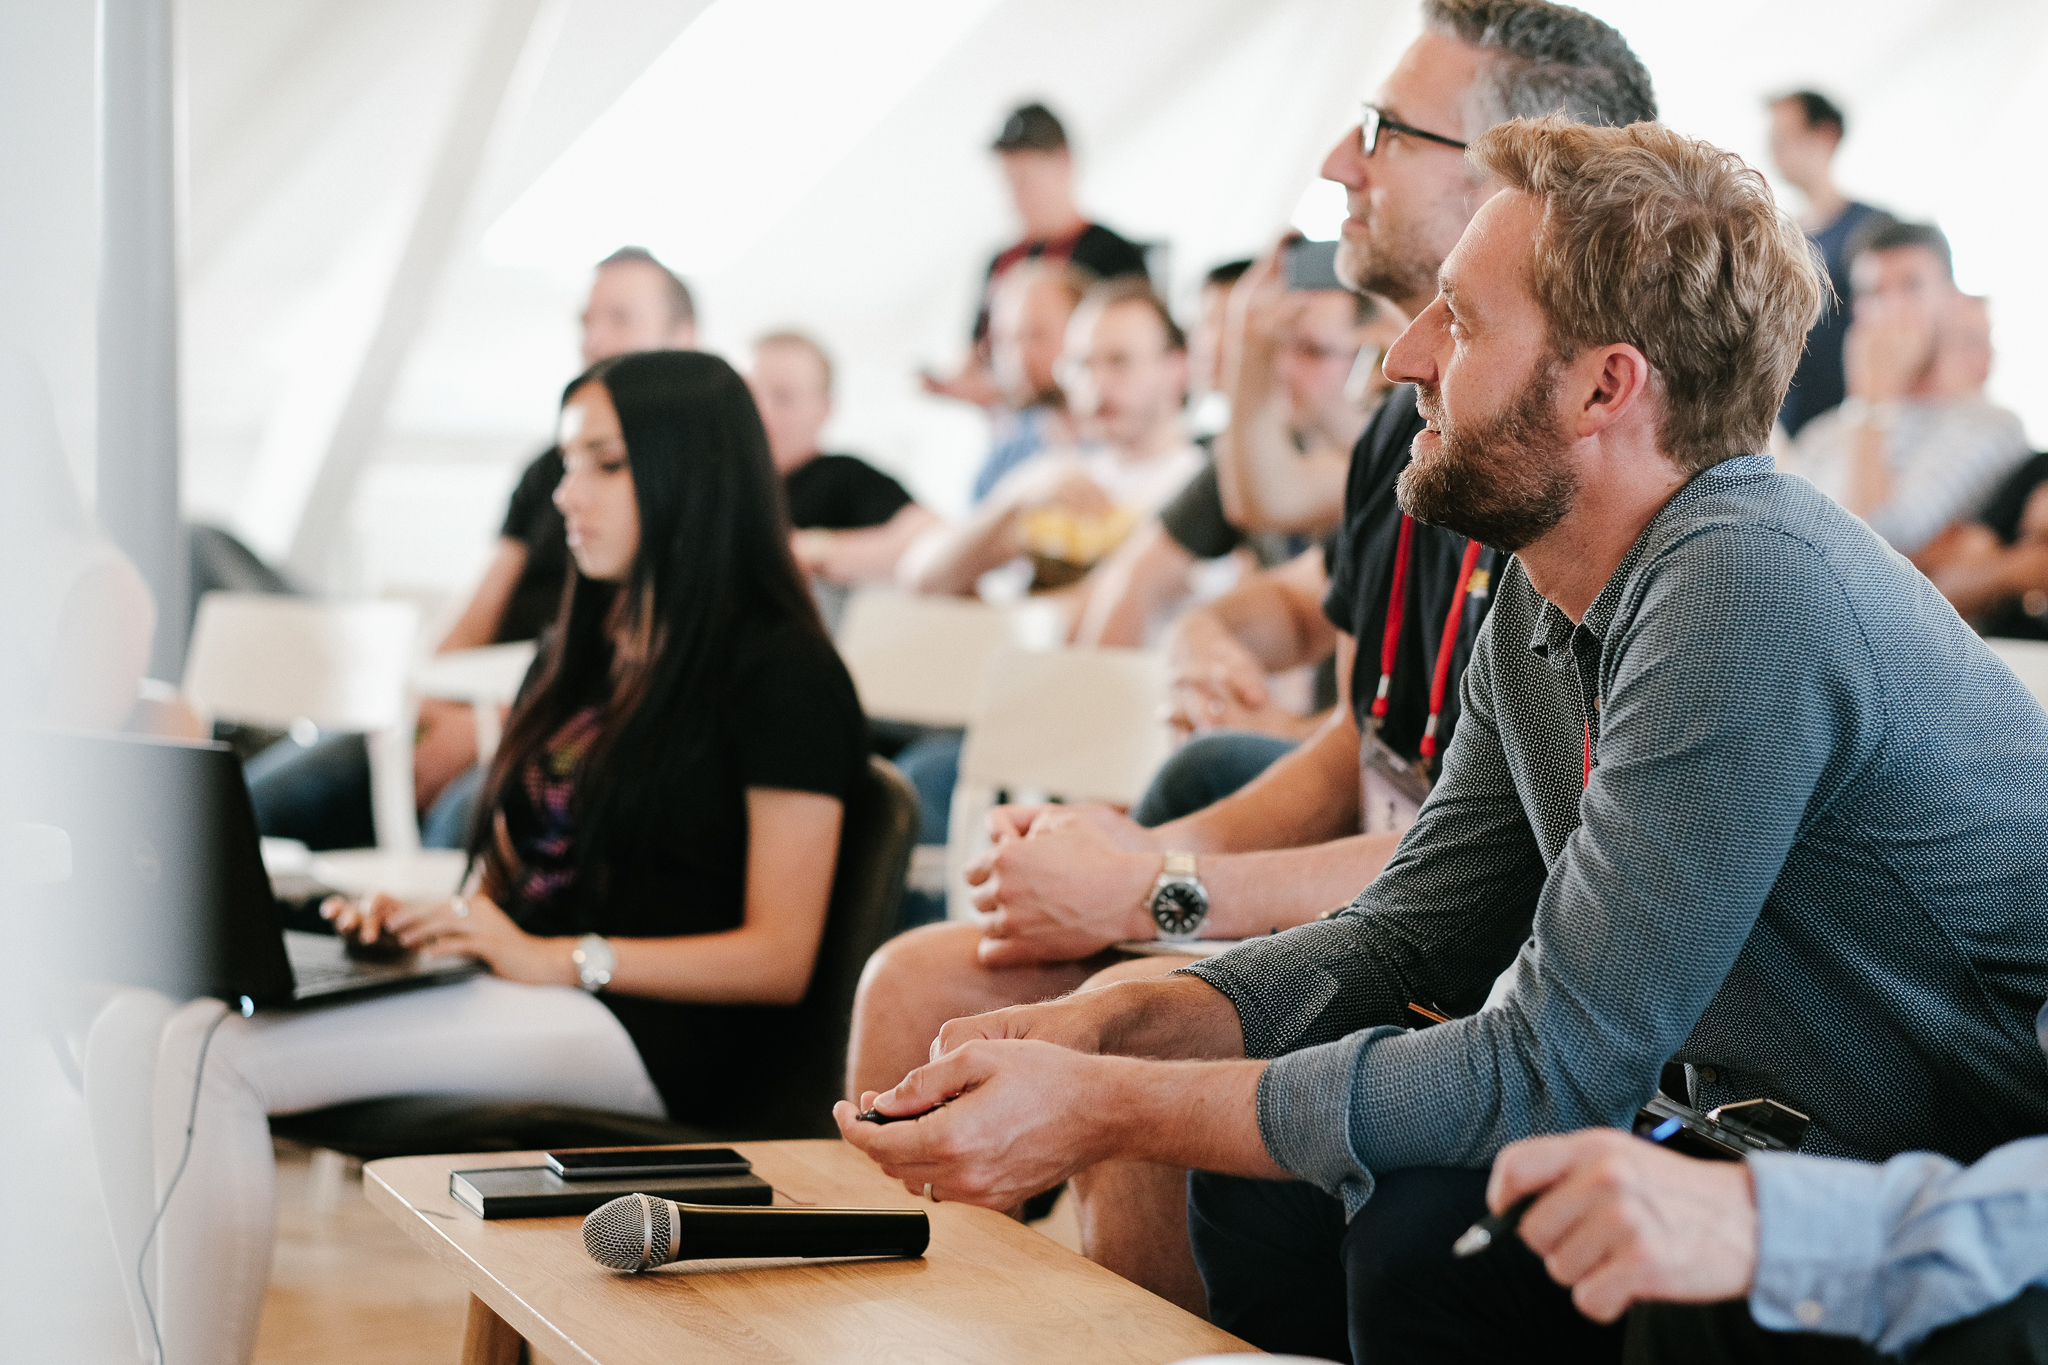
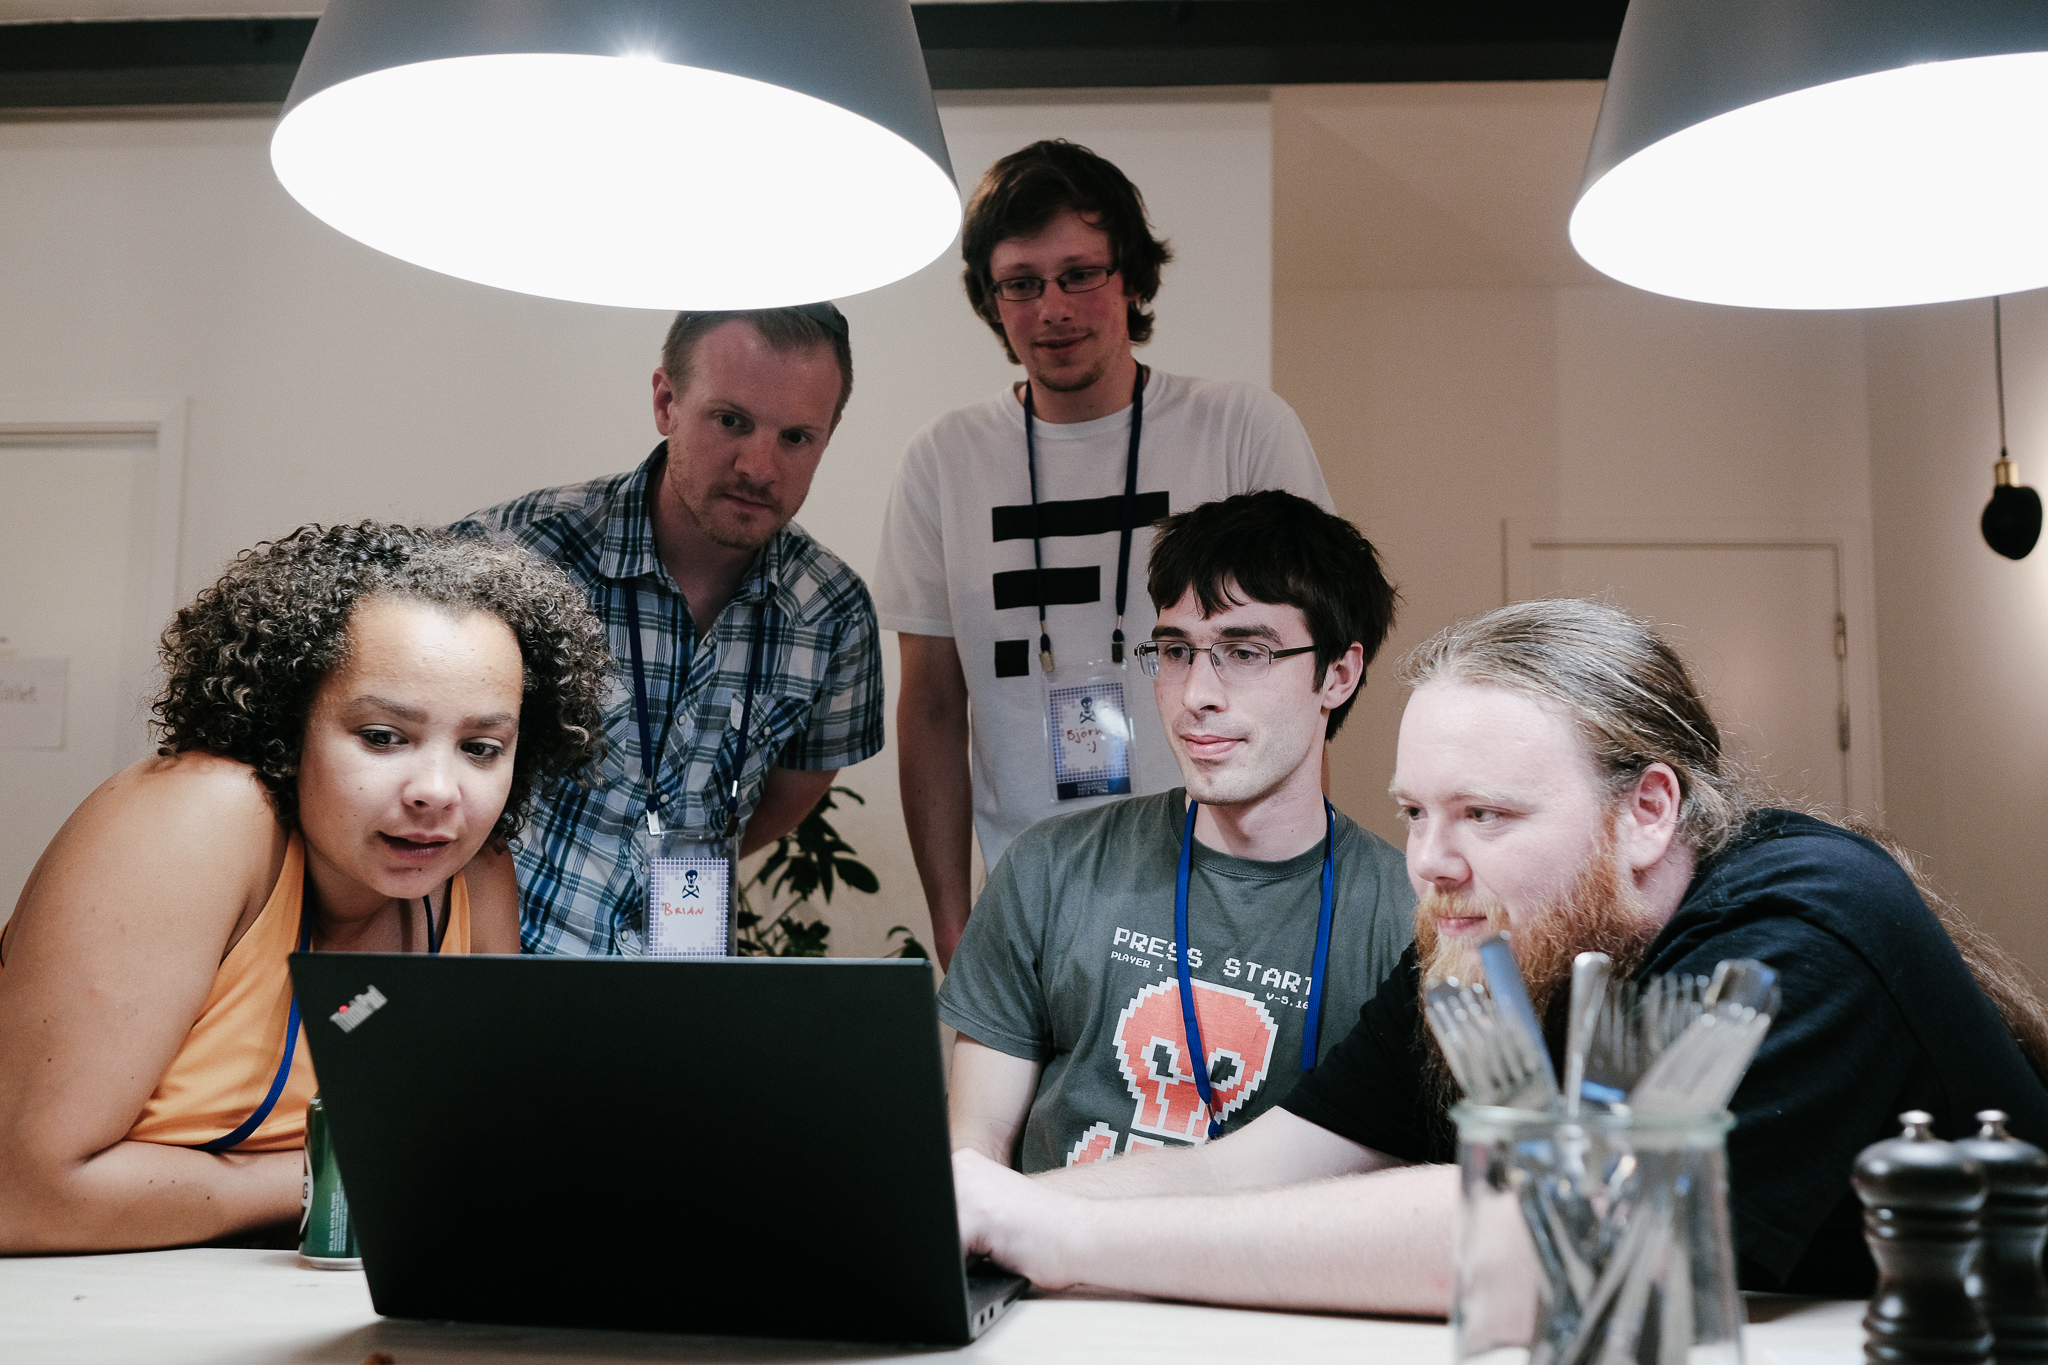
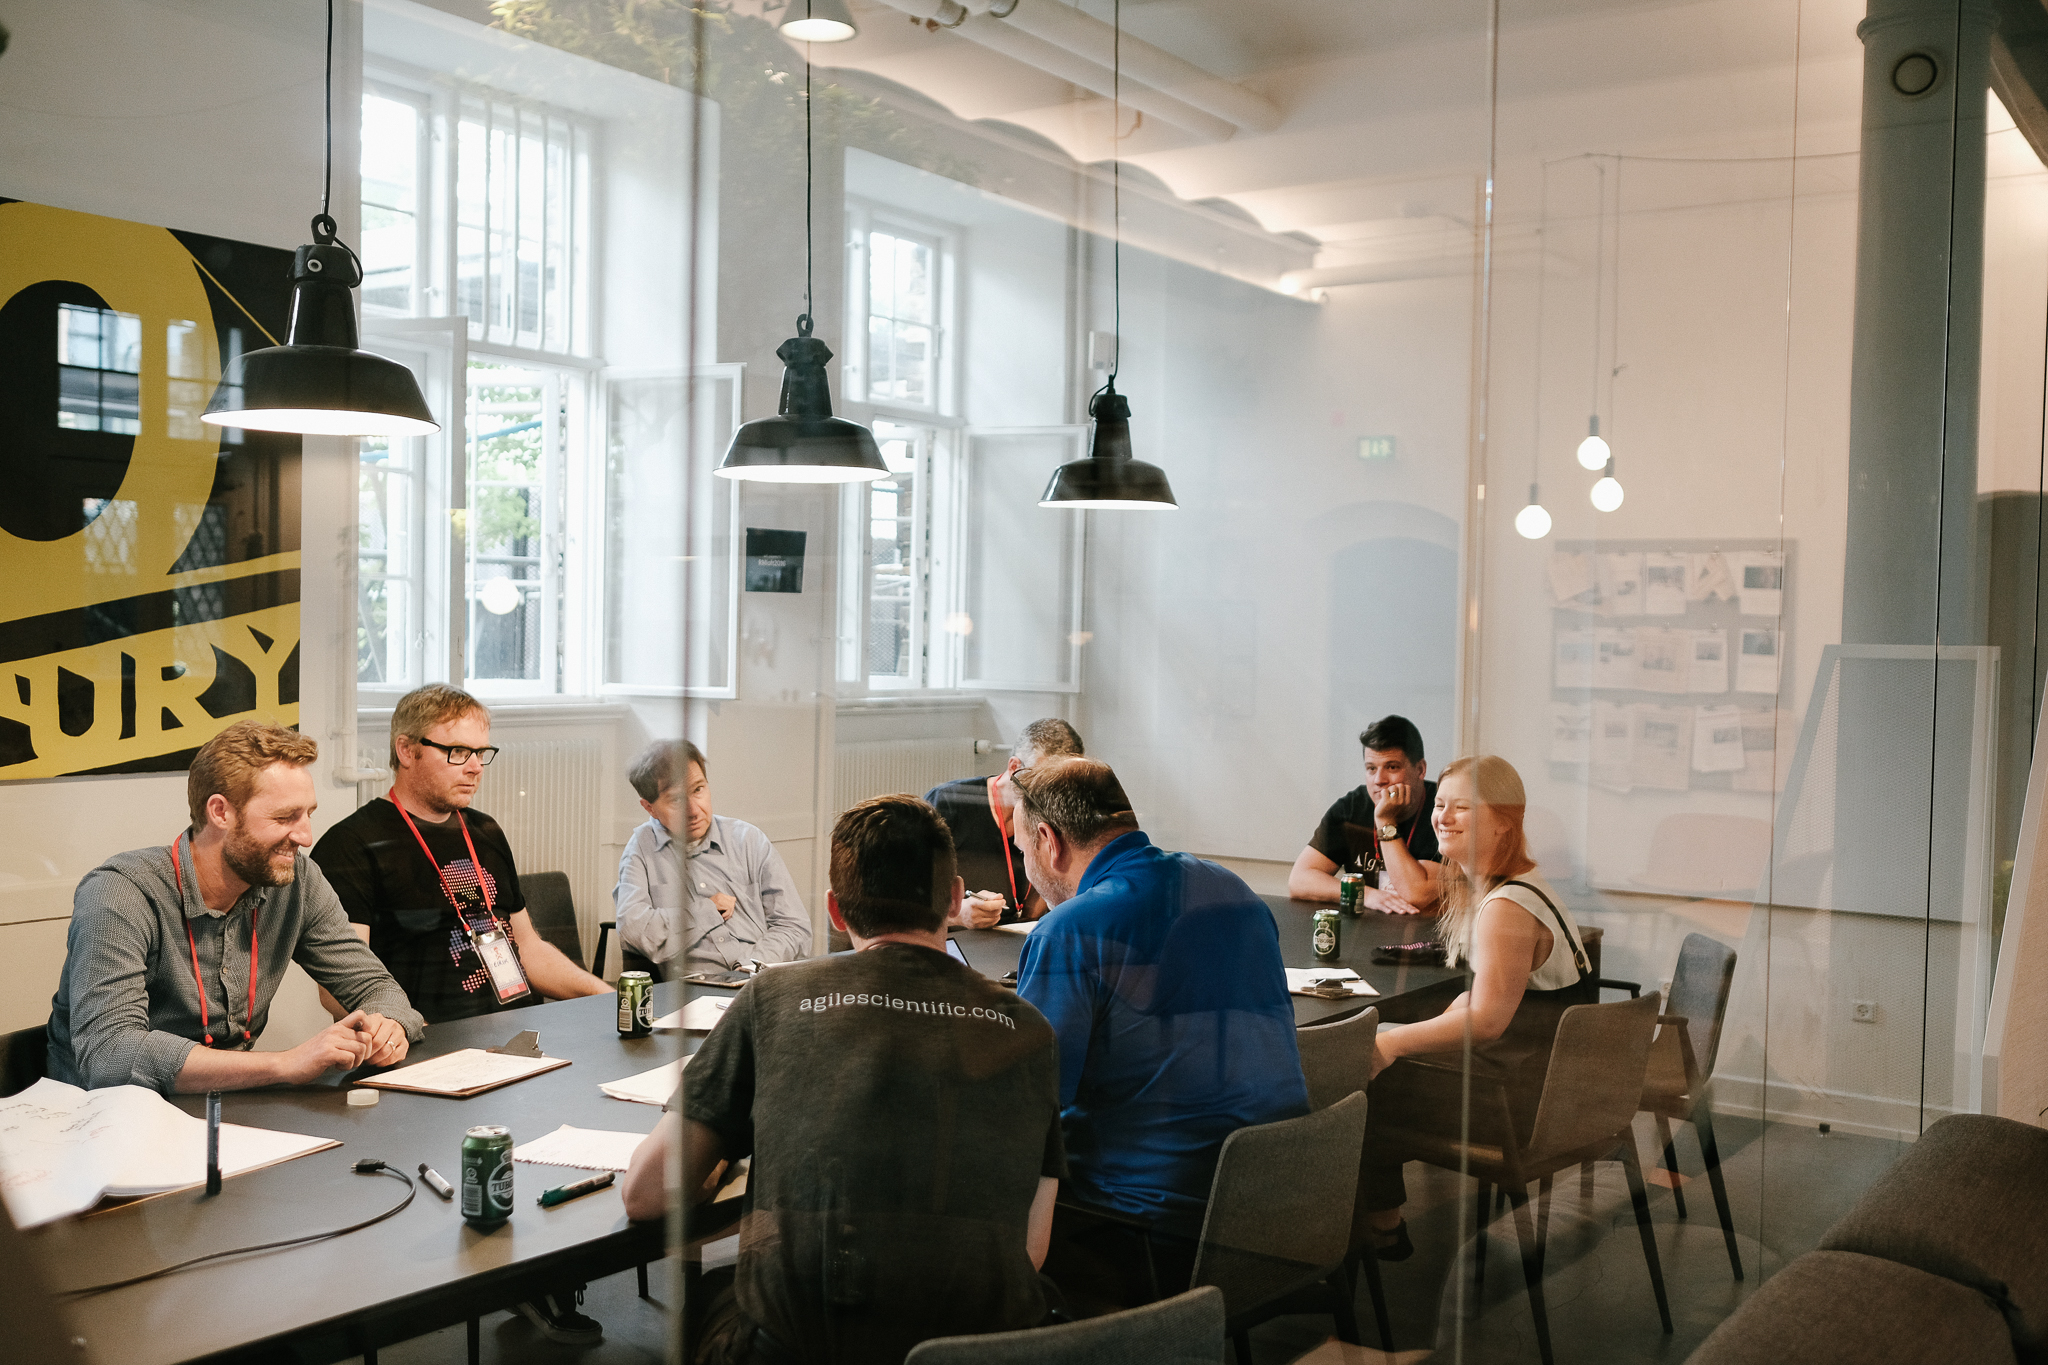
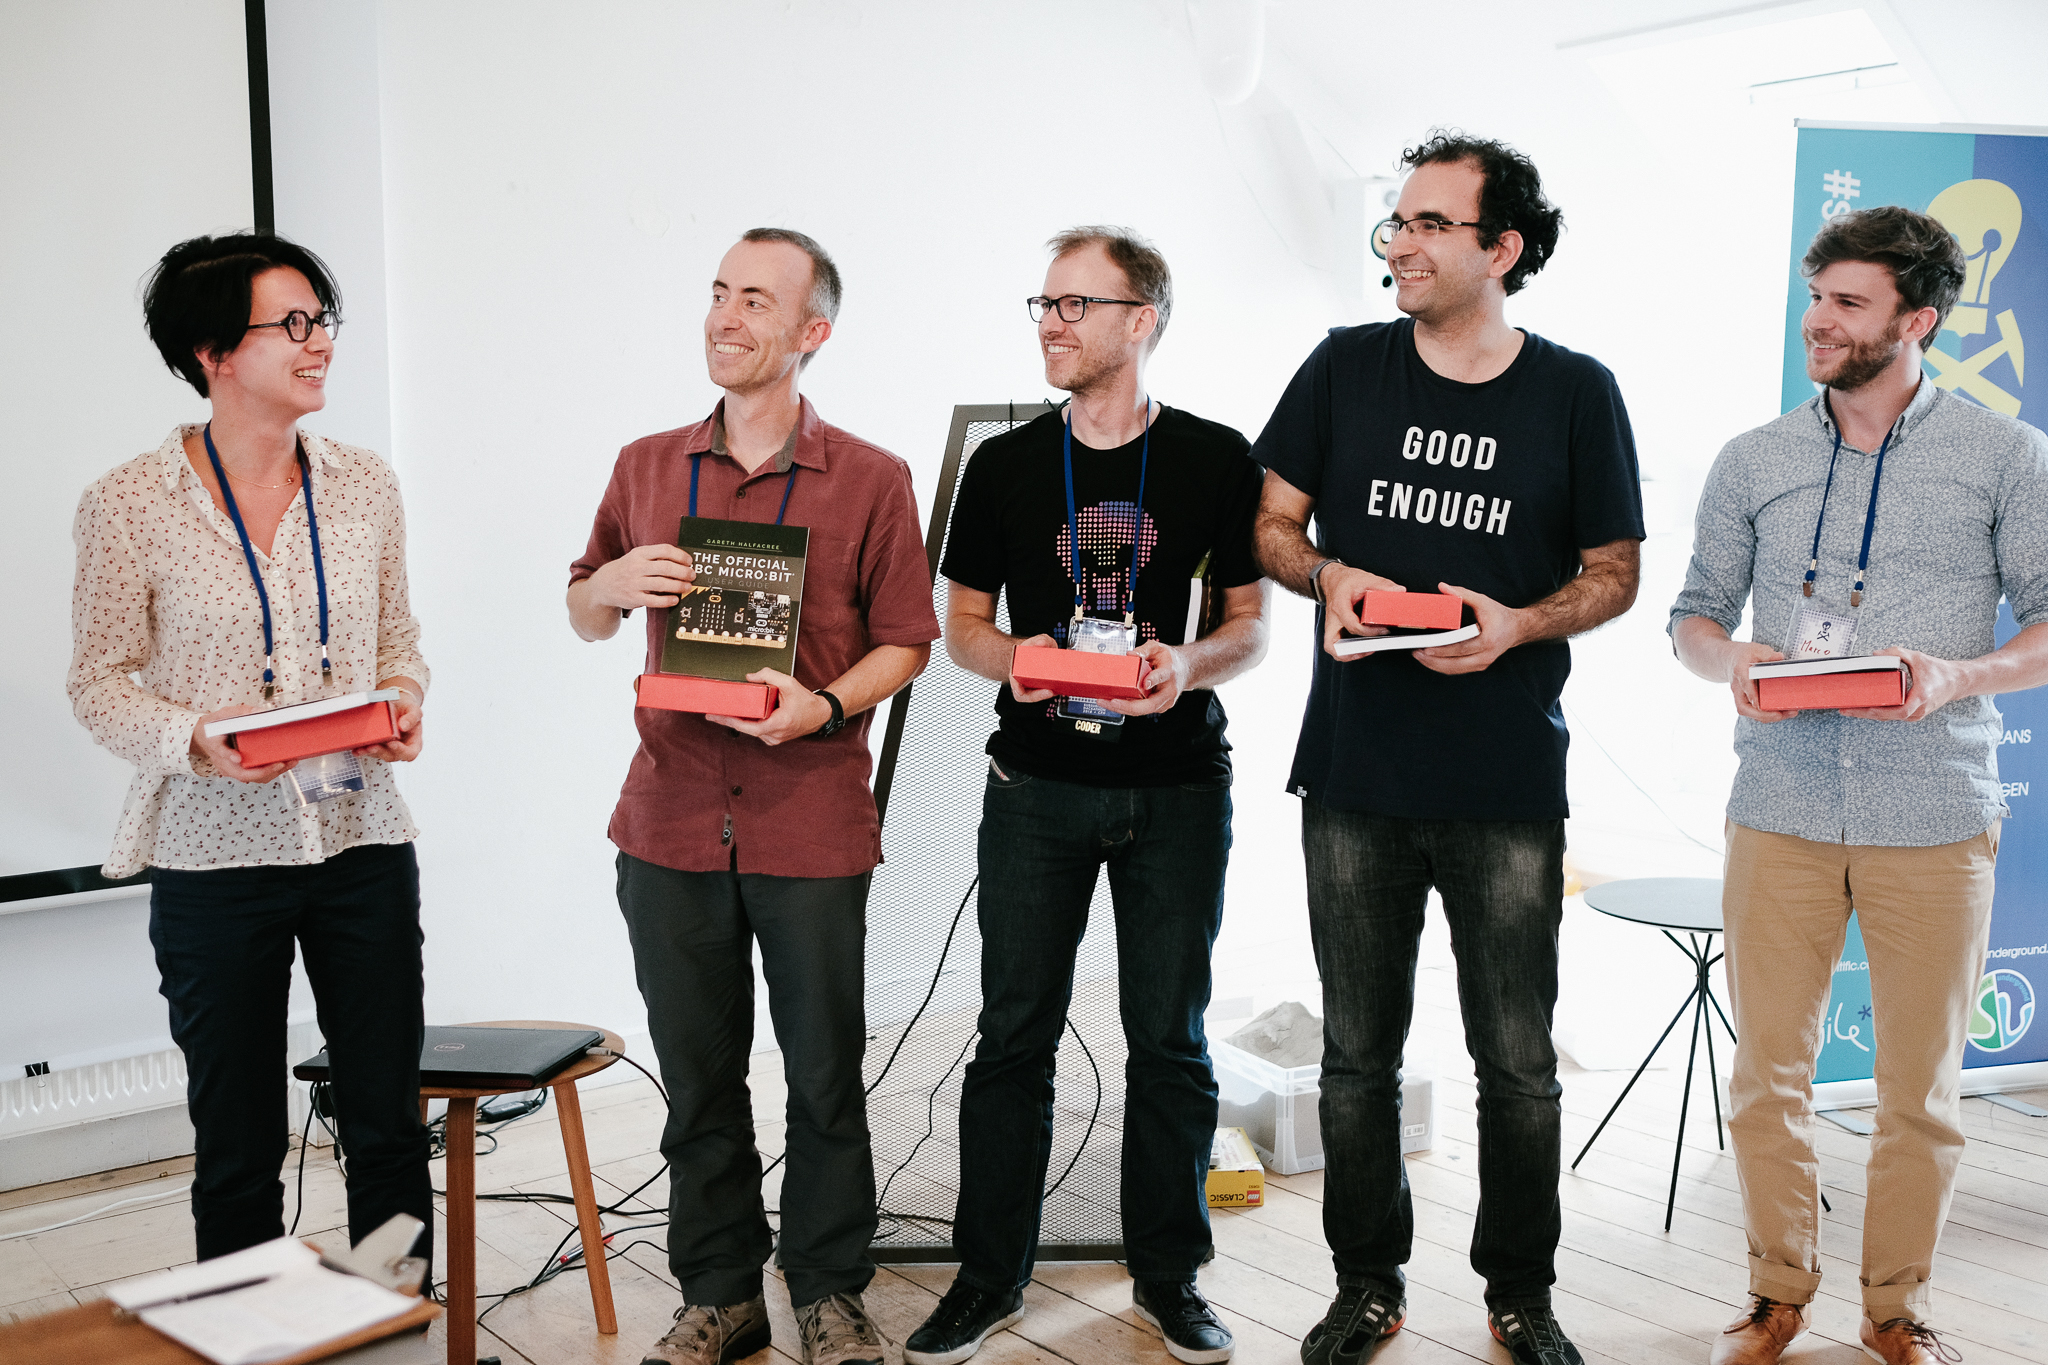
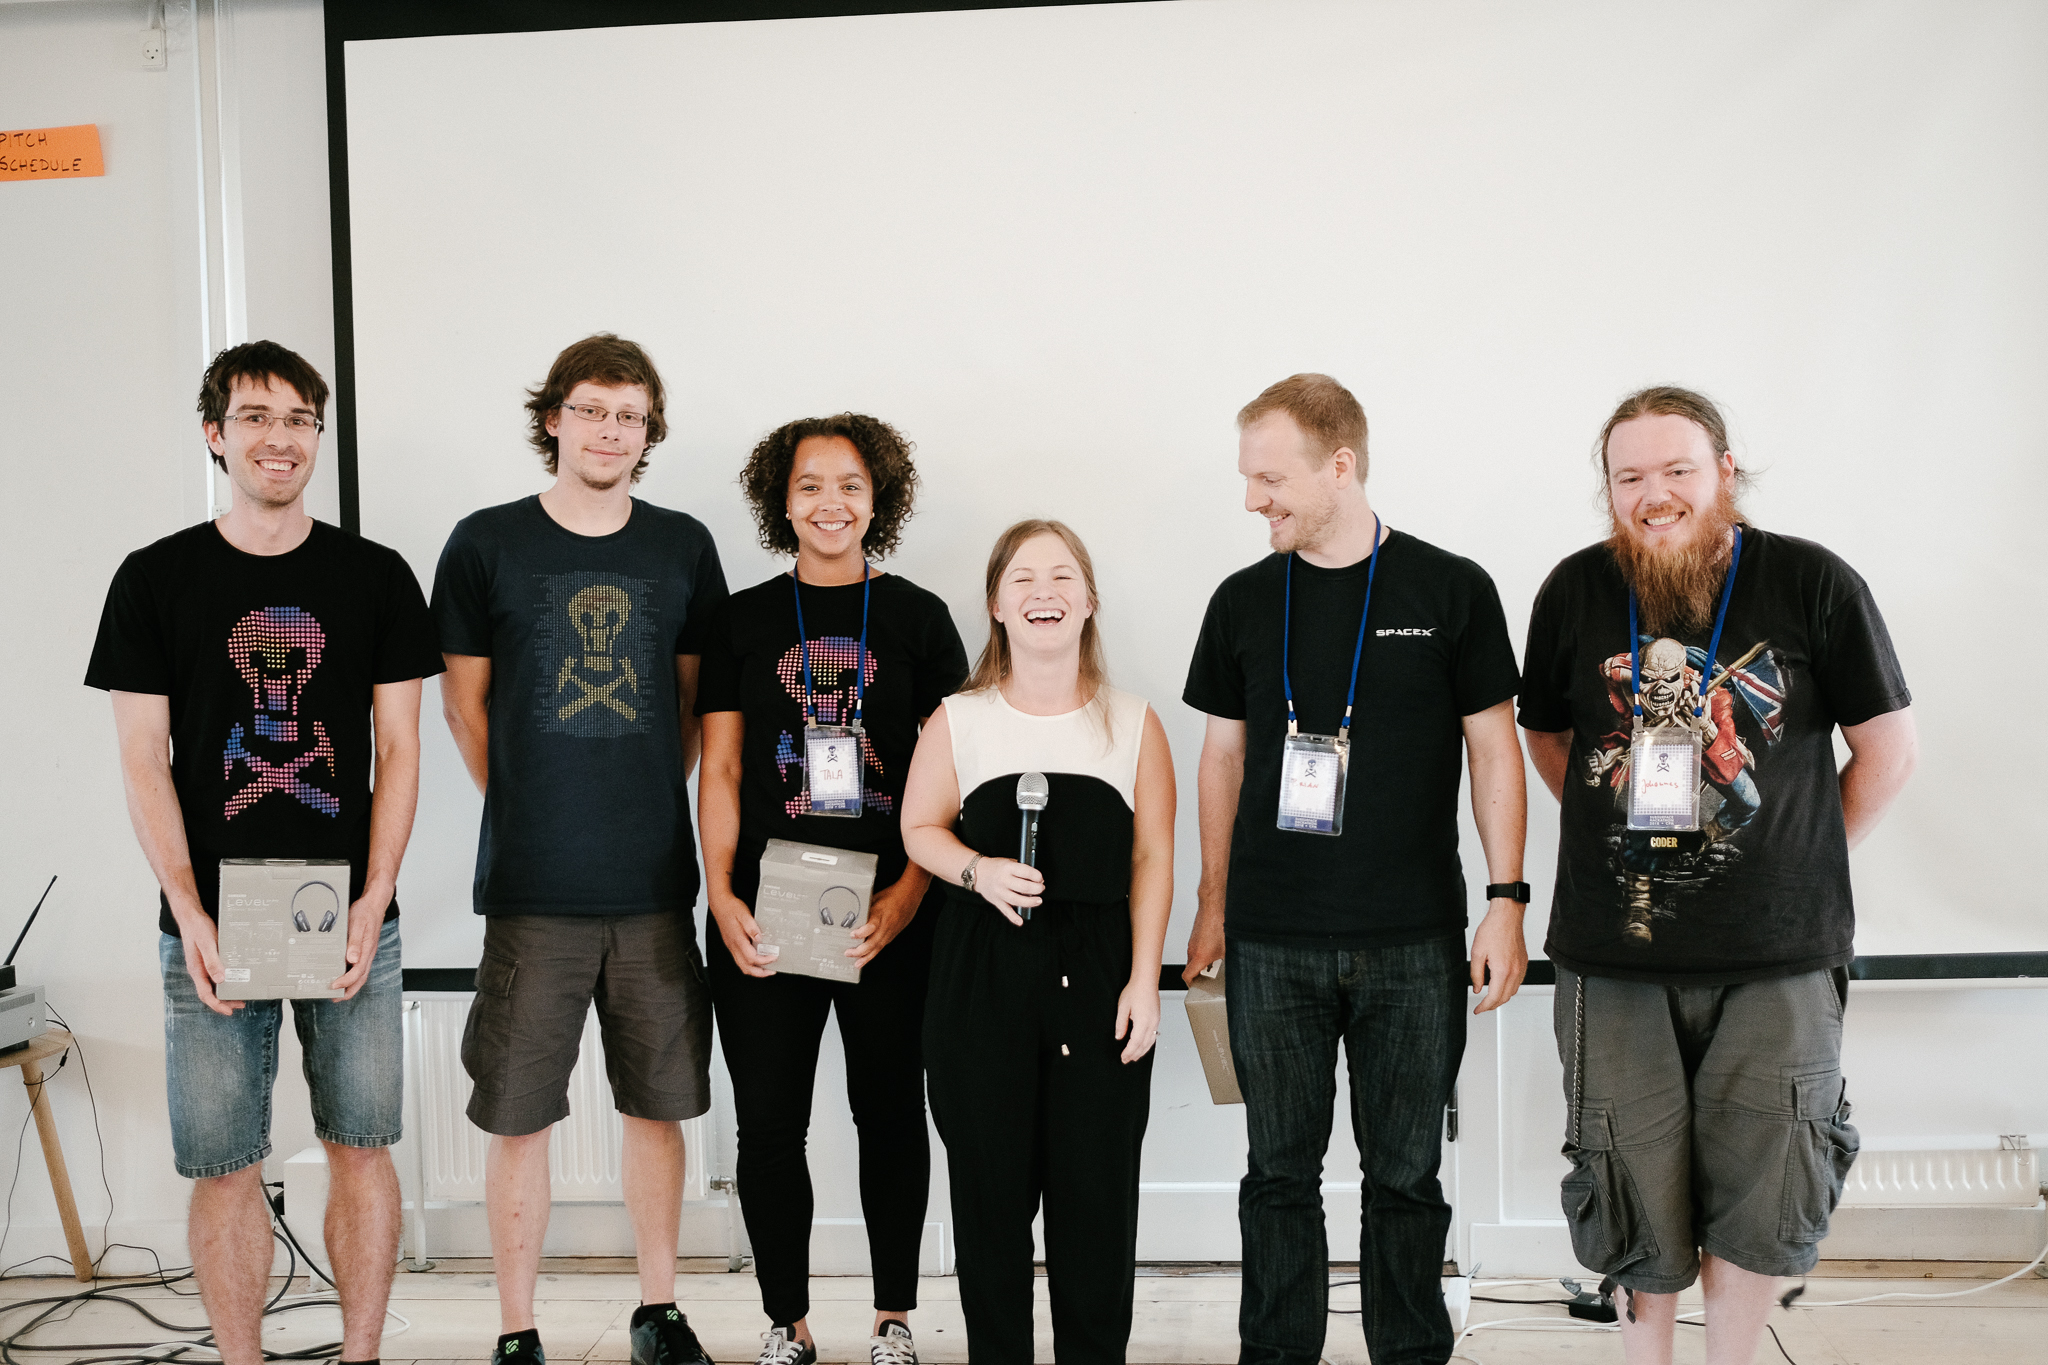
During th event, twelve teams dug into the theme of visualization and interaction. As in Houston last September, we started the event on Friday evening, after the Bootcamp (a full day of informal training). We have a bit of process to form the teams, and it usually takes a couple of hours. But with plenty of pizza and beer for fuel, the evening flew by. After that, it was two whole days of coding, followed by demos from all of the teams and a few prizes. Check out some of the pictures:
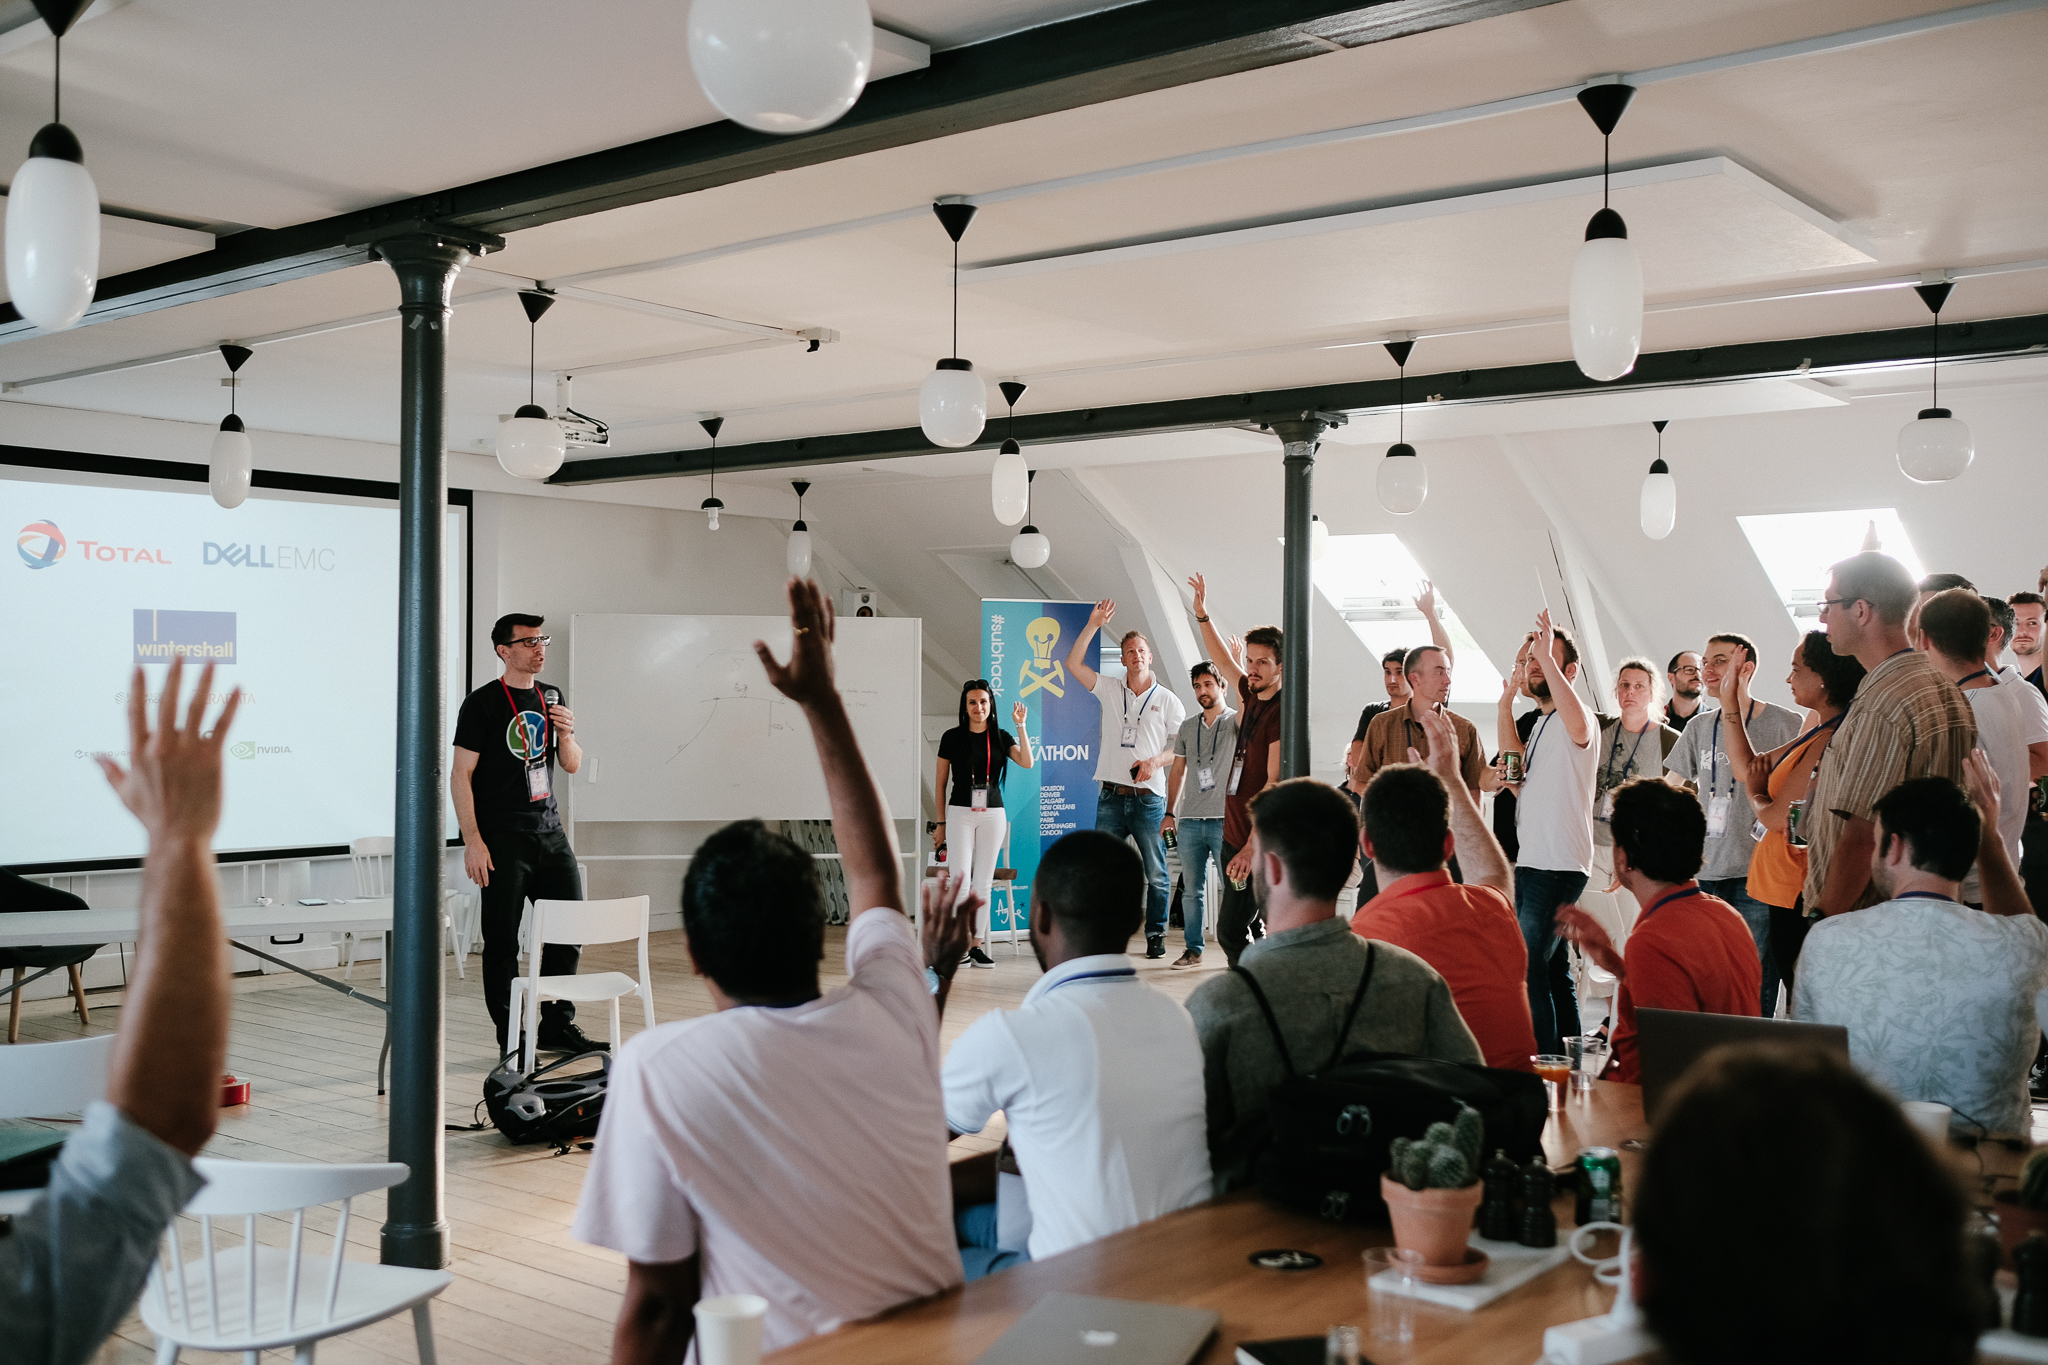
Thank you very much to everyone that helped make this event happen! Truly a cast of thousands:

  • David Holmes of Dell EMC for unparallelled awesomeness.
  • The whole Total team, but especially Frederic Broust, Sophie Segura, Yannick Pion, and Laurent Baduel...
  • ...and also Arnaud Rodde for helping with the judging.
  • The Wintershall team, especially Andreas Beha, who also acted as a judge.
  • Brendon Hall of Enthought for sponsoring the event.
  • Carlos Castro and Kim Saabye Pedersen of Amazon AWS.
  • Mathias Hummel and Mahendra Roopa of NVIDIA.
  • Eirik Larsen of Earth Science Analytics for sponsoring the event and helping with the judging.
  • Duncan Irving of Teradata for sponsoring, and sorting out the T-shirts.
  • Monica Beech of Ikon Science for participating in the judging.
  • Matthias Hartung of Target for acting as a judge again.
  • Oliver Ranneries, plus Nina and Eva of Rainmaking Loft.
  • Christopher Backholm for taking such great photographs.

Finally, some statistics from the event:

  • 63 participants, including 8 women (still way too few, but 100% better than 4 out of 63 in Paris)
  • 15 students plus a handful of post-docs.
  • 19 people from petroleum companies.
  • 20 people from service and technology companies, including 7 from GiGa-infosystems!
  • 1 no-show, which I think is a new record.

I will write a summary of all the projects in a couple of weeks when I've caught my breath. In the meantime, you can read a bit about them on our new events portal. We'll be steadily improving this new tool over the coming weeks and months.

That's it for another year... except we'll be back in Europe before the end of the year. There's the FORCE Hackathon in Stavanger in September, then in November we'll be in Aberdeen and London running some events with the Oil and Gas Authority. If you want some machine learning fun, or are looking for a new challenge, please come along!

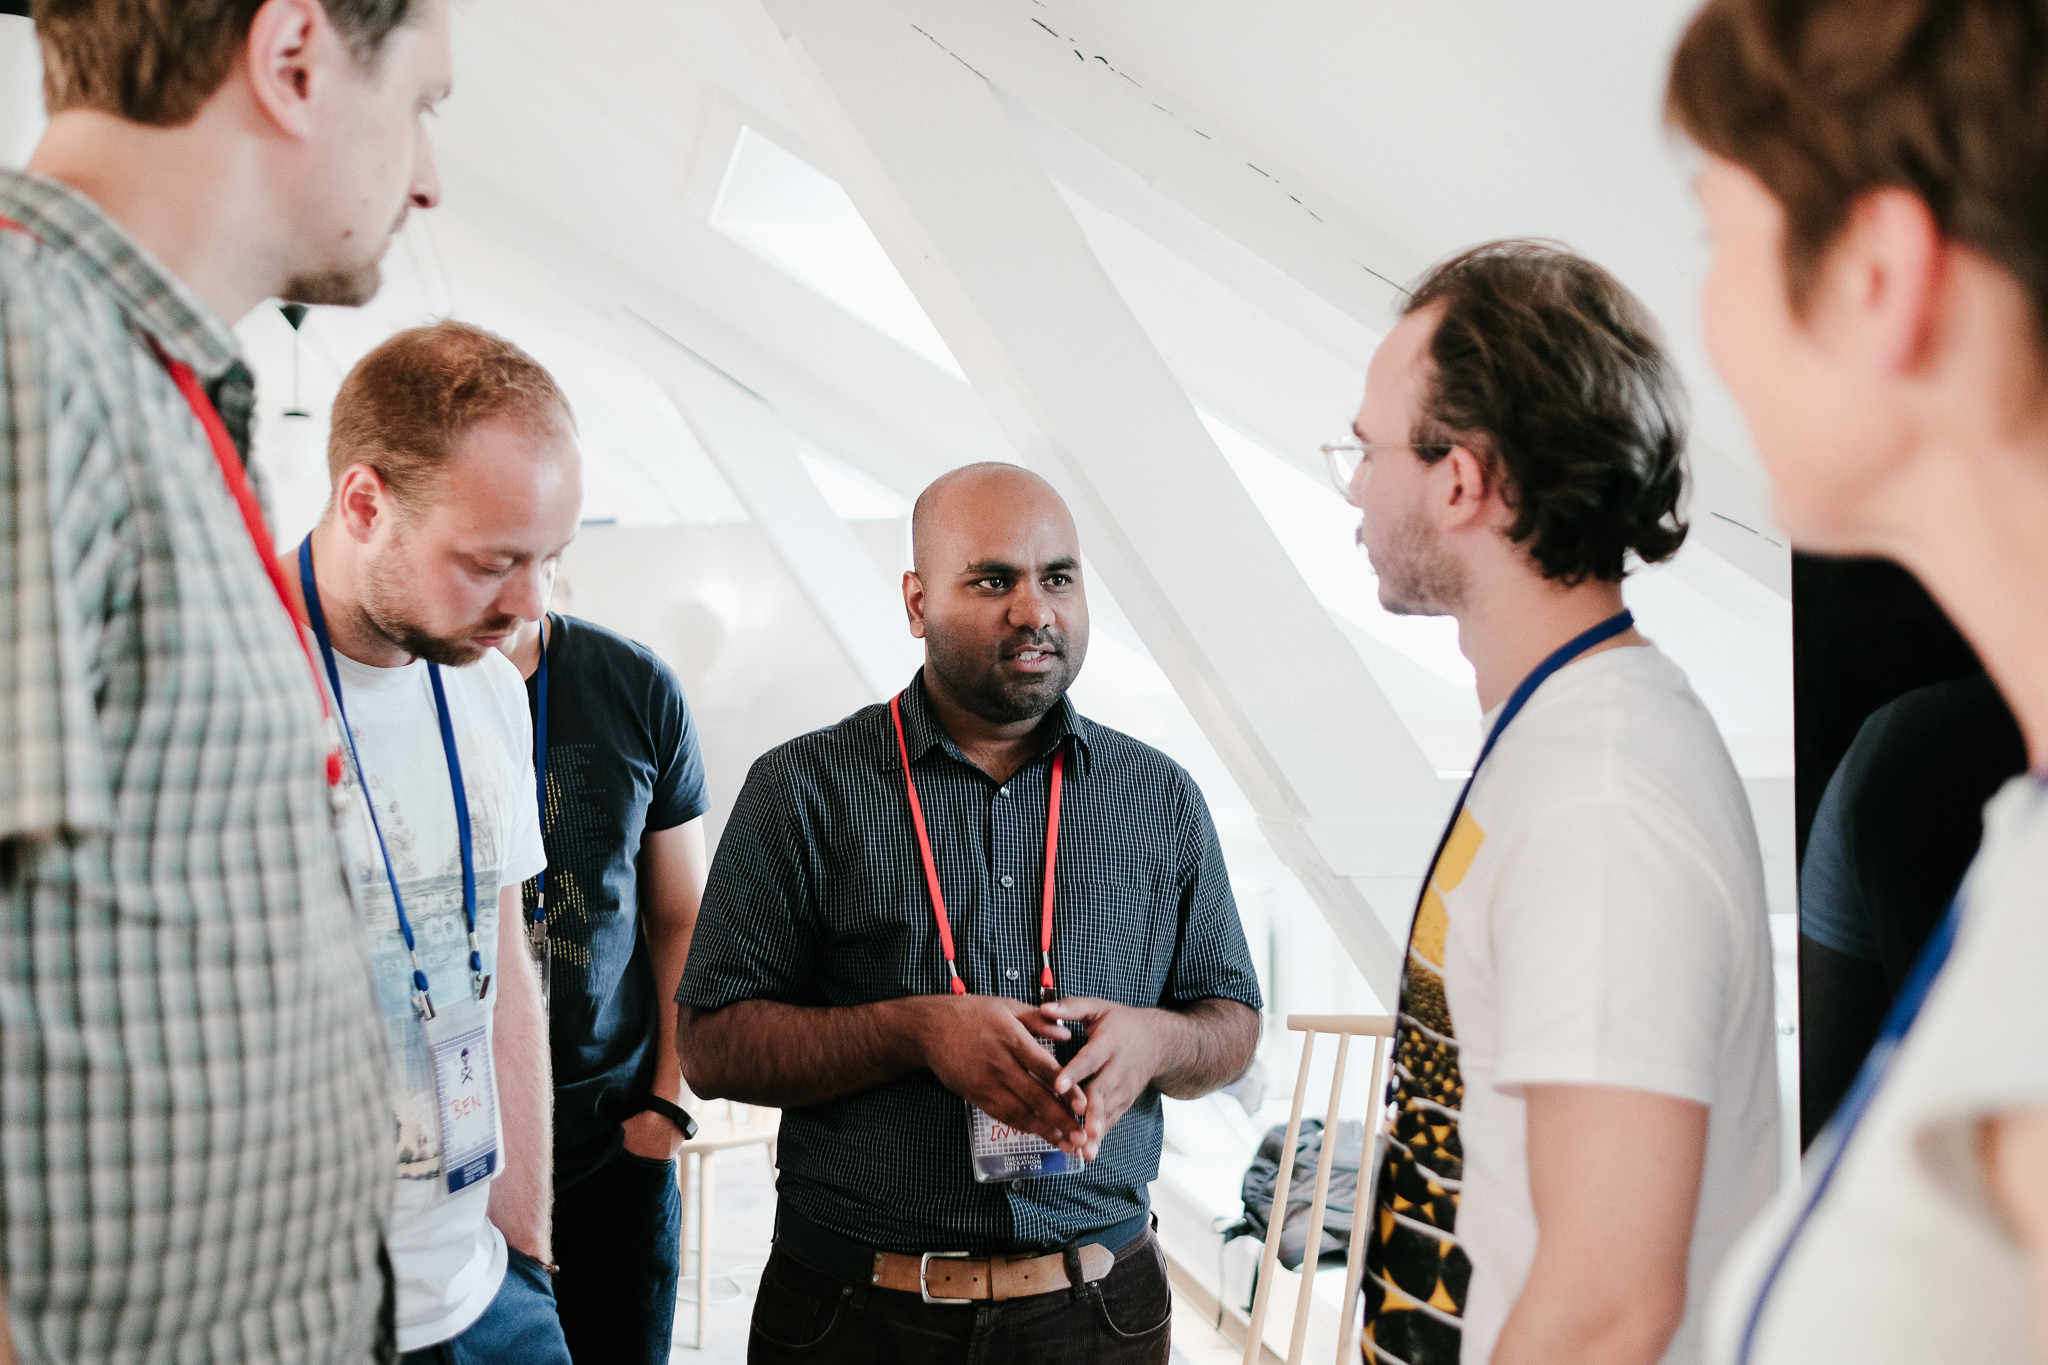
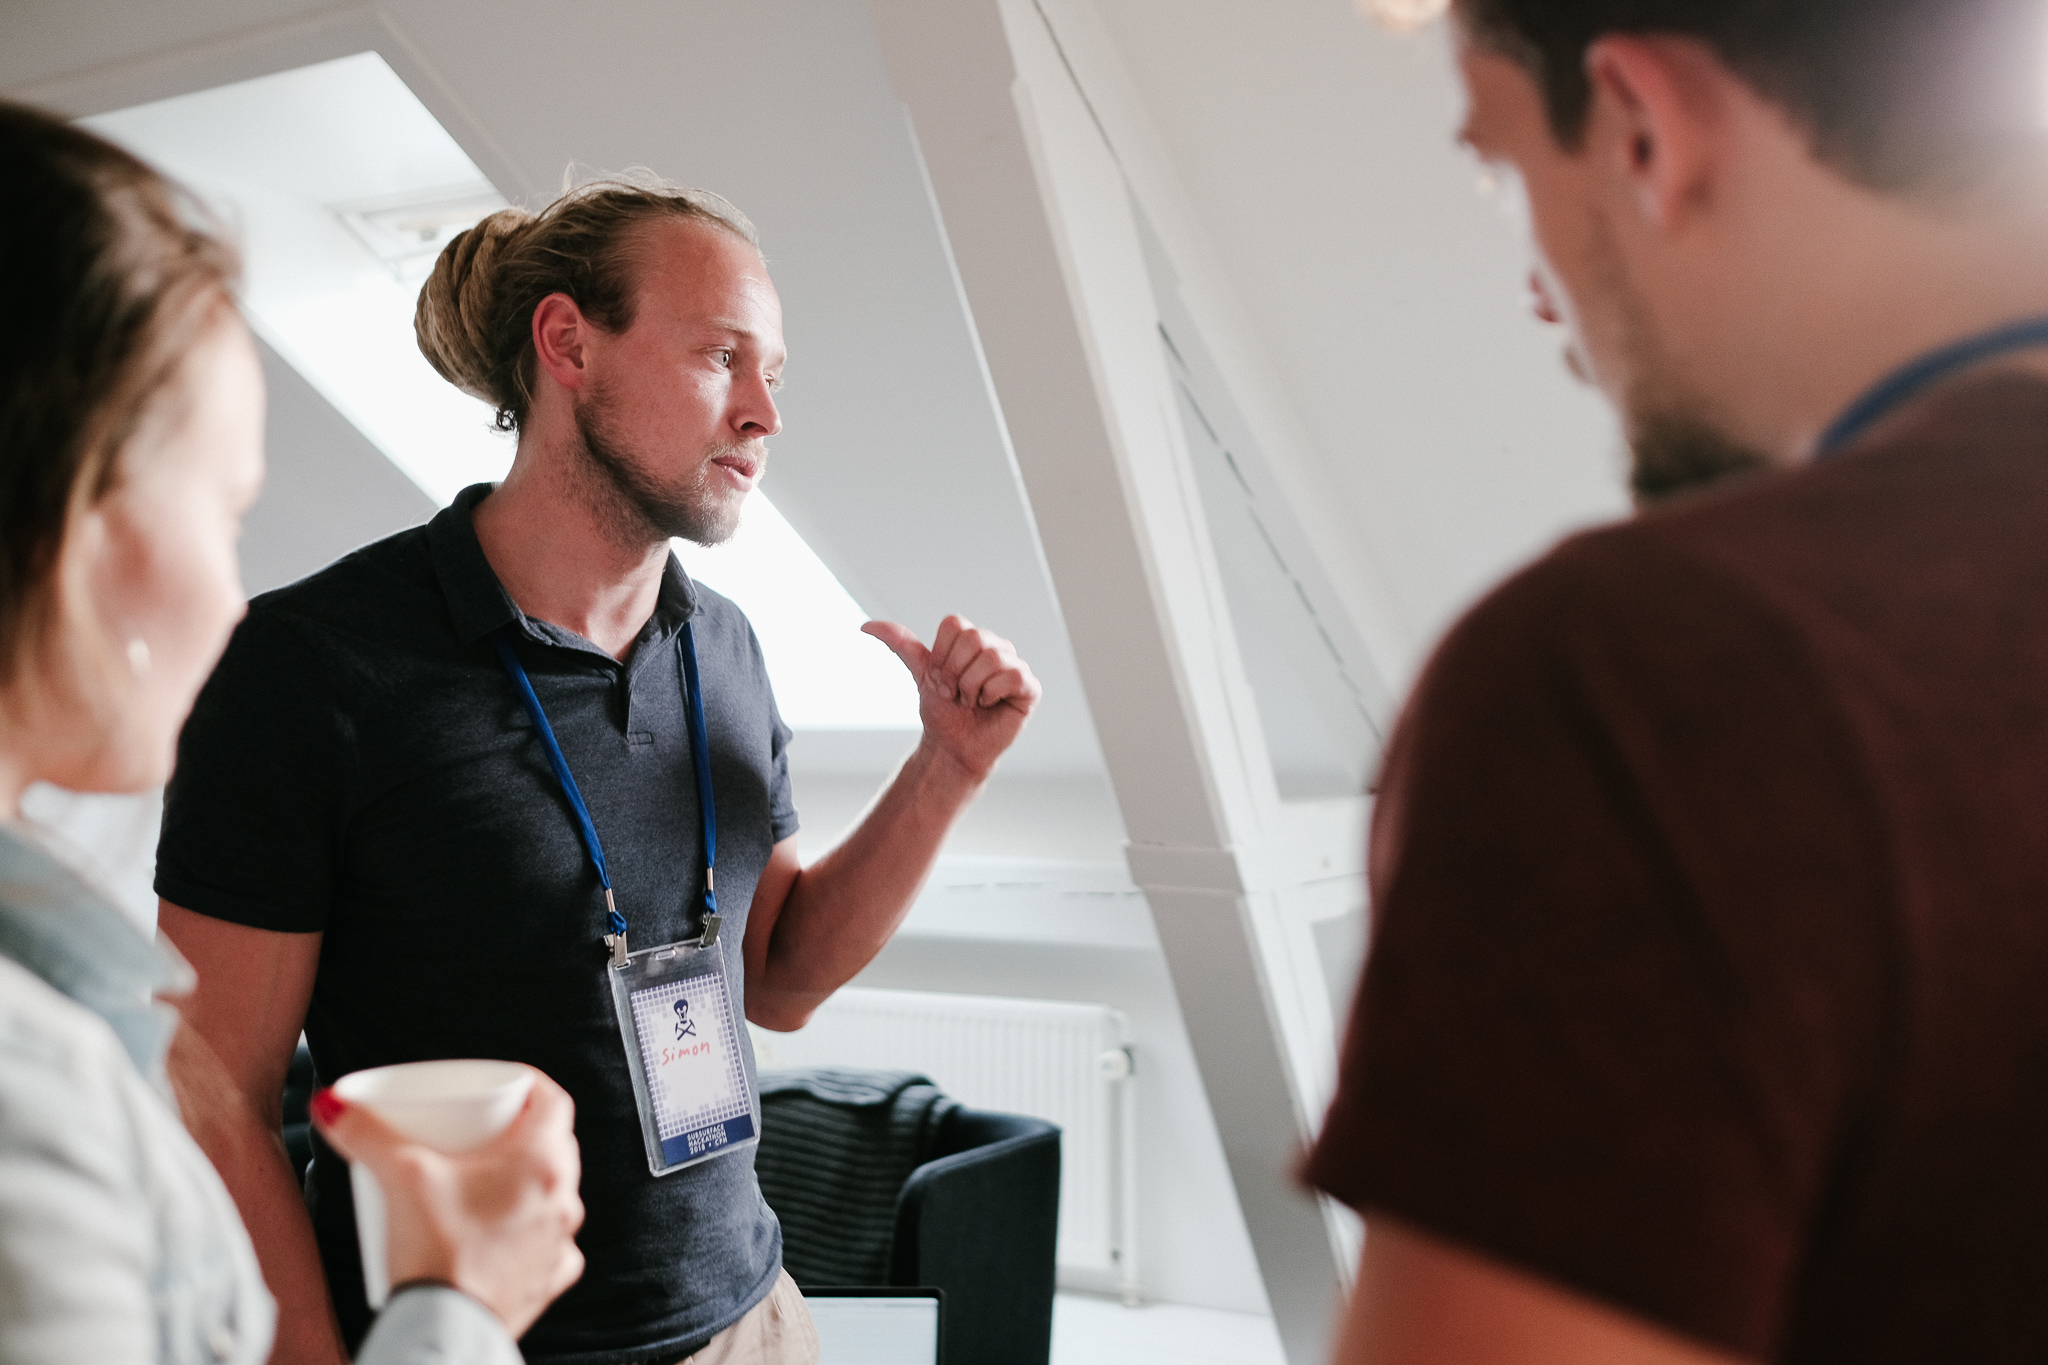
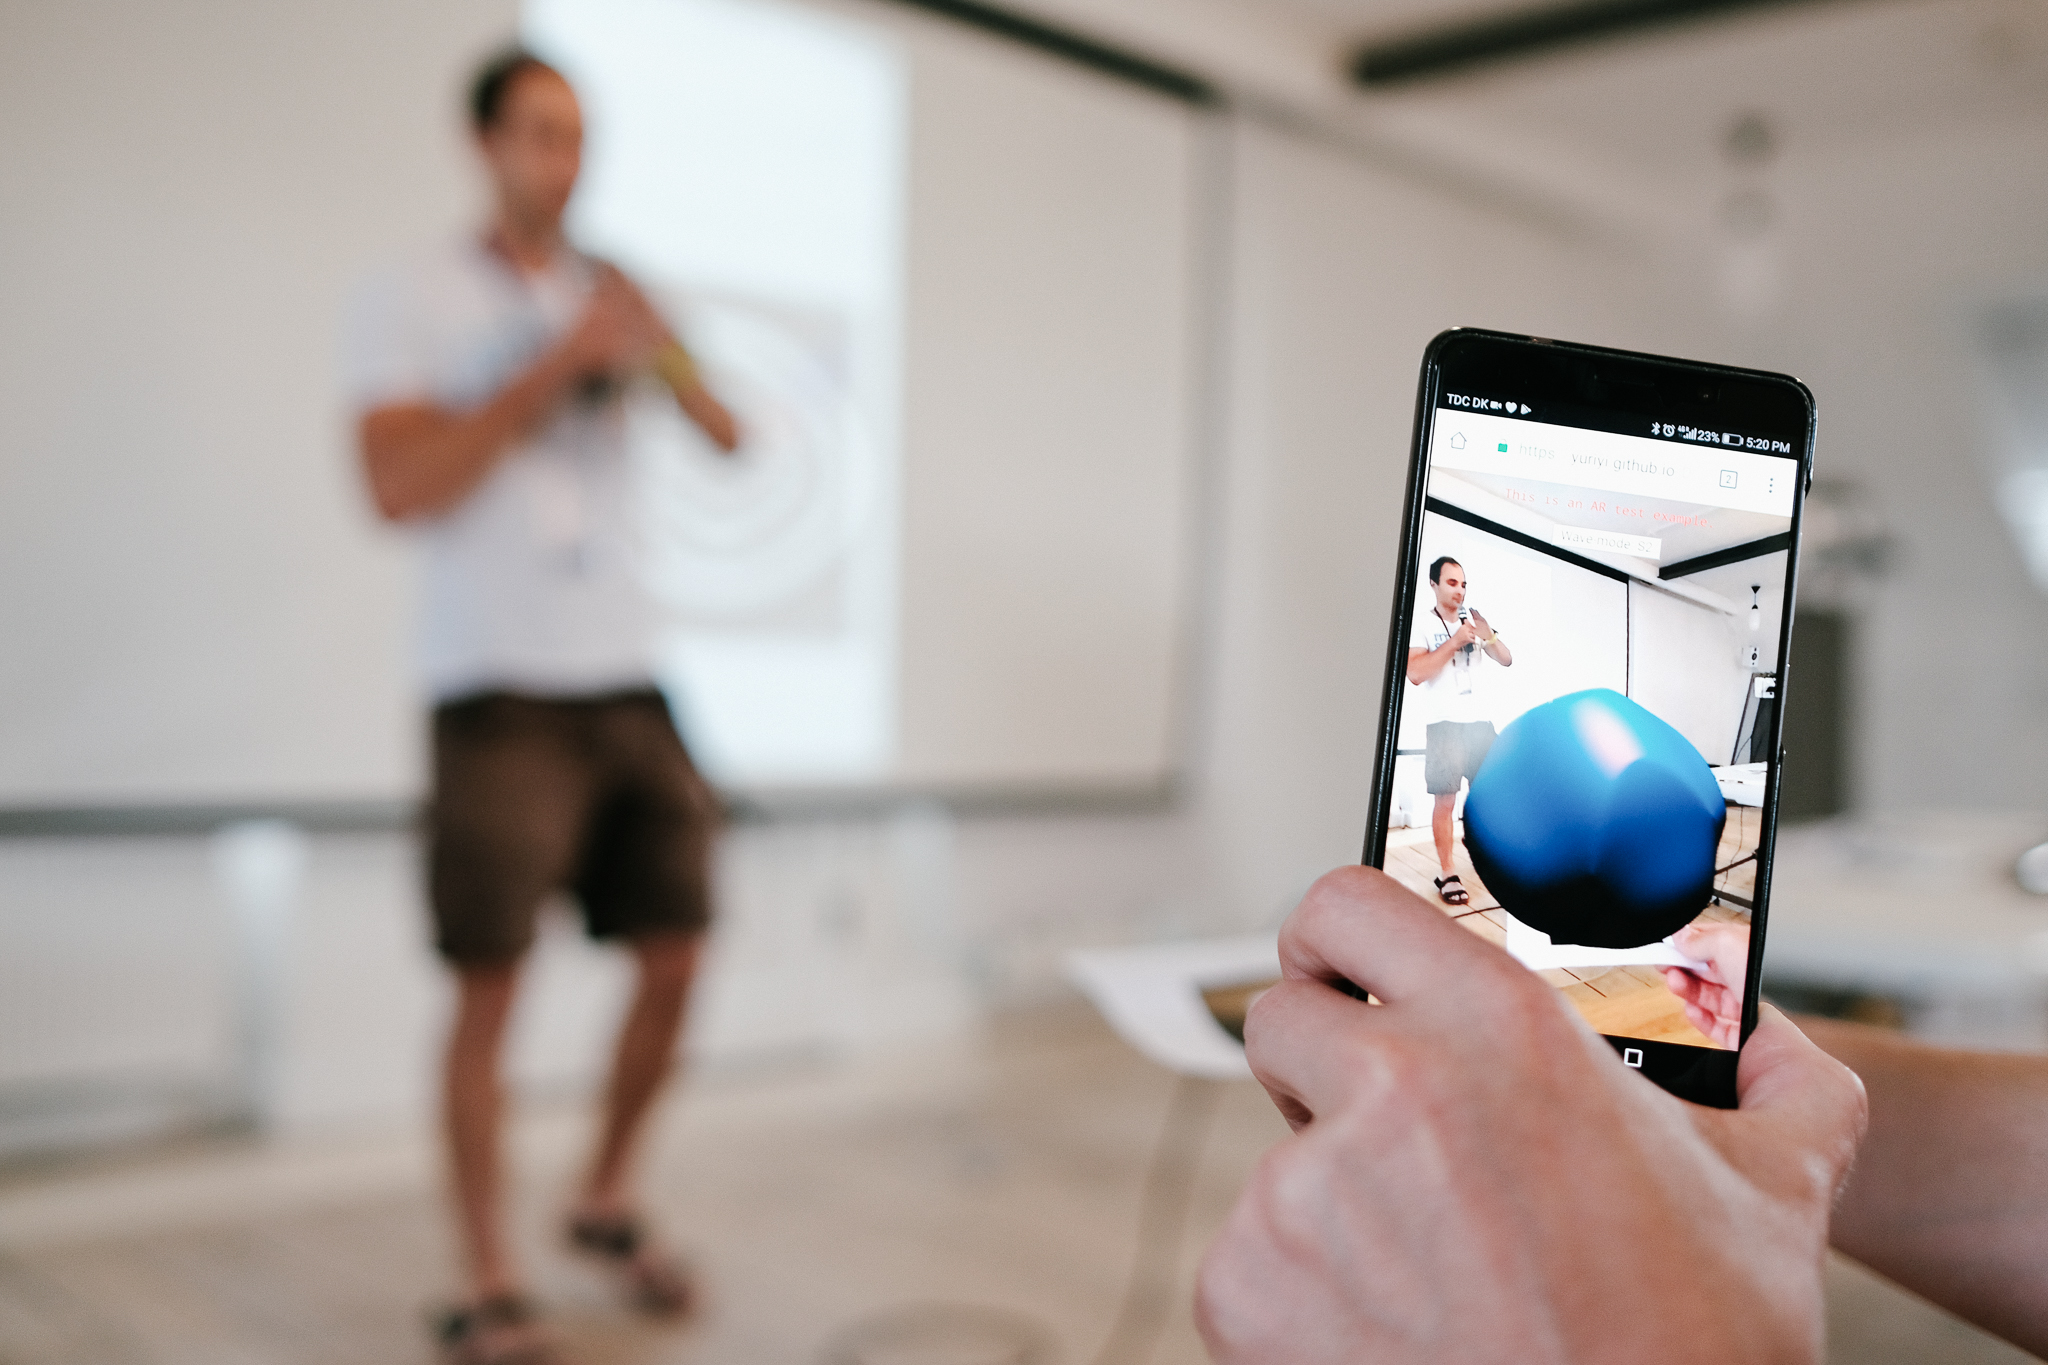
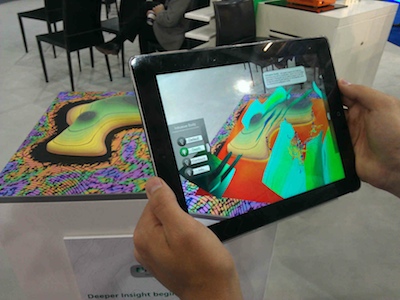
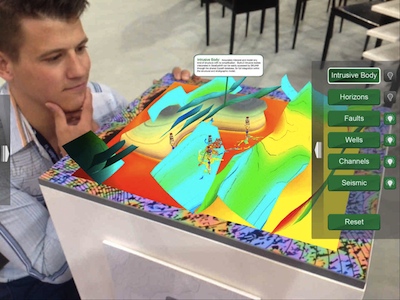
Simon Virgo (centre) and his colleagues in Aachen built an augmented reality sandbox, powered by their research group's software, Gempy. He brought it along and three teams attempted projects based on the technology. Above, some of the participants …

Simon Virgo (centre) and his colleagues in Aachen built an augmented reality sandbox, powered by their research group's software, Gempy. He brought it along and three teams attempted projects based on the technology. Above, some of the participants are having a scrum meeting to keep their project on track.


Nowhere near Nyquist

This is a guest post by my Undersampled Radio co-host, Graham Ganssle.

You can find Gram on the webLinkedInTwitterGitHub

This post is a follow up to Tuesday's post about the podcast — you might want to read that first.


Undersampled Radio was born out of a dual interest in podcasting. Matt and I both wanted to give it a shot, but we didn’t know what to talk about. We still don’t. My philosophy on UR is that it’s forumesque; we have a channel on the Software Underground where we solicit ideas, draft guests, and brainstorm about what should be on the show. We take semi-formed thoughts and give them a good think with a guest who knows more than us. Live and uncensored.

Since with words I... have not.. a way... the live nature of the show gives it a silly, laid back attitude. We attempt to bring our guests out of interview mode by asking about their intellectual curiosities in addition to their professional interests. Though the podcast releases are lightly edited, the YouTube live-stream recordings are completely raw. For a good laugh at our expense you should certainly watch one or two.

Techie deets

Have a look at the command center. It’s where all the UR magic (okay, digital trickery) happens in pre- and post-production.

It's a mess but it works!

It's a mess but it works!

We’ve migrated away from the traditional hardware combination used by most podcasters. Rather than use the optimum mic/mixer/spaghetti-of-cables preferred by podcasting operations which actually generate revenue, we’ve opted to use less hardware and do a bit of digital conditioning on the back end. We conduct our interviews via YouTube live (aka Google Hangouts on Air) then on my Ubuntu machine I record the audio through stereo mix using PulseAudio and do the filtering and editing in Audacity.

Though we usually interview guests via Google Hangouts, we have had one interviewee in my office for an in-person chat. It was an incredible episode that was filled with the type of nonlinear thinking which can only be accomplished face to face. I mention this because I’m currently soliciting another New Orleans recording session (message me if you’re interested). You buy the plane ticket to come record in the studio. I buy the beer we’ll drink while recording.

as Matt guessed there actually are paddle boats rolling by while I record. Here’s the view from my recording studio; note the paddle boat on the left.

as Matt guessed there actually are paddle boats rolling by while I record. Here’s the view from my recording studio; note the paddle boat on the left.

Forward projections

We have several ideas about what to do next. One is a live competition of some sort, where Matt and I compete while a guest(s) judge our performance. We’re also keen to do a group chat session, in which all the members of the Software Underground will be invited to a raucous, unscripted chat about whatever’s on their minds. Unfortunately we dropped the ball on a live interview session at the SEG conference this year, but we’d still like to get together in some sciencey venue and grab randos walking by for lightning interviews.

In accord with the remainder of our professional lives, Matt and I both conduct the show in a manner which keeps us off balance. I have more fun, and learn more information more quickly, by operating in a space outside of my realm of knowledge. Ergo, we are open to your suggestions and your participation in Undersampled Radio. Come join us!


The sound of the Software Underground

If you are a geoscientist or subsurface engineer, and you like computery things — in other words, if you read this blog — I have a treat for you. In fact, I have two! Don't eat them all at once.

Software Underground

Sometimes (usually) we need more diversity in our lives. Other times we just want a soul mate. Or at least someone friendly to ask about that weird new seismic attribute, where to find a Python library for seismic imaging, or how to spell Kirchhoff. Chat rooms are great for those occasions, Slack is where all the cool kids go to chat, and the Software Underground is the Slack chat room for you. 

It's free to join, and everyone is welcome. There are over 130 of us in there right now — you probably know some of us already (apart from me, obvsly). Just go to http://swung.rocks/ to sign up, and we will welcome you at the door with your choice of beverage.

To give you a flavour of what goes on in there, here's a listing of the active channels:

  • #python — for people developing in Python
  • #sharp-rocks — for people developing in C# or .NET
  • #open-geoscience — for chat about open access content, open data, and open source software
  • #machinelearning — for those who are into artificial intelligence
  • #busdev — collaboration, subcontracting, and other business opportunities 
  • #general — chat about anything to do with geoscience and/or computers
  • #random — everything else

Undersampled Radio

If you have a long commute, or occasionally enjoy being trapped in an aeroplane while it flies around, you might have discovered the joy of audiobooks and podcasts. You've probably wished many times for a geosciencey sort of podcast, the kind where two ill-qualified buffoons interview hyper-intelligent mega-geoscientists about their exploits. I know I have.

Well, wish no more because Undersampled Radio is here! Well, here:

The show is hosted by New Orleans-based geophysicist Graham Ganssle and me. Don't worry, it's usually not just us — we talk to awesome guests like geophysicists Mika McKinnon and Maitri Erwin, geologist Chris Jackson, and geopressure guy Mark Tingay. The podcast is recorded live every week or three in Google Hangouts on Air — the link to that, and to show notes and everything else — is posted by Gram in the #undersampled Software Underground channel. You see? All these things are connected, albeit in a nonlinear, organic, highly improbable way. Pseudoconnection: the best kind of connection.

Indeed, there is another podcast pseudoconnected to Software Underground: the wonderful Don't Panic Geocast — hosted by John Leeman and Shannon Dulin — also has a channel: #dontpanic. Give their show a listen too! In fact, here's a show we recorded together!

Don't have an hour right now? OK, you asked for it, here's a clip from that show to get you started. It starts with John Leeman explaining what Fun Paper Friday is, and moves on to one of my regular rants about conferences...

In case you're wondering, neither of these projects is explicitly connected to Agile — I am just involved in both of them. I just wanted to clear up any confusion. Agile is not a podcast company, for the time being anyway.

Why don't people use viz rooms?

Matteo Niccoli asked me why I thought the use of immersive viz rooms had declined. Certainly, most big companies were building them in about 1998 to 2002, but it's rare to see them today. My stock answer was always "Linux workstations", but of course there's more to it than that.

What exactly is a viz room?

I am not talking about 'collaboration rooms', which are really just meeting rooms with a workstation and a video conference phone, a lot of wires, and wireless mice with low batteries. These were one of the collaboration technologies that replaced viz rooms, and they seem to be ubiquitous (and also under-used).

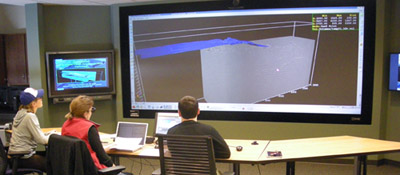
The Viz Lab at Wisconsin–Madison. Thanks to Harold Tobin for permission.A 'viz room', for our purposes here, is a dark room with a large screen, at least 3 m wide, probably projected from behind. There's a Crestron controller with greasy fingerprints on it. There's a week-old coffee cup because not even the cleaners go in there anymore. There's probably a weird-looking 3D mouse and some clunky stereo glasses. There might be some dusty haptic equipment that would work if you still had an SGI.

Why did people stop using them?

OK, let's be honest... why didn't most people use them in the first place?

  1. The rise of the inexpensive Linux workstation. The Sun UltraSPARC workstations of the late 1990s couldn't render 3D graphics quickly enough for spinning views or volume-rendered displays, so viz rooms were needed for volume interpretation and well-planning. But fast machines with up to 16GB of RAM and high-end nVidia or AMD graphics cards came along in about 2002. A full dual-headed set-up cost 'only' about $20k, compared to about 50 times that for an SGI with similar capabilities (for practical purposes). By about 2005, everyone had power and pixels on the desktop, so why bother with a viz room?
  2. People never liked the active stereo glasses. They were certainly clunky and ugly, and some people complained of headaches. It took some skill to drive the software, and to avoid nauseating spinning around, so the experience was generally poor. But the real problem was that nobody cared much for the immersive experience, preferring the illusion of 3D that comes from motion. You can interactively spin a view on a fast Linux PC, and this provides just enough immersion for most purposes. (As soon as the motion stops, the illusion is lost, and this is why 3D views are so poor for print reproduction.)
  3. They were expensive. Early adoption was throttled by expense  (as with most new technology). The room renovation might cost $250k, the SGI Onyx double that, and the projectors were $100k each. But  even if the capex was affordable, everyone forgot to include operating costs — all this gear was hard to maintain. The pre-DLP cathode-ray-tube projectors needed daily calibration, and even DLP bulbs cost thousands. All this came at a time when companies were letting techs go and curtailing IT functions, so lots of people had a bad experience with machines crashing, or equipment failing.
  4. Intimidation and inconvenience. The rooms, and the volume interpretation workflow generally, had an aura of 'advanced'. People tended to think their project wasn't 'worth' the viz room. It didn't help that lots of companies made the rooms almost completely inaccessible, with a locked door and onerous booking system, perhaps with a gatekeeper admin deciding who got to use it.
  5. Our culture of PowerPoint. Most of the 'collaboration' action these rooms saw was PowerPoint, because presenting with live data in interpretation tools is a scary prospect and takes practice.
  6. Volume interpretation is hard and mostly a solitary activity. When it comes down to it, most interpreters want to interpret on their own, so you might as well be at your desk. But you can interpret on your own in a viz room too. I remember Richard Beare, then at Landmark, sitting in the viz room at Statoil, music blaring, EarthCube buzzing. I carried on this tradition when I was at Landmark as I prepared demos for people, and spent many happy hours at ConocoPhillips interpreting 3D seismic on the largest display in Canada.  

What are viz rooms good for?

Don't get me wrong. Viz rooms are awesome. I think they are indispensable for some workflows: 

  • Well planning. If you haven't experienced planning wells with geoscientists, drillers, and reservoir engineers, all looking at an integrated subsurface dataset, you've been missing out. It's always worth the effort, and I'm convinced these sessions will always plan a better well than passing plans around by email. 
  • Team brainstorming. Cracking open a new 3D with your colleagues, reviewing a well program, or planning the next year's research projects, are great ways to spend a day in a viz room. The broader the audience, as long as it's no more than about a dozen people, the better. 
  • Presentations. Despite my dislike of PowerPoint, I admit that viz rooms are awesome for presentations. You will blow people away with a bit of live data. My top tip: make PowerPoint slides with an aspect ratio to fit the entire screen: even PowerPoint haters will enjoy 10-metre-wide slides.

What do you think? Are there still viz rooms where you work? Are there 'collaboration rooms'? Do people use them? Do you?

Highlights from EuroSciPy

In July, Agile reported from SciPy in Austin, Texas, one of several annual conferences for people writing scientific software in the Python programming language. I liked it so much I was hungry for more, so at the end of my recent trip to Europe I traveled to the city of Cambridge, UK, to participate in EuroSciPy.

The conference was quite a bit smaller than its US parent, but still offered 2 days of tutorials, 2 days of tech talks, and a day of sprints. It all took place in the impressive William Gates Building, just west of the beautiful late Medieval city centre, and just east of Schlumberger's cool-looking research centre. What follows are my highlights...

Okay you win, Julia

Steven Johnson, an applied mathematician at MIT, gave the keynote on the first morning. His focus was Julia, the current darling of the scientific computing community, and part of a new ecosystem of languages that seek to cooperate, not compete. I'd been sort of ignoring Julia, in the hope that it might go away and let me focus on Python, the world's most useful language, and JavaScript, the world's most useful pidgin... but I don't think scientists can ignore Julia much longer.

I started writing about what makes Julia so interesting, but it turned into another post — up next. Spoiler: it's speed. [Edit: Here is that post! Julia in a nutshell.]

Learning from astrophysics

The Astropy project is a truly inspiring community — in just 2 years it has synthesized a dozen or so disparate astronomy libraries into an increasingly coherent and robust toolbox for astronomers and atrophysicists. What does this mean?

  • The software is well-tested and reliable.
  • Datatypes and coordinate systems are rich and consistent.
  • Documentation is useful and evenly distributed.
  • There is a tangible project to rally developers and coordinate funding.

Geophysicists might even be interested in some of the components of Astropy and the related SunPy project, for example:

  • astropy.units, just part of the ever-growing astropy library, as a unit conversion and quantity handler to compare with pint.
  • sunpy datatypes map and spectra for types of data that need special methods.
  • asv is a code-agnostic benchmarking library, a bit like freebench.

Speed dating for scientists

Much of my work is about connecting geoscientists in meaningful collaboration. There are several ways to achieve this, other than through project work: unsessions, wikis, hackathons, and so on. Now there's another way: speed dating.

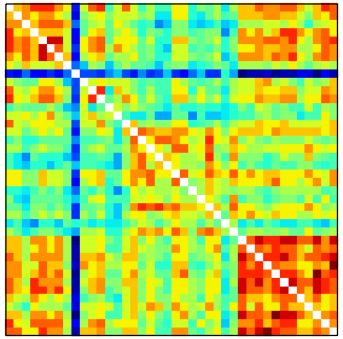
Okay, it doesn't quite get to the collaboration stage, but Vaggi and his co-authors shared an ingenious way to connect people and give their professional relationship the best chance of success (an amazing insight, a new algorithm, or some software). They asked everyone at a small 40-person conference to complete a questionnaire that asked, among other things, what they knew about, who they knew, and, crucially, what they wanted to know about. Then they applied graph theory to find the most desired new connections (the matrix shows the degree of similarity of interests, red is high), and gave the scientists five 10-minute 'dates' with scientists whose interests overlapped with theirs, and five more with scientists who knew about fields that were new to them. Brilliant! We have to try this at SEG.

Vaggi, F, T Schiavinotto, A Csikasz-Nagy, and R Carazo-Salas (2014). Mixing scientists at conferences using speed dating. Poster presentation at EuroSciPy, Cambridge, UK, August 2014. Code on GitHub.

Vaggi, F, T Schiavinotto, J Lawson, A Chessel, J Dodgson, M Geymonat, M Sato, R Carazo Salas, A Csikasz Nagy (2014). A network approach to mixing delegates at meetings. eLife, 3. DOI: 10.7554/eLife.02273

Other highlights

  • sumatra to generate and keep track of simulations.
  • vispy, an OpenGL-based visualization library, now has higher-level, more Pythonic components.
  • Ian Osvald's IPython add-on for RAM usage.
  • imageio for lightweight I/O of image files.
  • nbagg backend for matplotlib version 1.4, bringin native (non-JS) interactivity.
  • An on-the-fly kernel chooser in upcoming IPython 3 (currently in dev).

All in all, the technical program was a great couple of days, filled with the usual note-taking and hand-shaking. I had some good conversations around my poster on modelr. I got a quick tour of the University of Cambridge geophysics department (thanks to @lizzieday), which made me a little nostalgic for British academic institutions. A fun week!

Fibre optic seismology at #GeoCon14

We've been so busy this week, it's hard to take time to write. But for the record, here are two talks I liked yesterday at the Canada GeoConvention. Short version — Geophysics is awesome!

DAS good

Todd Bown from OptaSense gave an overview of the emerging applications for distributed acoustic sensing (DAS) technology. DAS works by shining laser pulses down a fibre optic cable, and measuring the amount of backscatter from impurities in the cable. Tiny variations in strain on the cable induced by a passing seismic wave, say, are detected as subtle time delays between light pulses. Amazing.

Fibre optic cables aren't as sensitive as standard geophone systems (yet?), but compared to conventional instrumentation, DAS systems have several advantages:

  • Deployment is easy: fibre is strapped to the outside of casing, and left in place for years.
  • You don't have to re-enter and interupt well operations to collect data.
  • You can build ultra-long receiver arrays — as long as your spool of fibre.
  • They are sensitive to a very broad band of signals, from DC to kilohertz.

Strain fronts

Later in the same session, Paul Webster (Shell) showed results from an experiment that used DAS as a fracture diagnosis tool. That means you can record for minutes, hours, even days; if you can cope with all that data. Shell has accumulated over 300 TB of records from a handful of projects, and seems to be a leader in this area.

By placing a cable in one horizontal well in order to listen to the frac treatment from another, the cable can effectively designed to record data similar to a conventional shot gather, except with a time axis of 30 minutes. On the gathers he drew attention to slow-moving arcuate events that he called strain fronts. He hypothesized a number of mechanisms that might cause these curious signals: the flood of fracking fluids finding their way into the wellbore, the settling and closing creep of rock around proppant, and so on. This work is novel and important because it offers insight into the mechanical behavoir of engineered reservoirs, not just during the treatment, but long after.

Why is geophysics awesome? We can measure sound with light. A mile underground. That's all.

Key technology trends in earth science

Yesterday, I went to the workshop entitled, Grand challenges and research opportunities in geophysics, organized by Cengiz Esmersoy, Wafik Beydoun, Colin Sayers, and Yoram Shoham. I was curious if there'd be overlap with the Unsolved Problems Unsession we hosted in Calgary, and had reservations about it being an overly fluffy talkshop, but it was much better than I expected.

Ken Tubman, VP of Geosciences and Reservoir Engineering at ConocoPhillips, gave a splendid talk to open the session. But it was the third talk of the session, from Mark Koelmel, General Manager of Earth Sciences at Chevron, that resonated most with me. He highlighted 5 trends in applied earth science.

Data and information management

Data volumes are expanding with Moore's law. Chevron has more than 15 petabytes of data, by 2020 they will have more than 100PB. Koelmel postulated that spatial metadata and tagging will become pervasive and our data formats will have to evolve accordingly. Instead of managing ridiculously large amounts of data, a better solution may be to 'tag it and chuck it in the closet' — Google's approach to the web (and we know the company has been exploring the use of Hadoop). Beyond hardware, he stressed that new industry standards are needed now. The status quo is holding us back.

Full azimuth seismic data

Only recently have we been able to wield the computing power to deal with the kind of processes needed for full-waveform inversion. It's not only because of data volumes that new processing facilities will not be cheap — or small. He predicted processing centres that resemble small cities in terms of their power consumption. An interesting notion of energy for energy, and the reason for recent massive growth in Google's power production capability. (Renewables for power, oil for cooling... how funny would that be?)

Interpretive seismic processing and imaging

Interpretation, and processing are actually the same thing. The segmentation of seismic technology will have to be stitched back together. Imagine the interpreter working on field data, with a mixing board to produce just the right image for today's work. How will service companies (who acquire data and make images), and operators (who interpret data and make prospects) merge their efforts? We may have to consider different business relationships.

Full-cycle interpretation systems

The current state of integration is sequential at best, each node in a workflow produces static inputs for the next step, with minimal iteration in between. Each component of the sequence typically ends with 'throwing things over the wall' to the next node. With this process, the uncertainties are cumulative throughout, which is unnerving because we don't often know what the uncertainties are. Koelmel's desired future state is one of seamless geophysical processing, static model-building, and dynamic reservoir simulation. It won't reduce uncertainties altogether, but by design it will make them easier to identify and addressed.

Intellectual property

The number of patents filed in this industry has more than tripled in the last decade. I assumed Koelmel was going to give a Big Oil lecture on secrecy and patents, touting them as a competitive advantage. He said just the opposite. He asserted that industries with excessive patenting (think technology, and Big Pharma) make innovation difficult. Chevron is no stranger to the patent processes, filing 125 patents both in 2012 and in 2011, but this is peanuts compared to Schlumberger (462 in 2012) and IBM (6457 in 2012). 

The challenges geophysicists are facing are not our own. They stem from the biggest problems in the industry, which are of incredible importance to mankind. Perhaps expanding the value proposition to such heights is more essential than ever. Geophysics matters.

July linkfest

It's another linkfest! All the good stuff from our newsfeed over the last few weeks.

We mentioned the $99 supercomputer in April. The Adapteva Parellella is a bit like a Raspberry Pi, but with the added benefit of a 16- or 64-core coprocessor. The machines are now shipping, and a version is available for pre-order.

In April we also mentioned the University of Queensland's long-running pitch drop experiment. But on 18 July a drop fell from another similar experiment, but which has even slower drops...

A gem from history:

In the British Islands alone, twice as much oil as the navy used last year could be produced from shale. — Winston Churchill, July 1913.

This surprising quote was doing the rounds last week (I saw it on oilit.com), but of course Churchill was not fortelling hydraulic fracturing and the shale gas boom; he was talking about shale oil. But it's still Quite Interesting.

Chris Liner's blog is more than quite interesting — and the last two posts have been especially excellent. The first is a great tutorial video describing a semi-automatic rock volume estimation workflow. You can get grain size and shape data from the same tool (tip: FIJI is the same but slightly awesomer). And the most recent post is about a field school in the Pyrenees, a place I love, and contains some awesome annotated field photos from an iPhone app called Theodolite.

Regular readers will already know about the geophysics hackathon we're organizing in Houston in September, timed perfectly as a pre-SEG brain workout. You don't need to be a coder to get involved — if you're excited by the idea of creating new apps for nerds like you, then you're in! Sign up at hackathon.io.

If you crave freshness, then check my Twitter feed or my pinboard. And if you have stuff to share, use the comments or get in touch — or jump on Twitter yourself!

Geoscience, reservoir engineering, and code

We’re in the middle of a second creative revolution driven by technology. “Code” is being added to the core creative team of art and copy, and the work being made isn't like the ads we're used to. Code is enabling the re-imagination of everything. Aman Govil, Art, Copy & Code

Last year at Strata I heard how The Guardian newspaper has put a team of coders — developers and visualization geeks — at the centre of their newsroom. This has transformed their ability to put beautiful and interactive graphics at the heart of the news, which in turn transforms their readers' ability to absorb and explore the stories.

At the risk of sounding nostalgic, I remember when all subsurface teams had a dedicated and über-powerful tech, sometimes two. They could load data, make maps, hack awk scripts, and help document projects. Then they started disappearing, and my impression is that today most scientists have to do the fiddly stuff themselves. Woefully inefficiently. 

The parable of the coder

Give someone 20 sudoku to solve. They'll sit down and take a day to solve them. At the end, they'll hate their job, and possibly you, but at least you'll have your solutions.

Now, give a coder 20 sudoku to solve. They'll sit down and take a week to solve them — much slower. The difference is that they'll have solved every possible sudoku. What's more, they'll be happy. And you can give them 10,000 more on Monday.

Hire a coder

The fastest way out of the creeping inefficiency is to hire as many coders as you can. I fervently believe that every team should have a coder. Not to build software, not exactly. But to help build quick, thin solutions to everyday problems — in a smart way. Developers are special people. They are good at solving problems in flexible, reusable, scalable ways. Not with spreadsheets and shared drives, but with databases and APIs. If nothing else, having more coders around the place might catalyse the shabby pace of innovation and entrepreneurship in subsurface geoscience and engineering.

Do your team a favour — make the next person you hire a developer.

Image: Licensed CC-BY by Héctor Rodríguez, Wikimedia Commons.

EAGE 2013 in a nutshell

I left London last night for Cambridge. On the way, I had a chance to reflect on the conference. The positive, friendly vibe, and the extremely well-run venue. Wi-Fi everywhere, espresso machines and baristas keeping me happy and caffeinated.

Knowledge for sale

I saw no explicit mention of knowledge sharing per se, but many companies are talking about commoditizing or productizing knowledge in some way. Perhaps the most noteworthy was an update from Martyn Millwood Hargrave at Ikon's booth. In addition to the usual multi-client reports, PowerPoint files, or poorly architected database, I think service companies are still struggling to find a model where expertise and insight can be included as a service, or at least a value-add. It's definitely on the radar, but I don't think anyone has it figured out just yet.

Better than swag

Yesterday I pondered the unremarkability of carrot-and-ginger juice and Formula One pit crews. Paradigm at least brought technology to the party. Forget Google Glass, here's some augmented geoscience reality:

Trends good and bad

This notion of 3D seismic vizualization and interpretation is finally coming to gathers. The message: if you are not going pre-stack, you are missing out. Pre-stack panels are being boasted in software demos by the likes of DUG, Headwave, Transform, and more. Seems like this trend has been moving in slow motion for about a decade.

Another bandwagon is modeling while you interpret. I see this as an unfeasible and potentially dangerous claim, but some technologies companies are creating tools and workflows to fast-track the seismic interpretation to geologic model building workflows. Such efficiencies may have a market, but may push hasty solutions down the value chain. 

What do you think? What trends do you detect in the subsurface technology space?