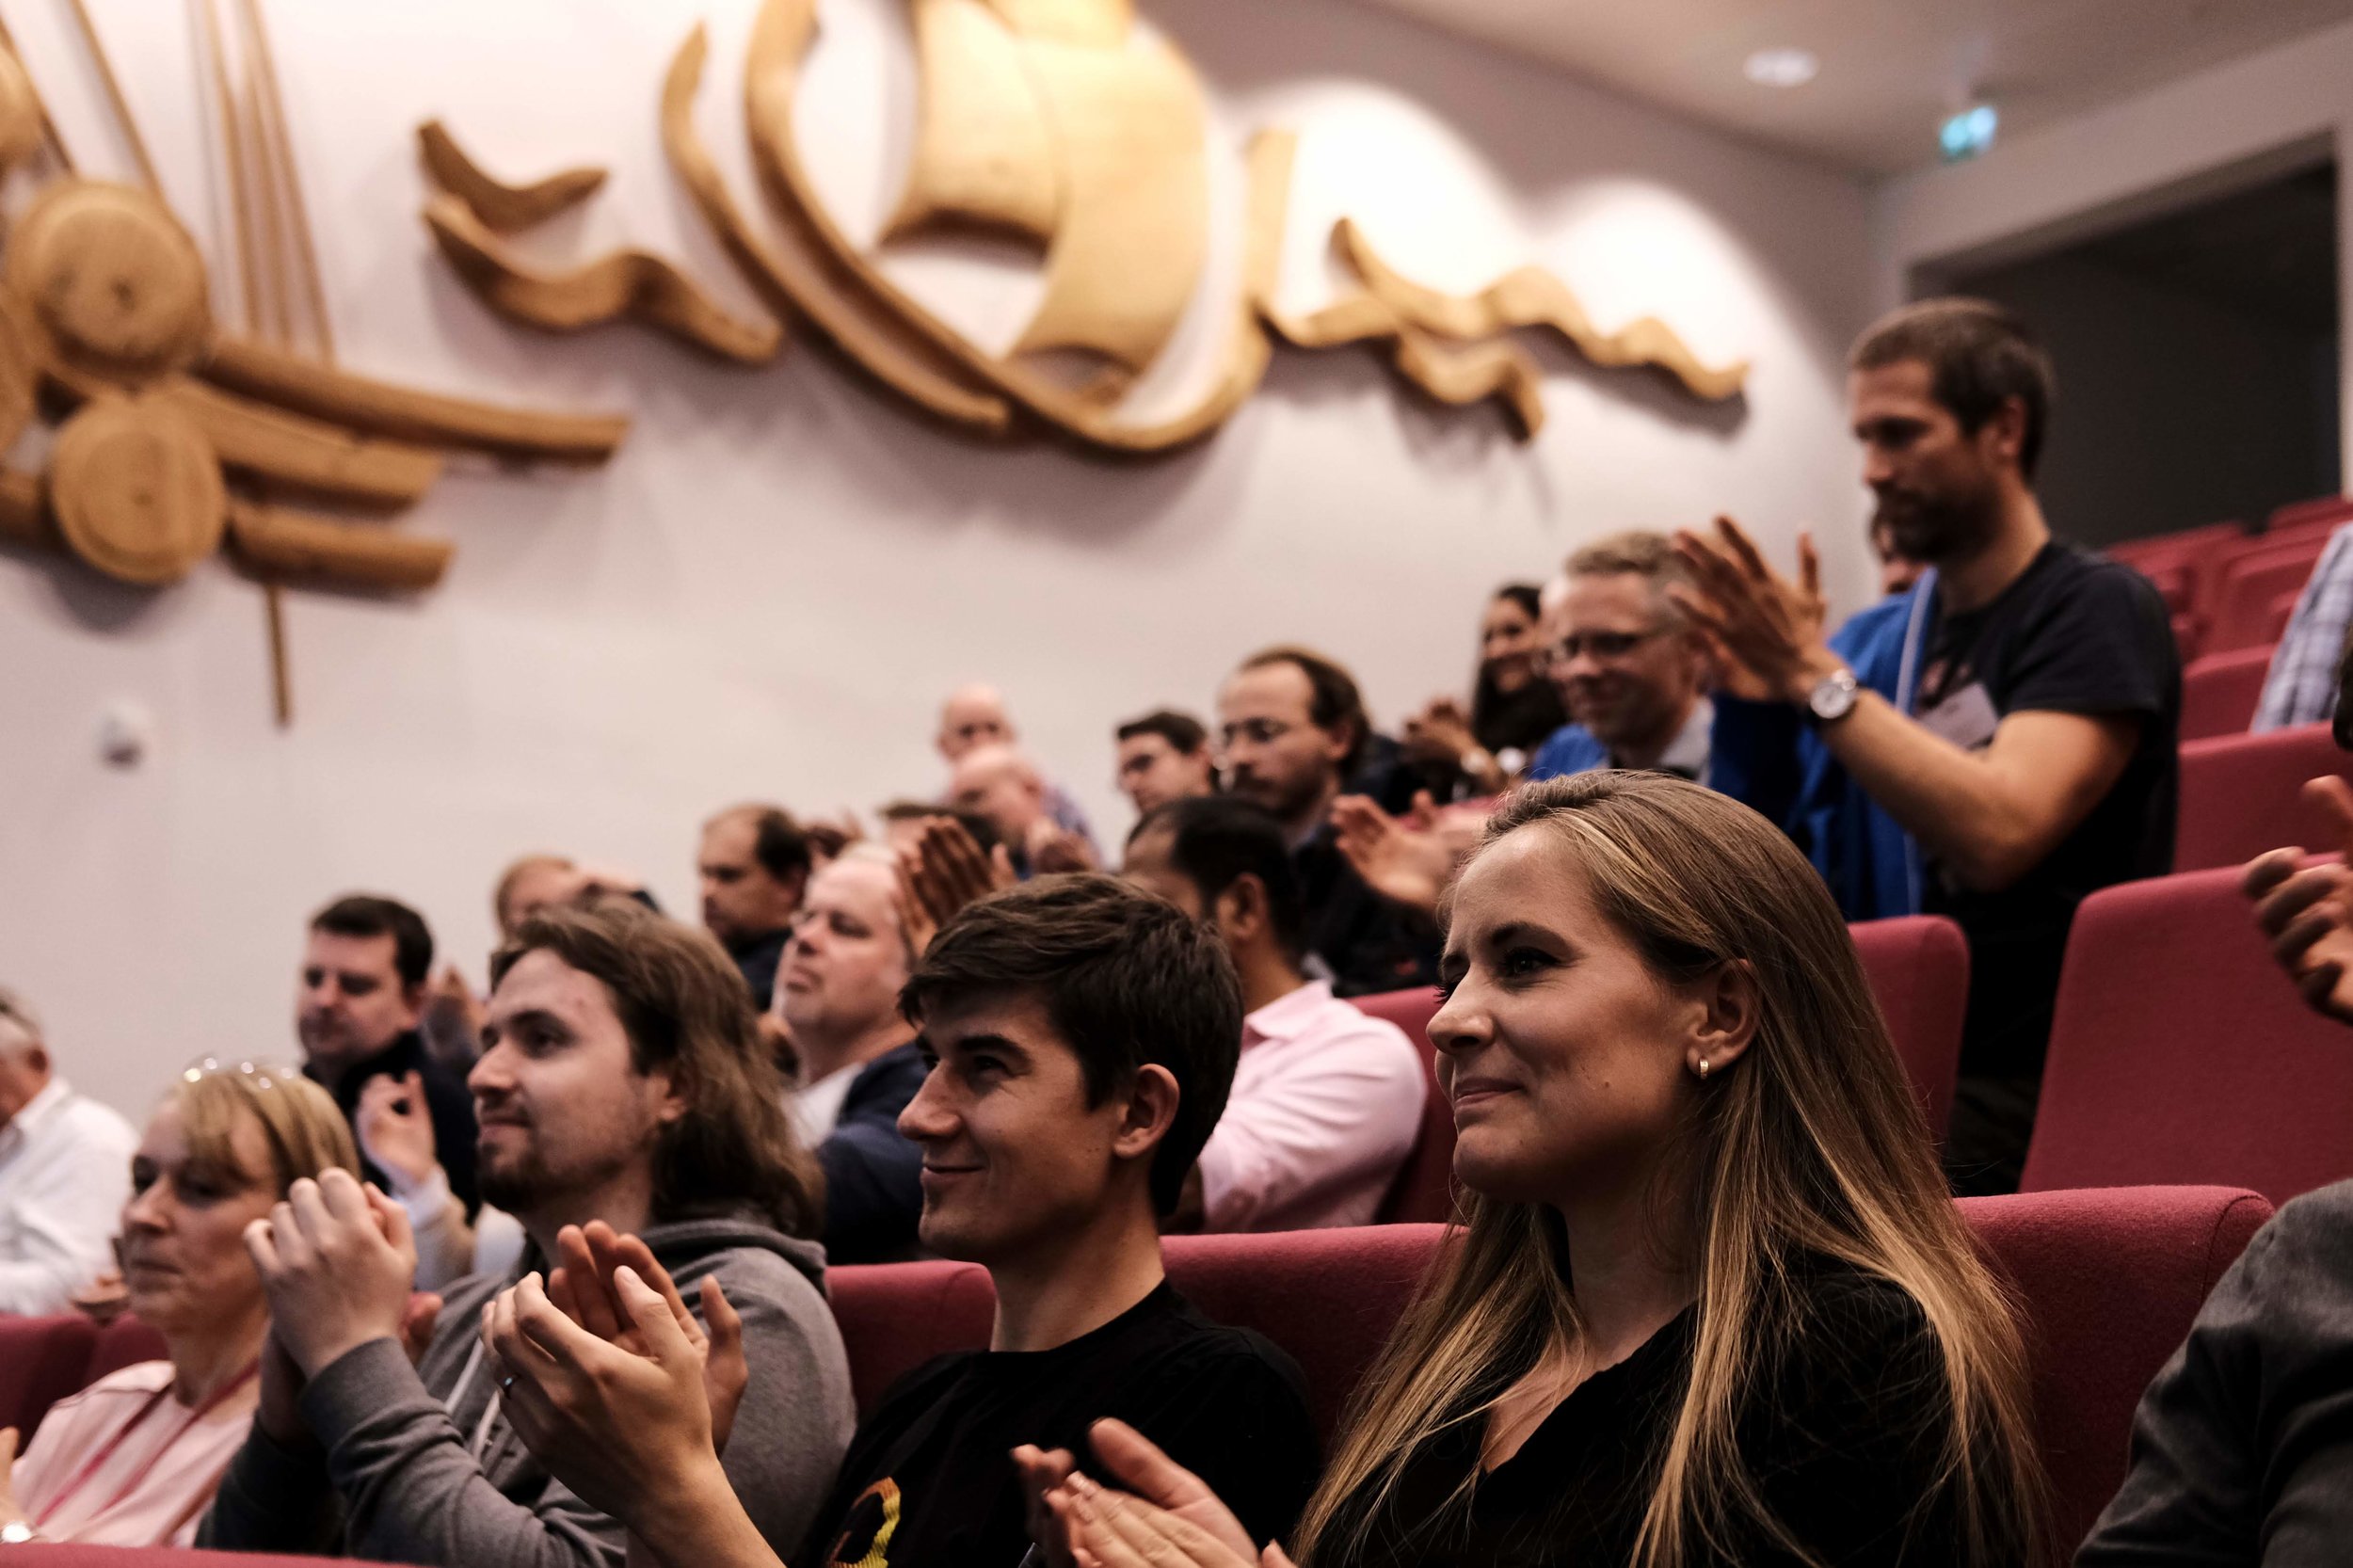
TRANSFORM 2019

DSC_6548.jpg

Yesterday I announced that we’re hatching a new plan. The next thing. Today I want to tell you about it.

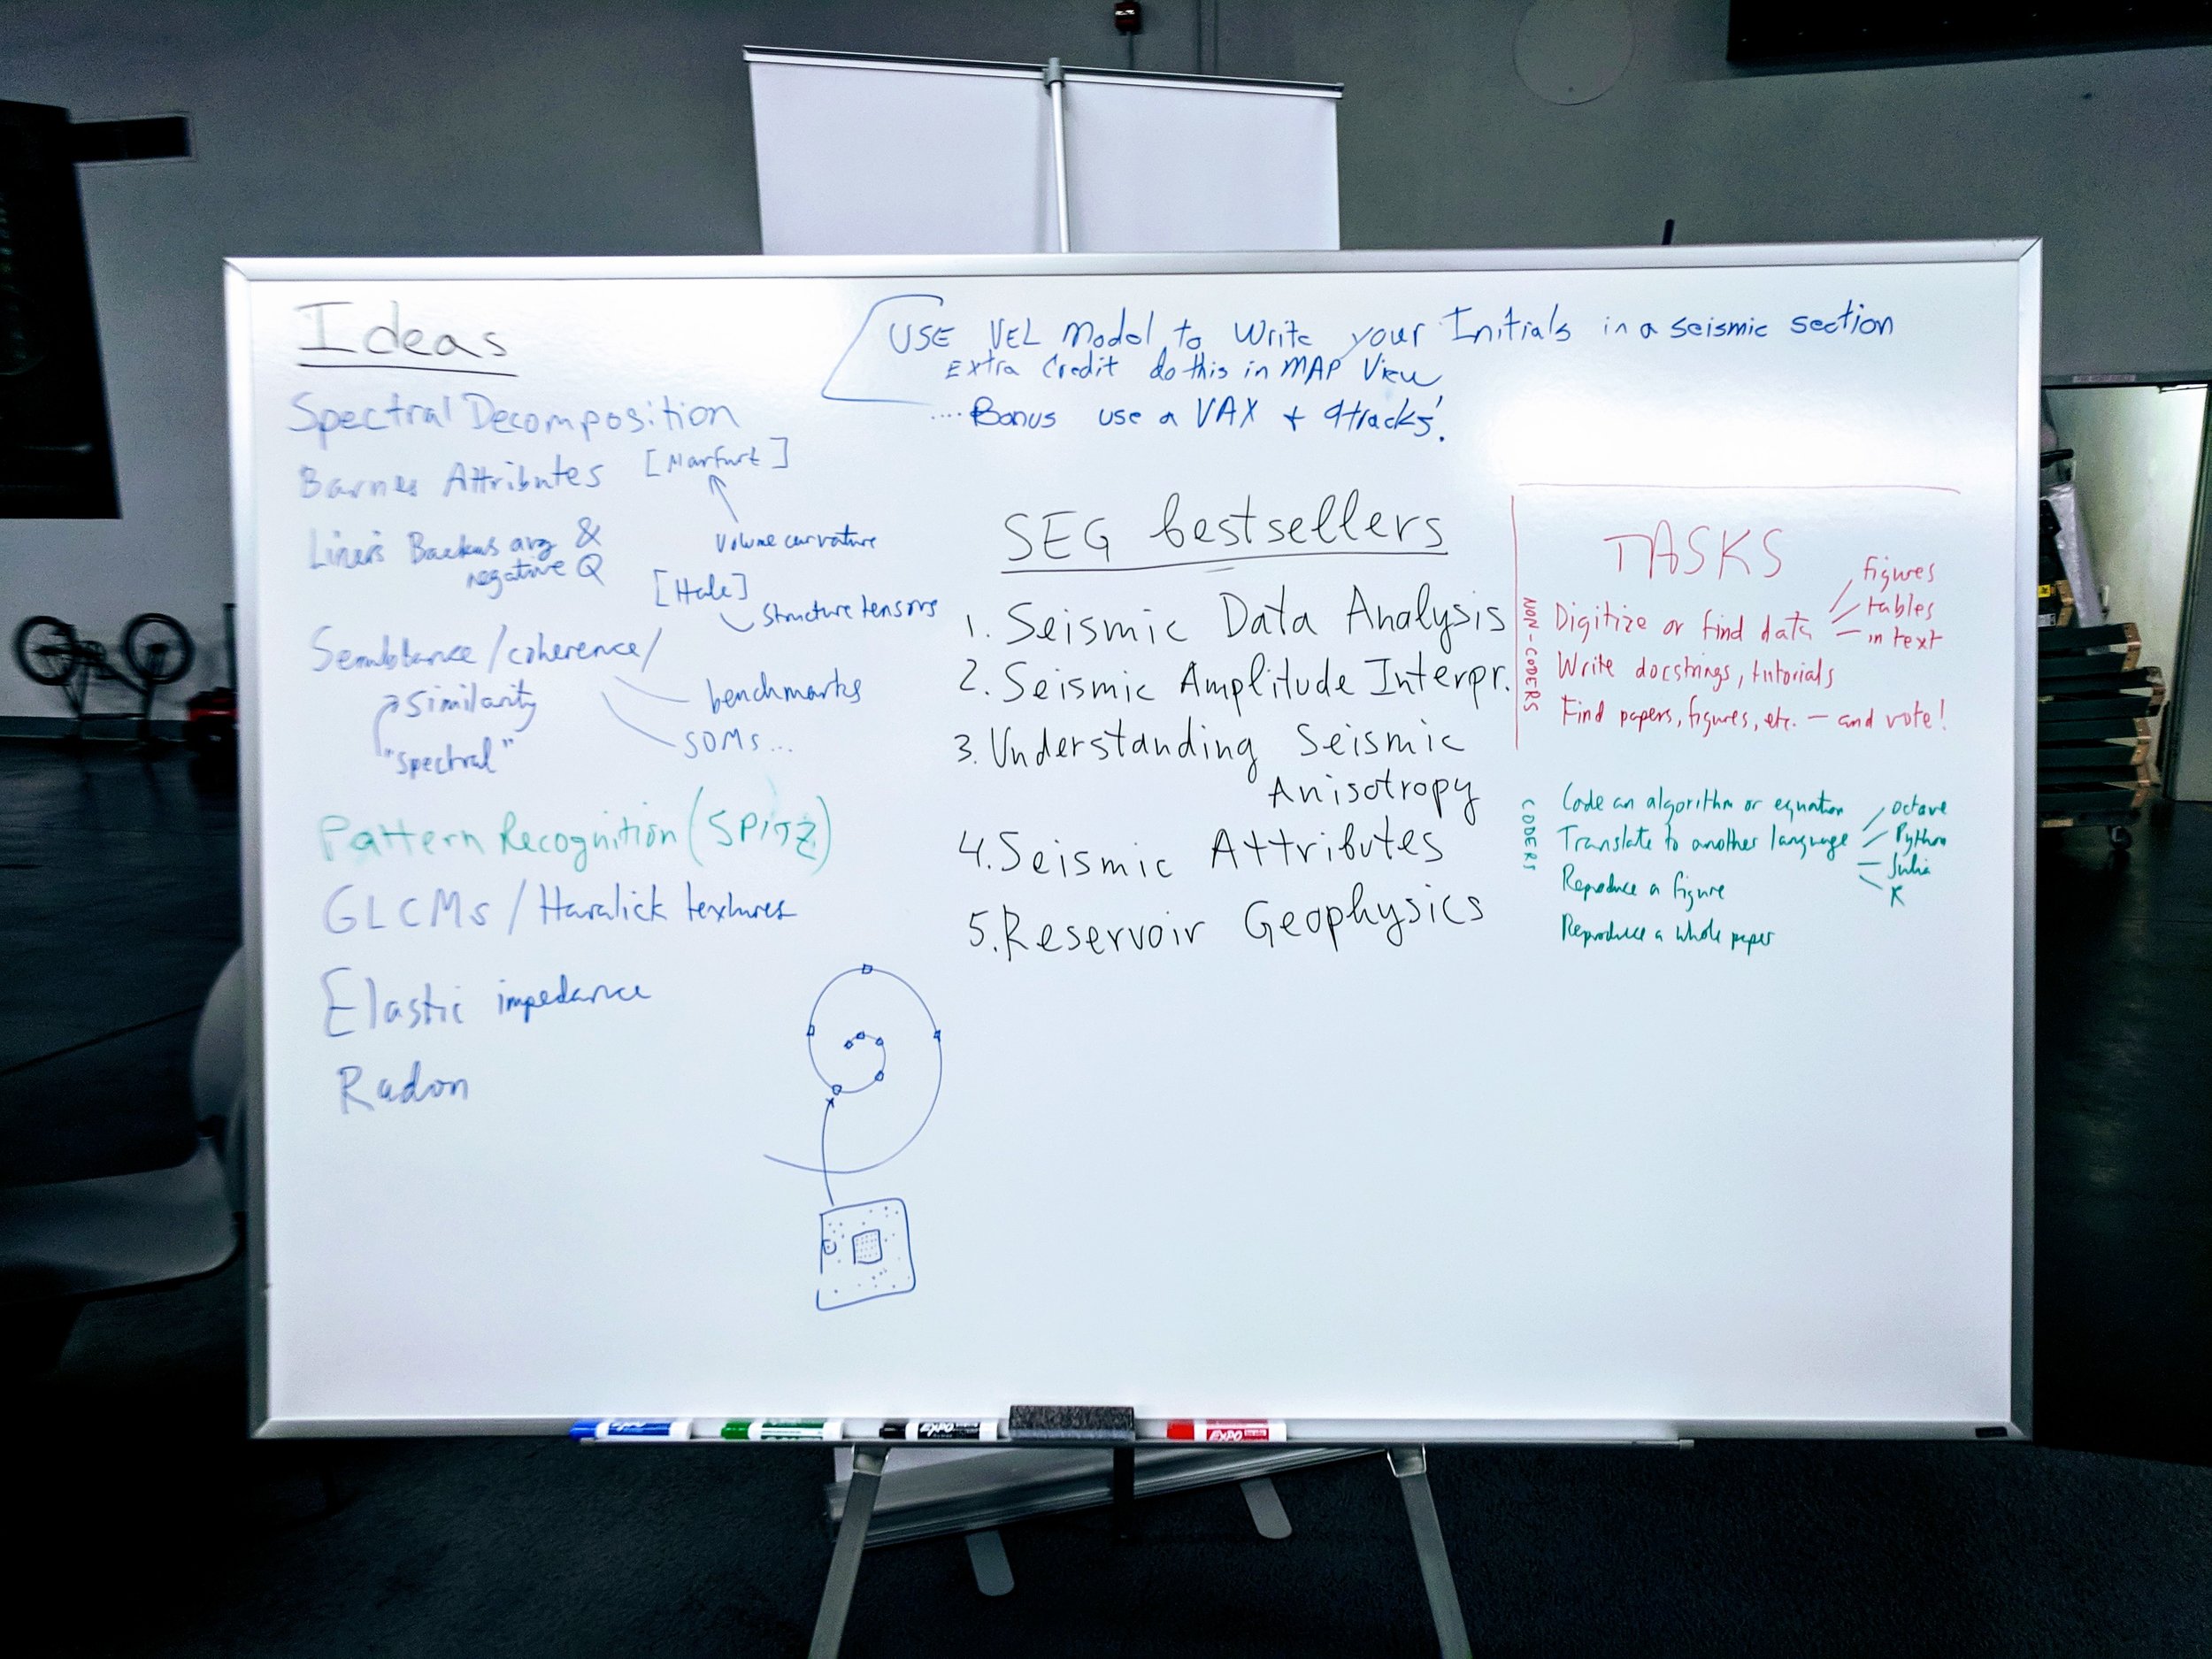
The project has the codename TRANSFORM. I like the notion of transforms: functions that move you from one domain to another. Fourier transforms. Wavelet transforms. Digital subsurface transforms. Examples:

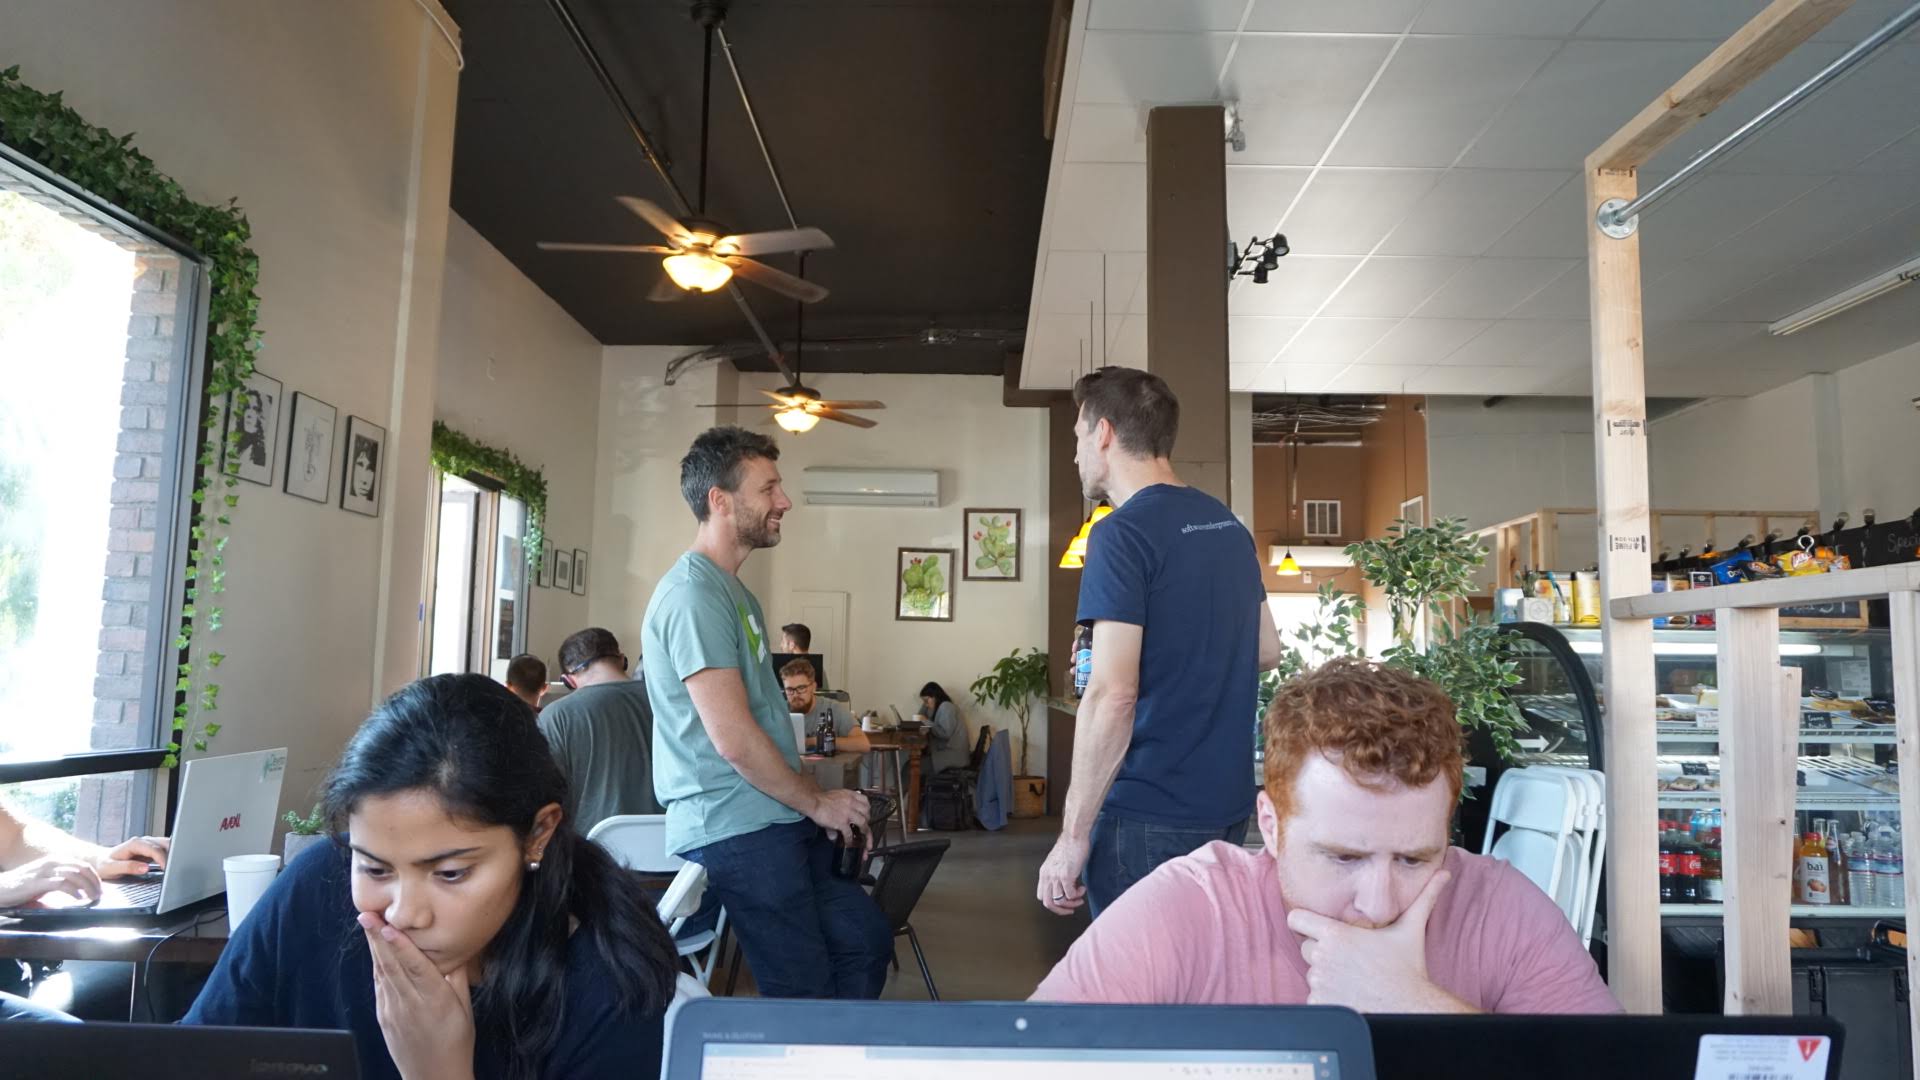
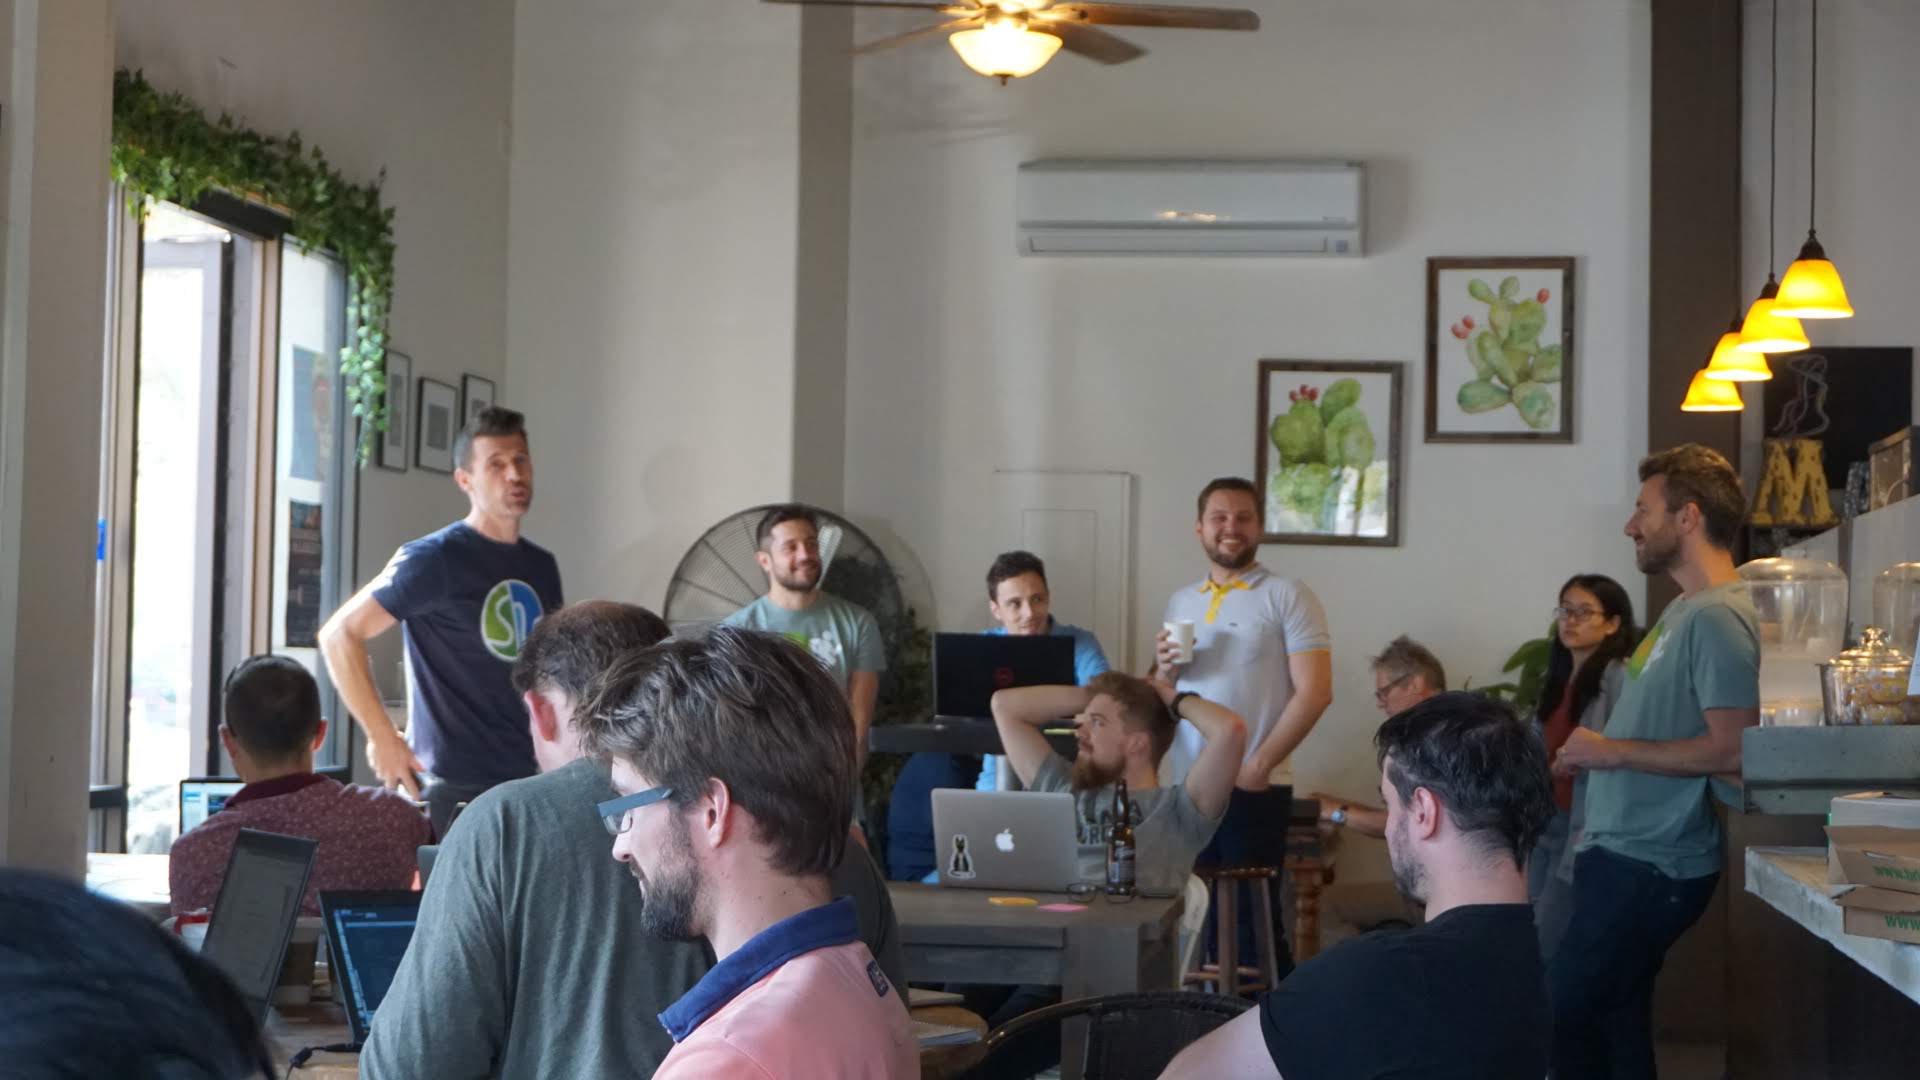
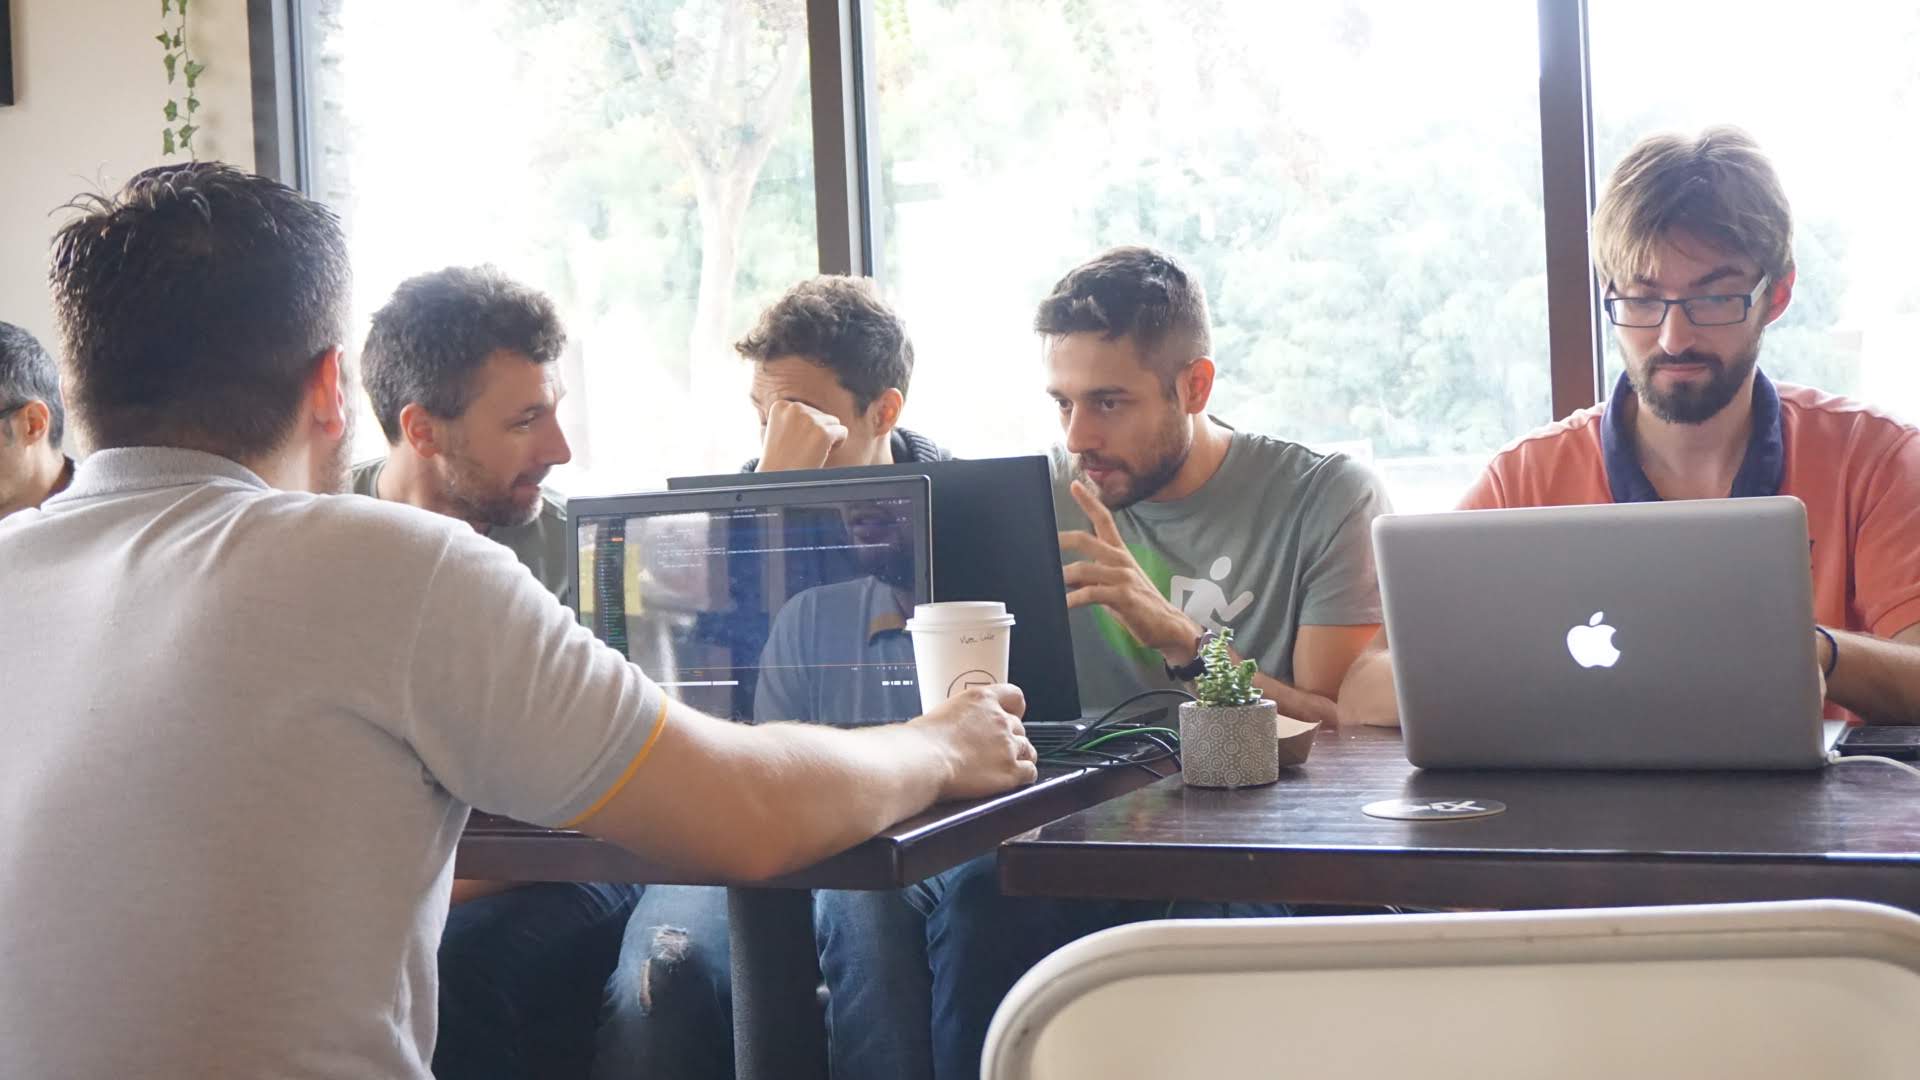
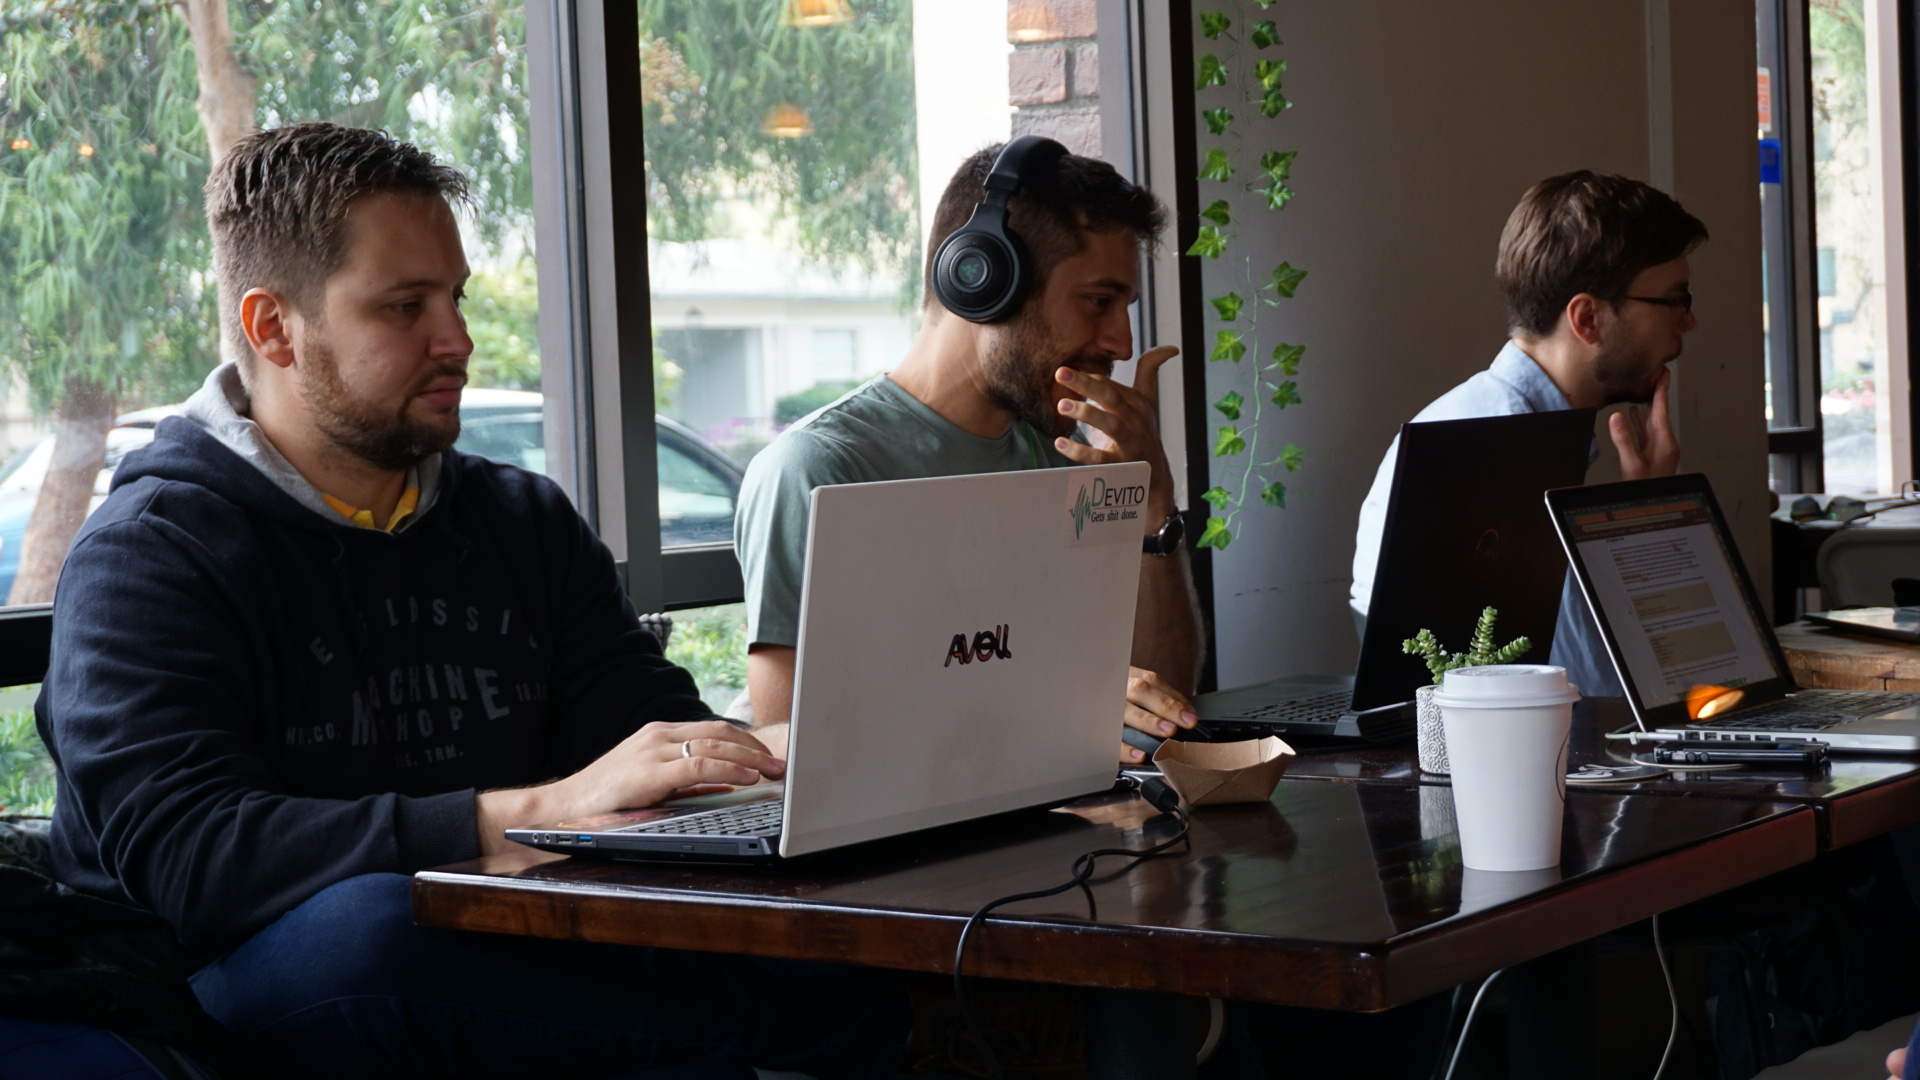
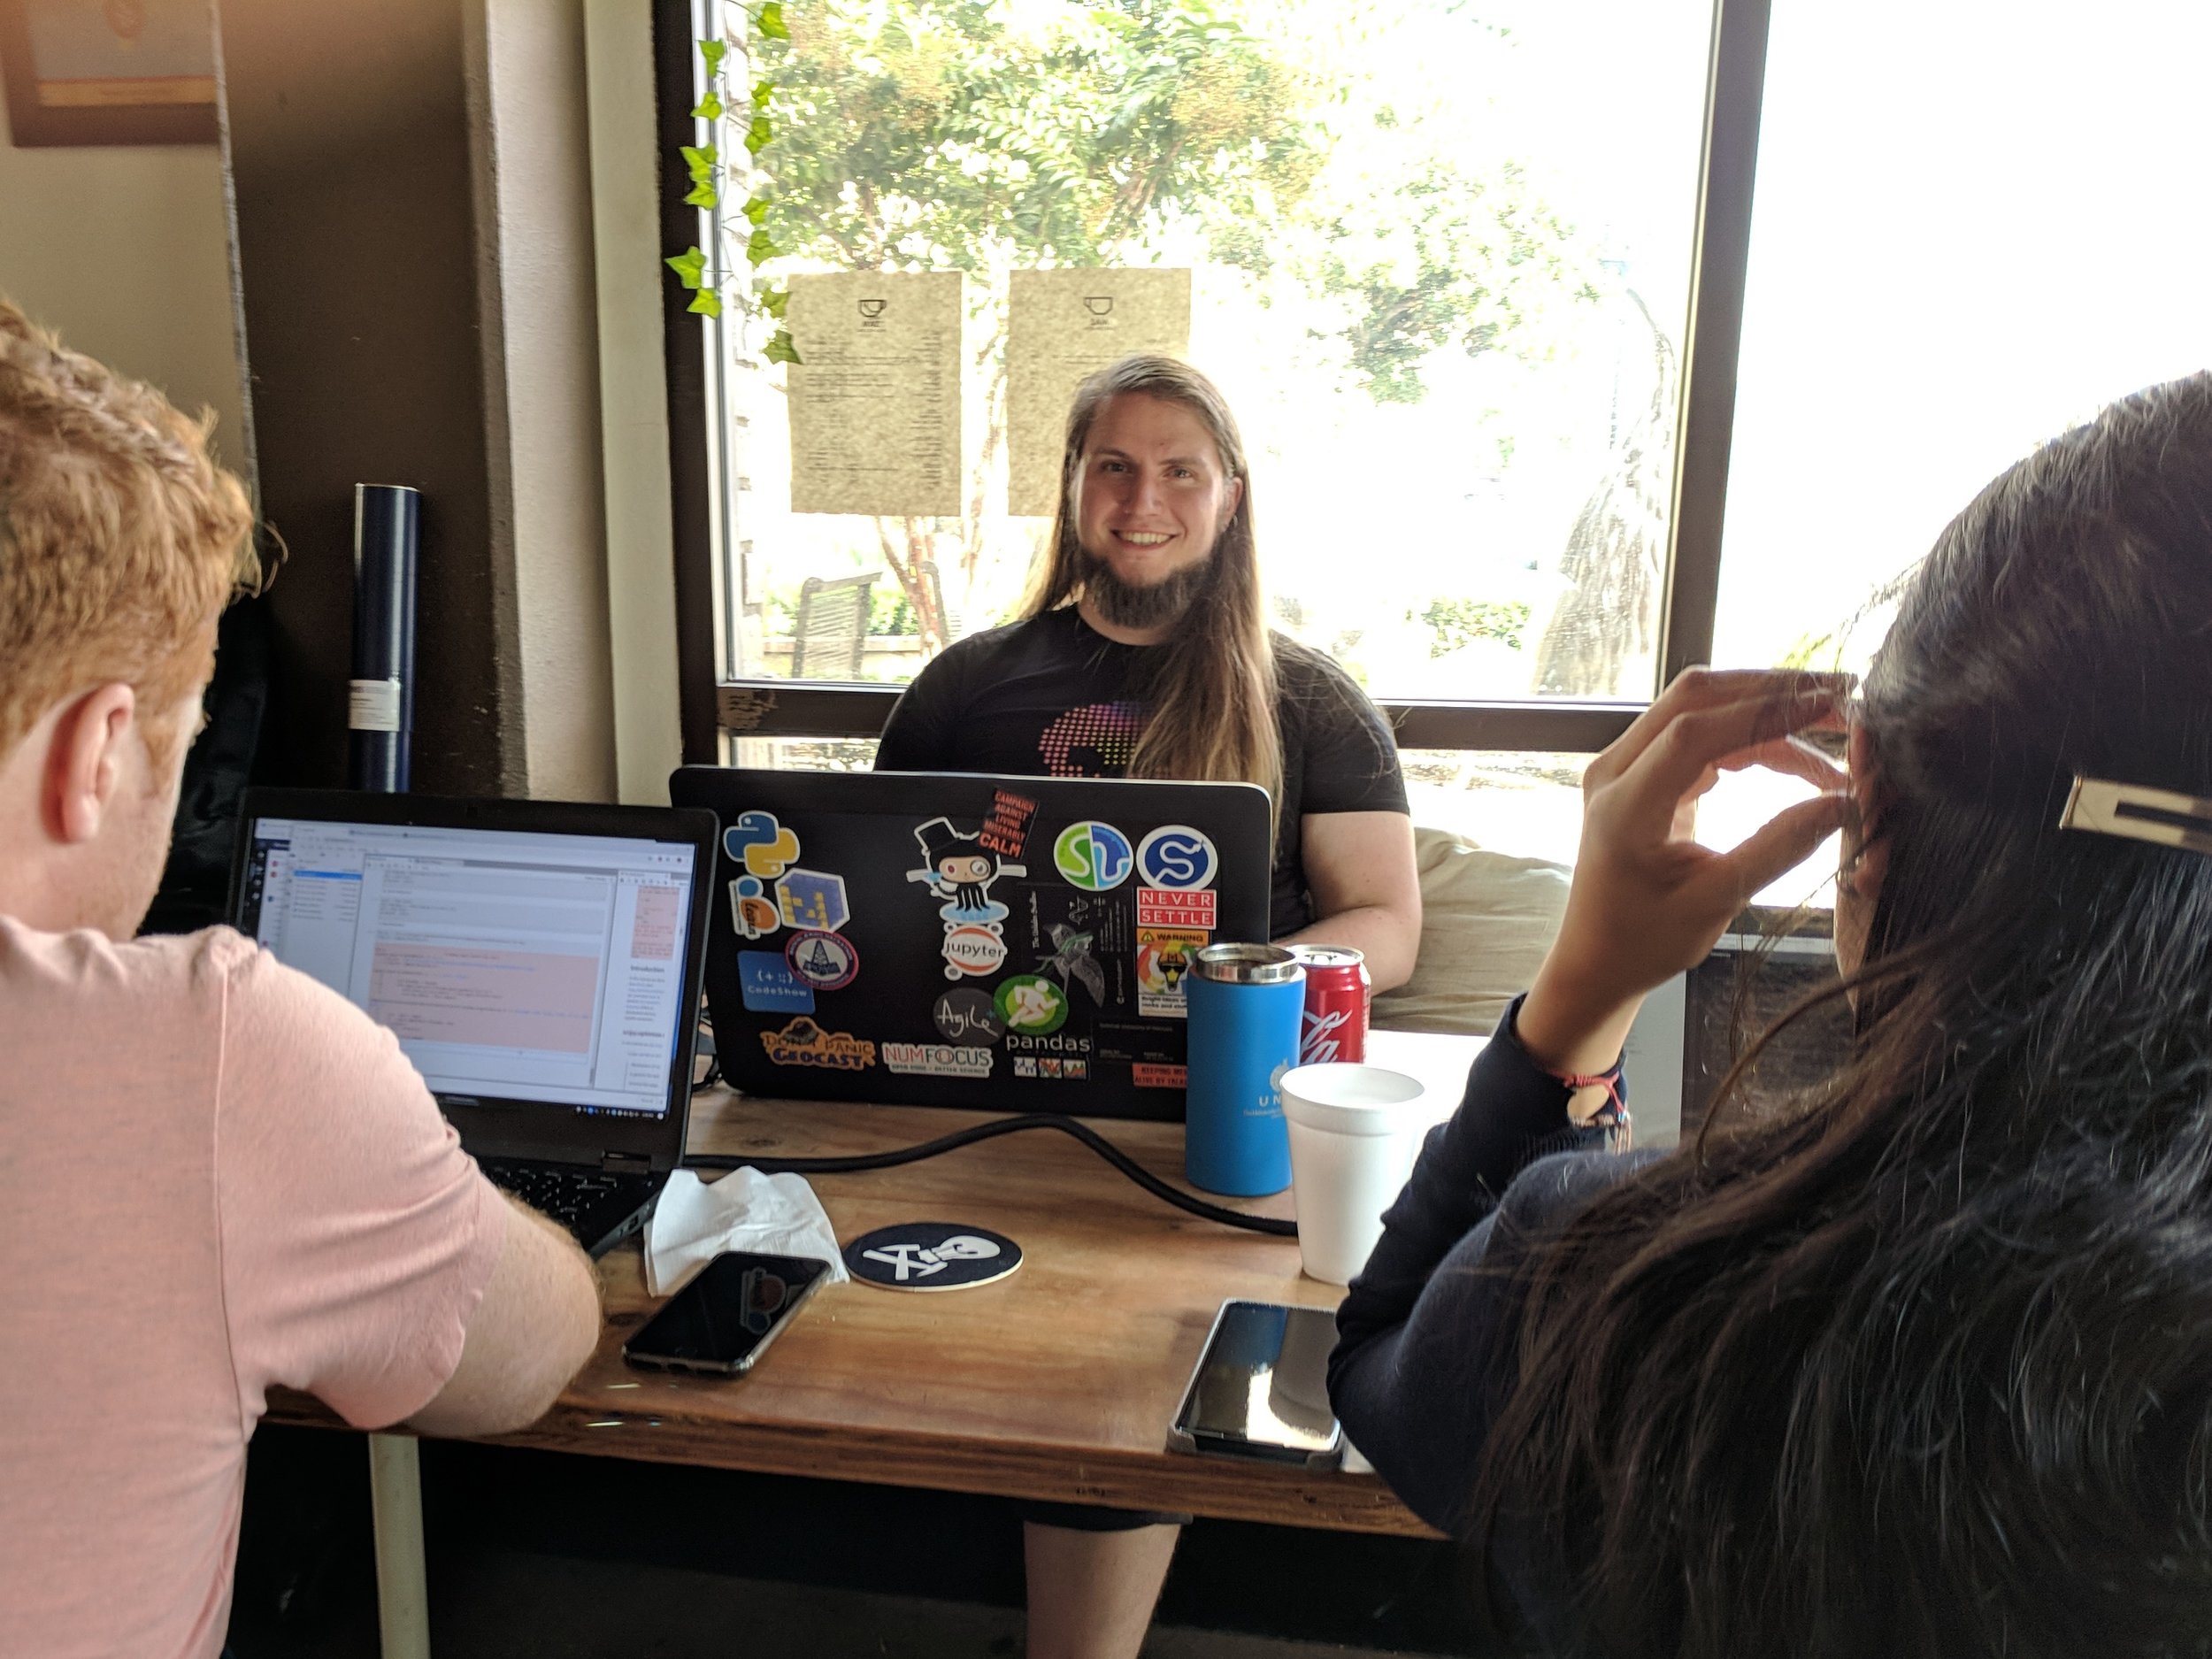
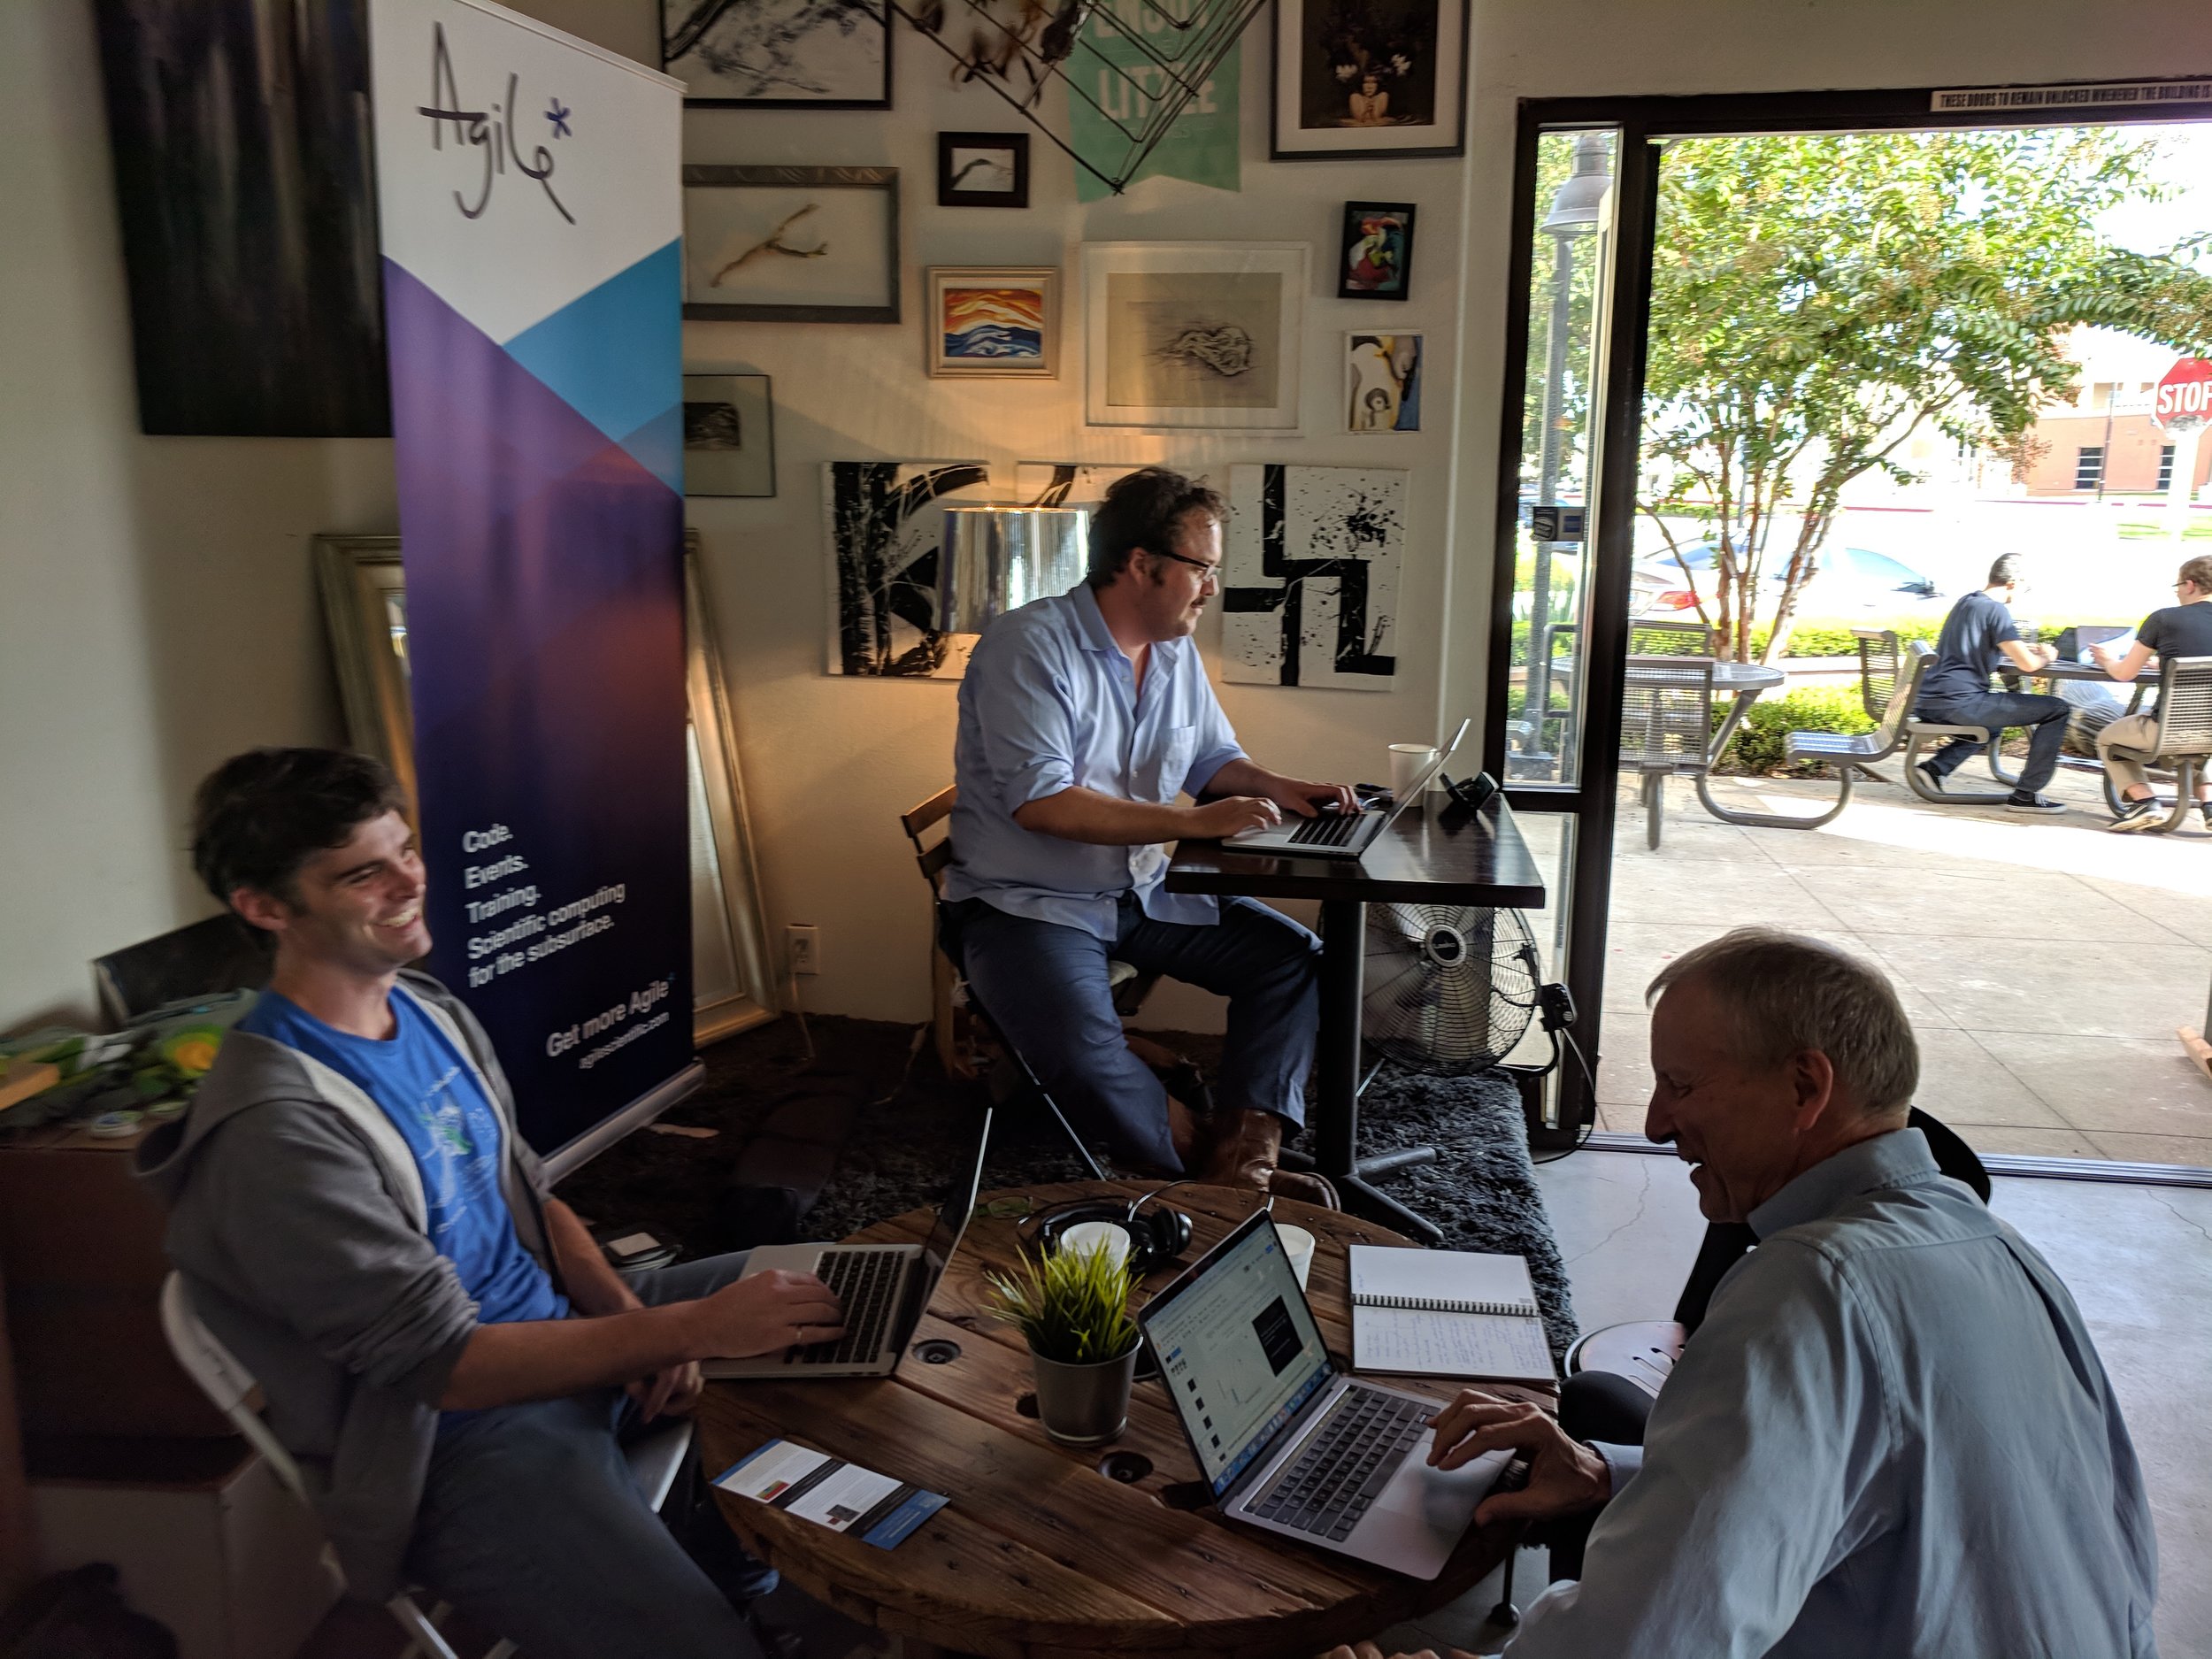
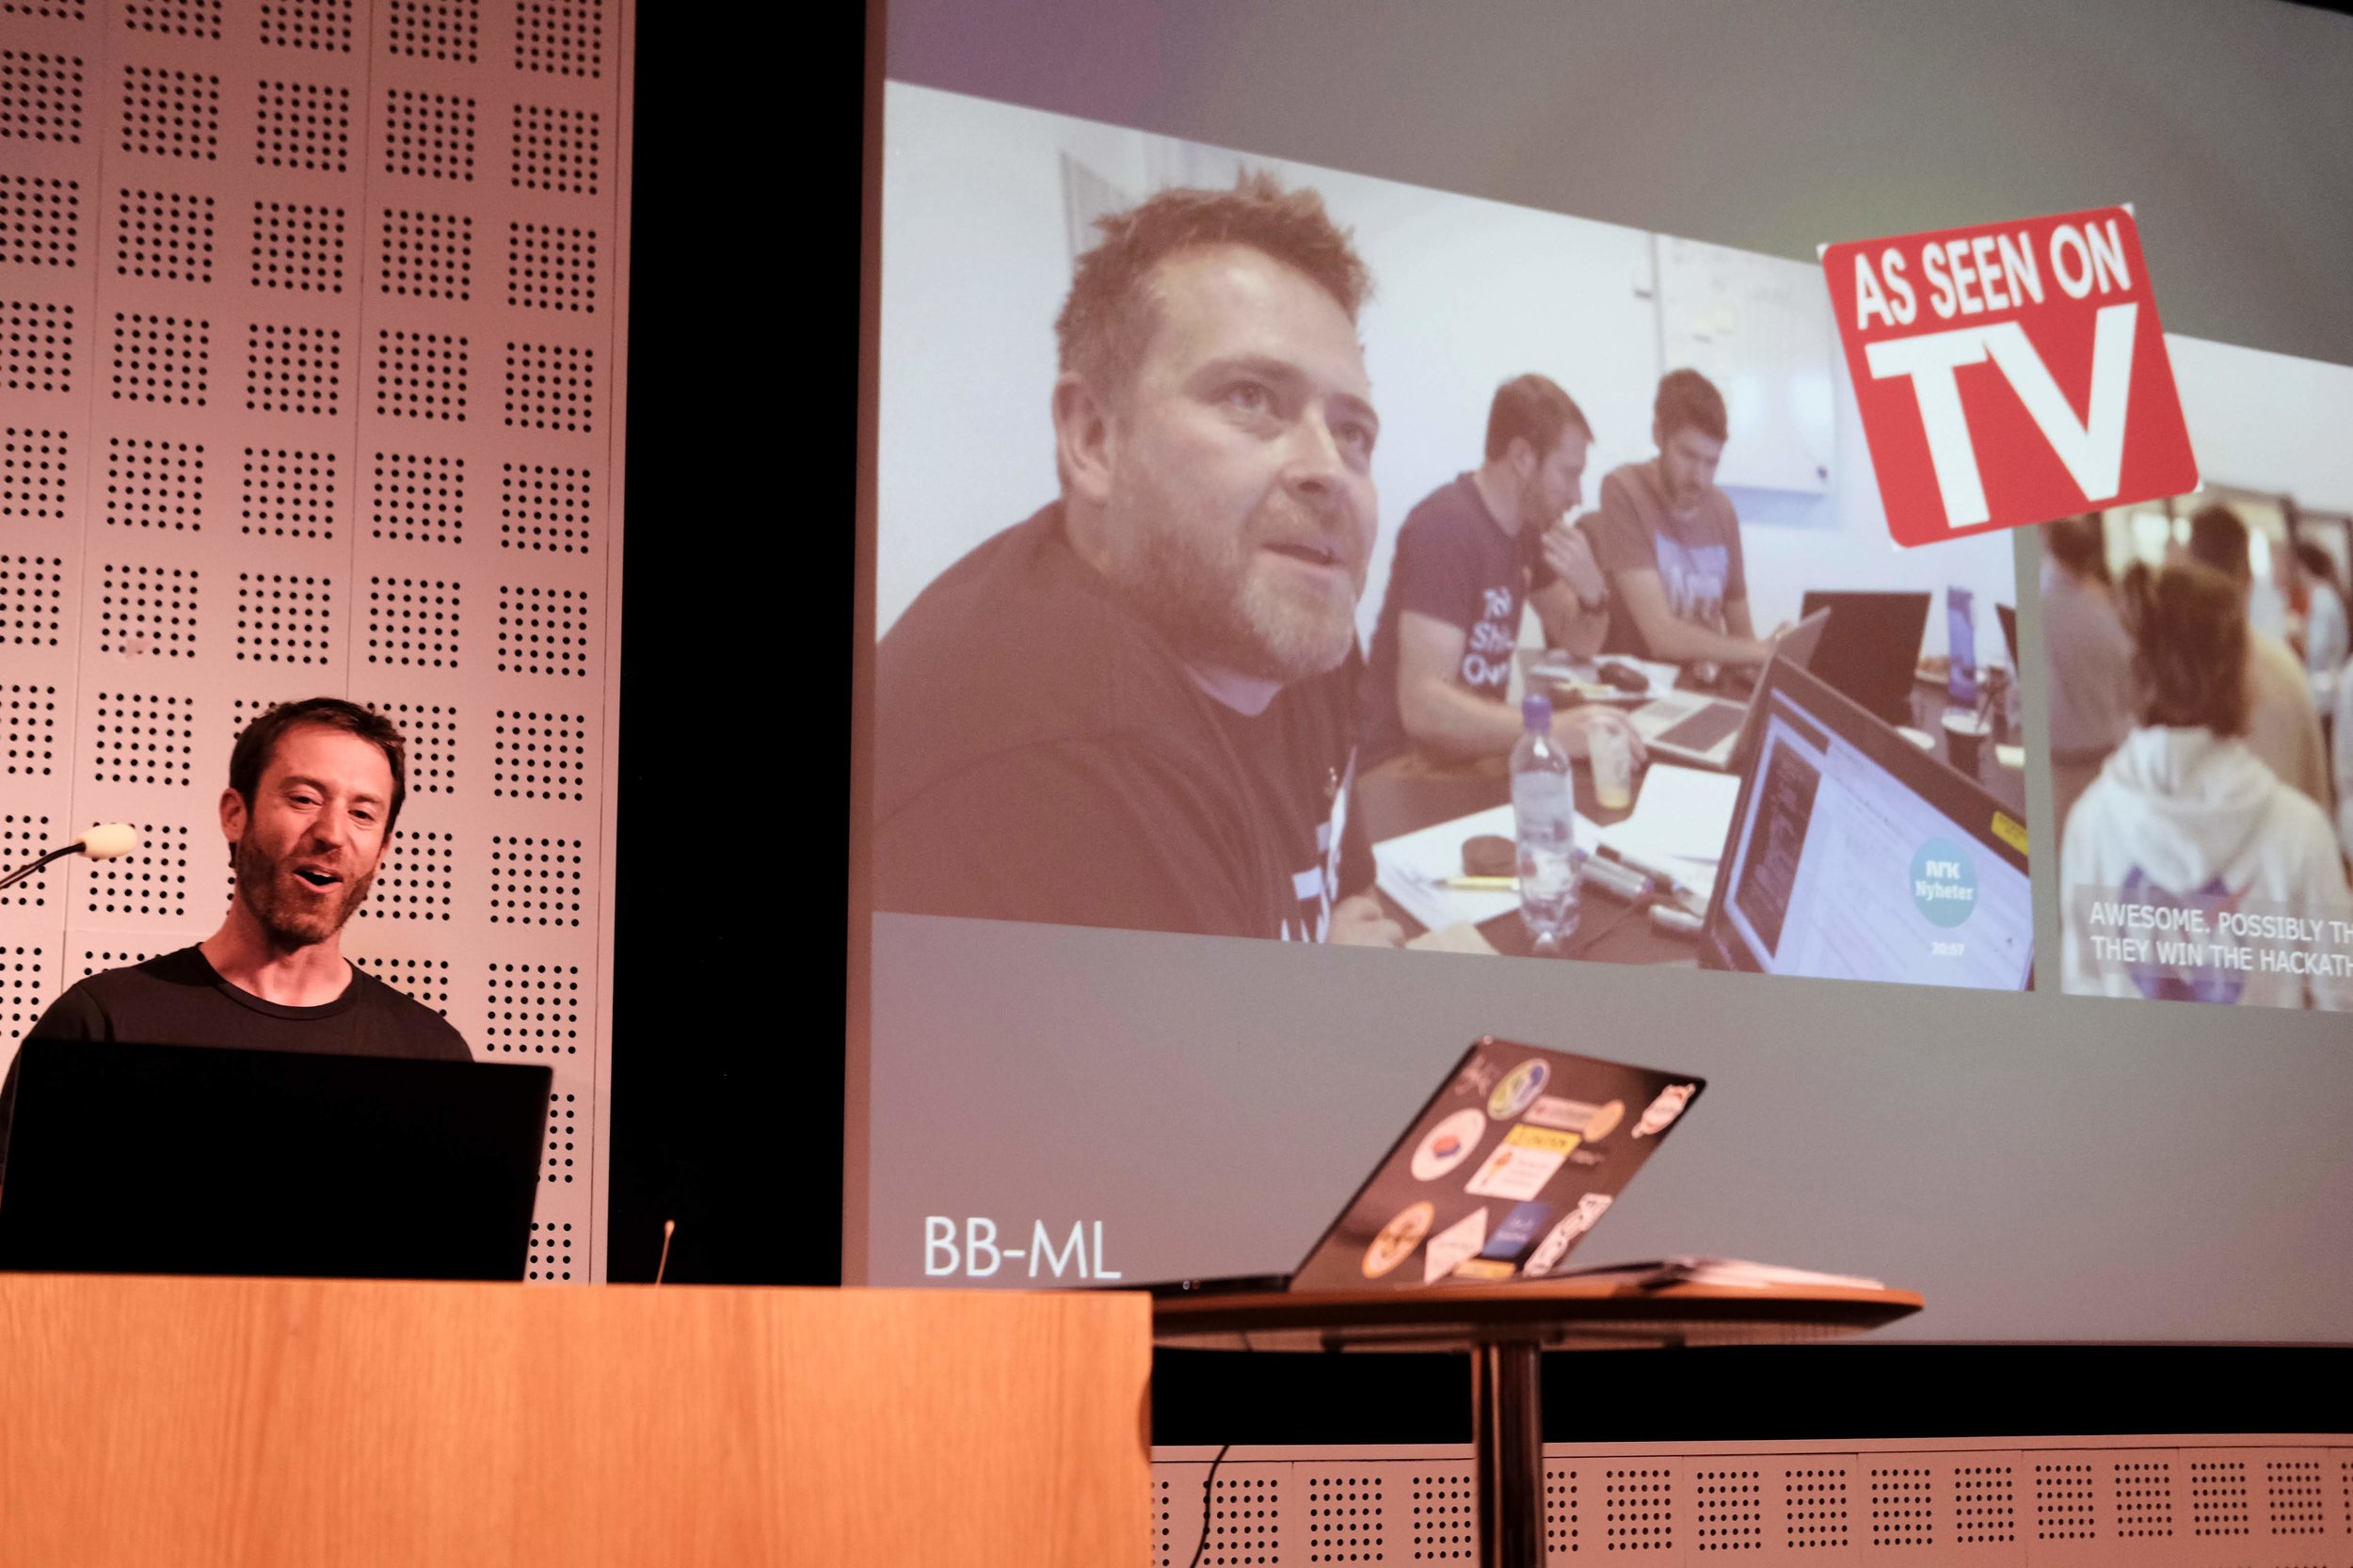
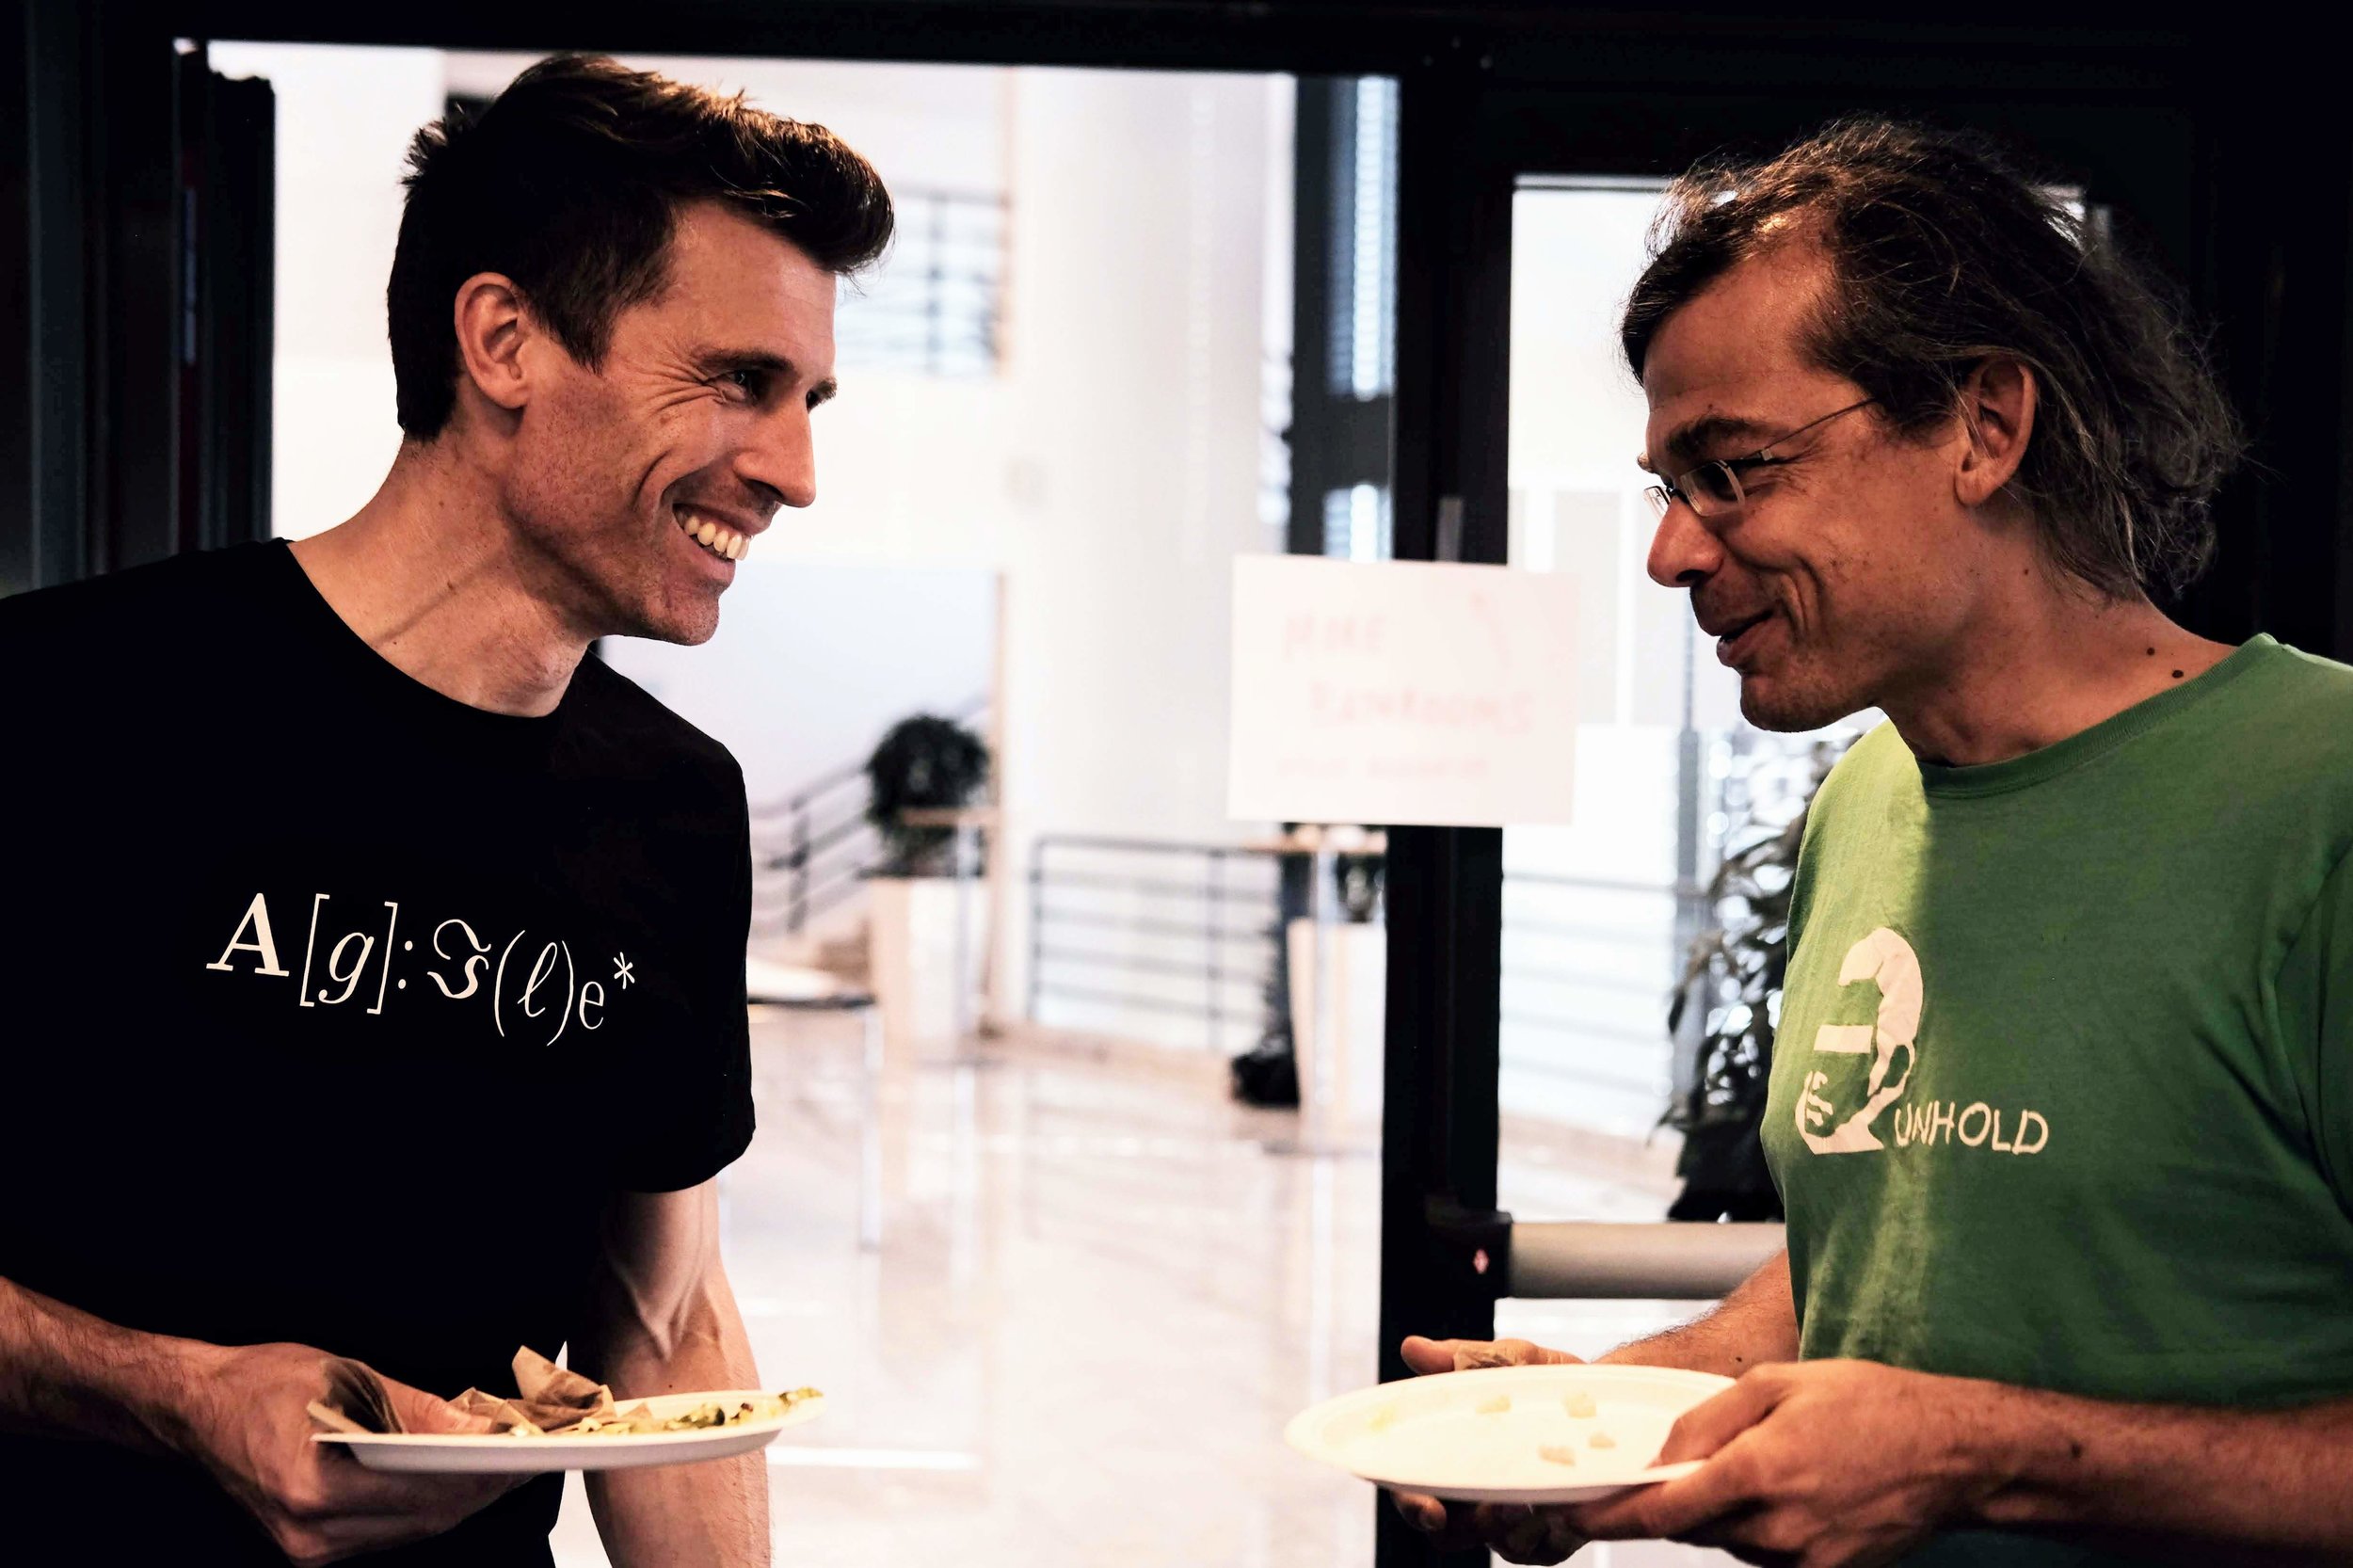
  • The transformative effect of open source software on subsurface science. Open source accelerates our work!

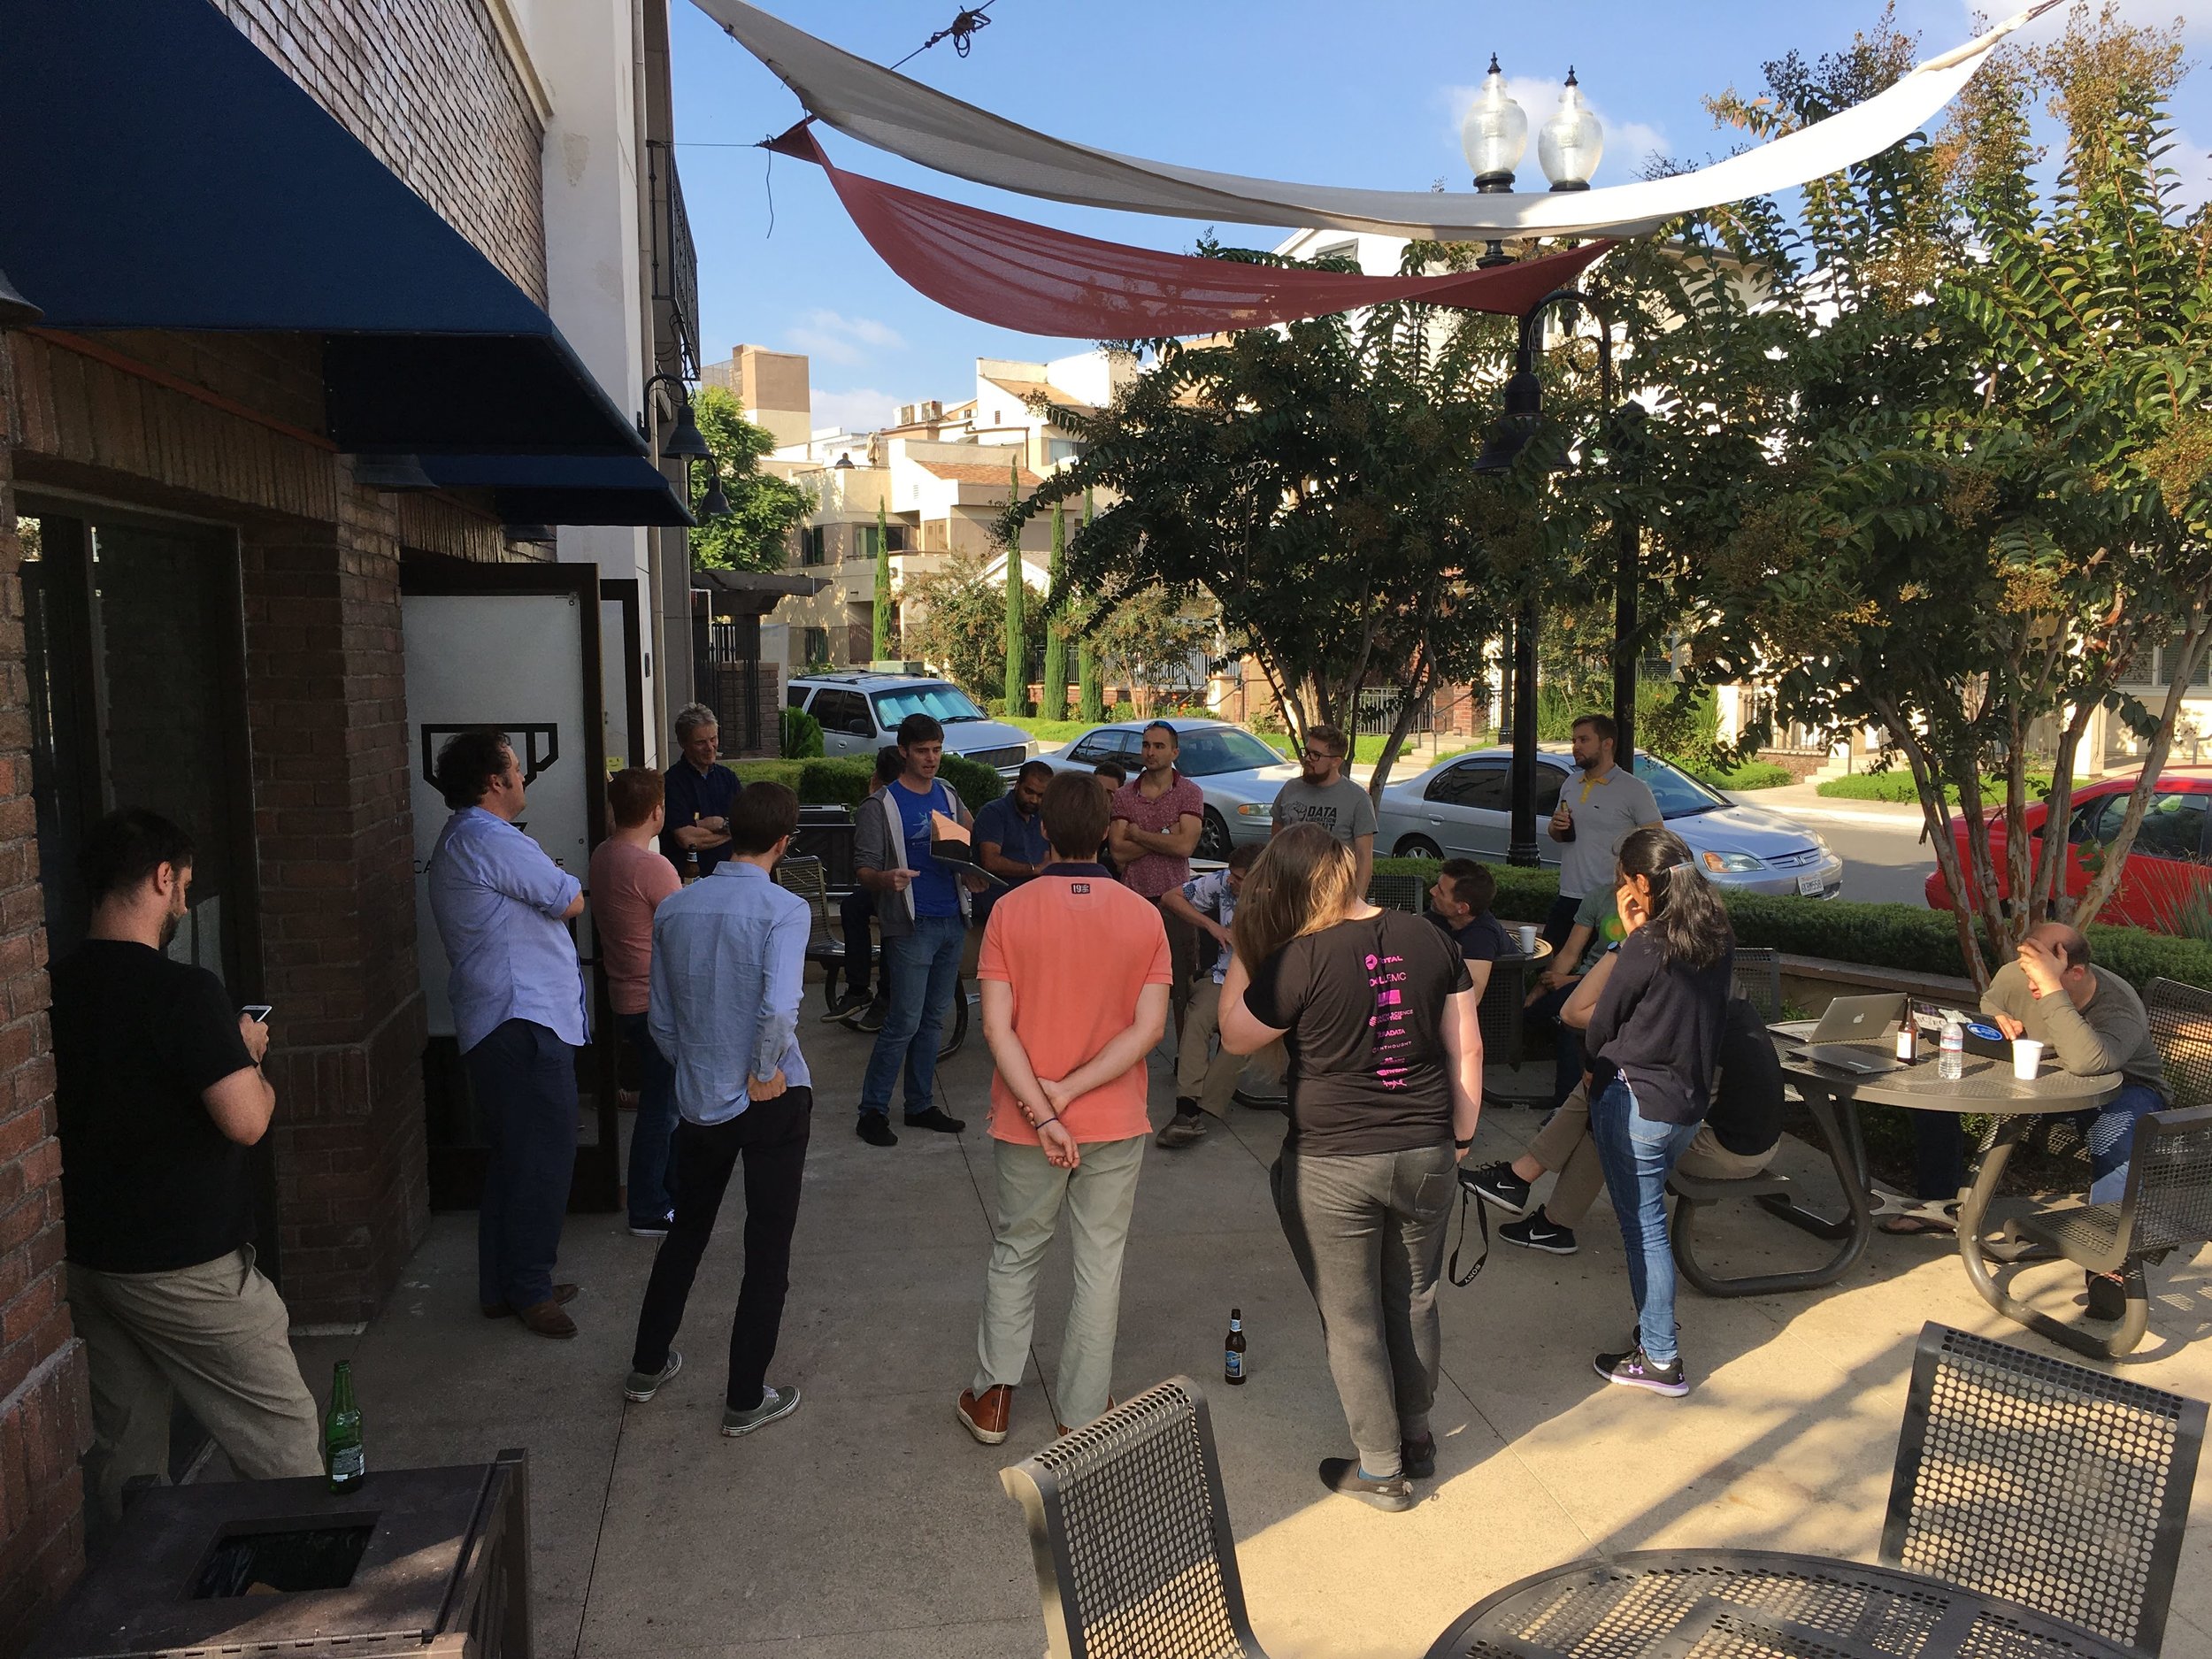
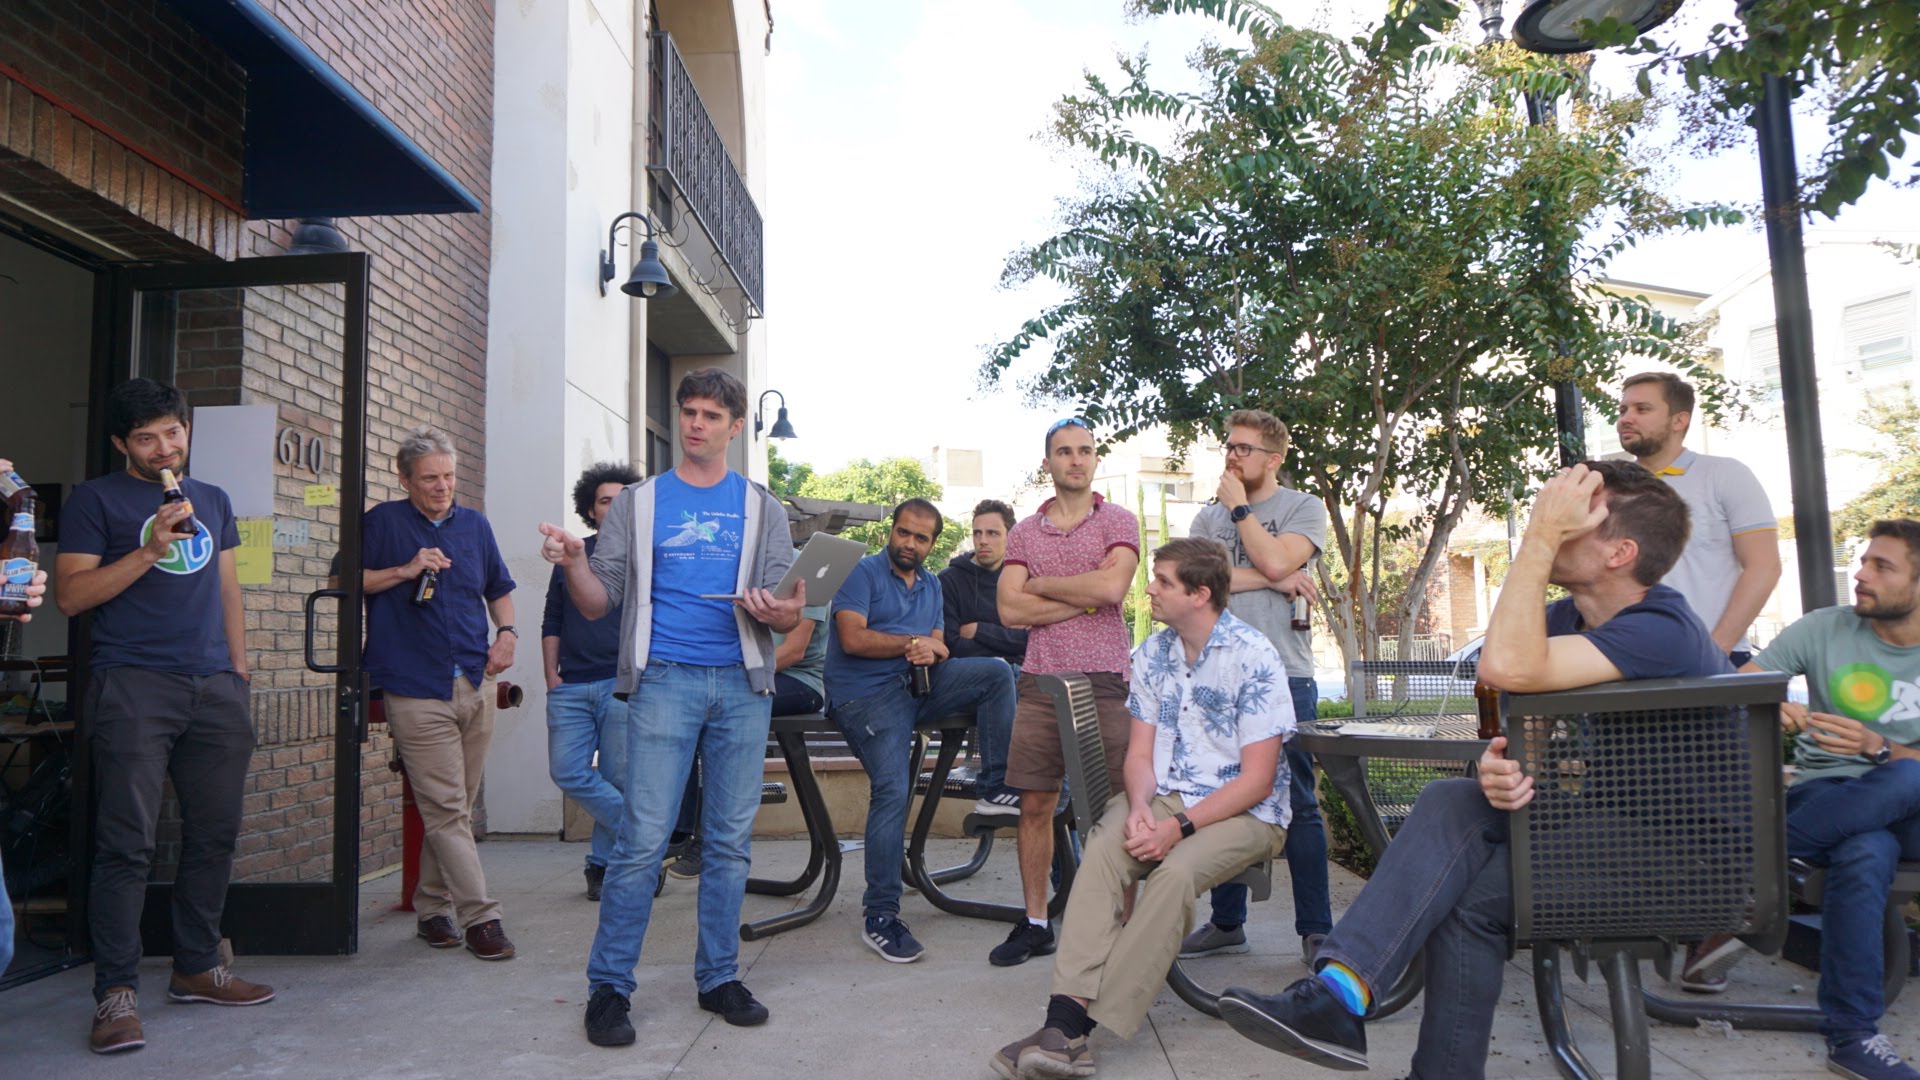
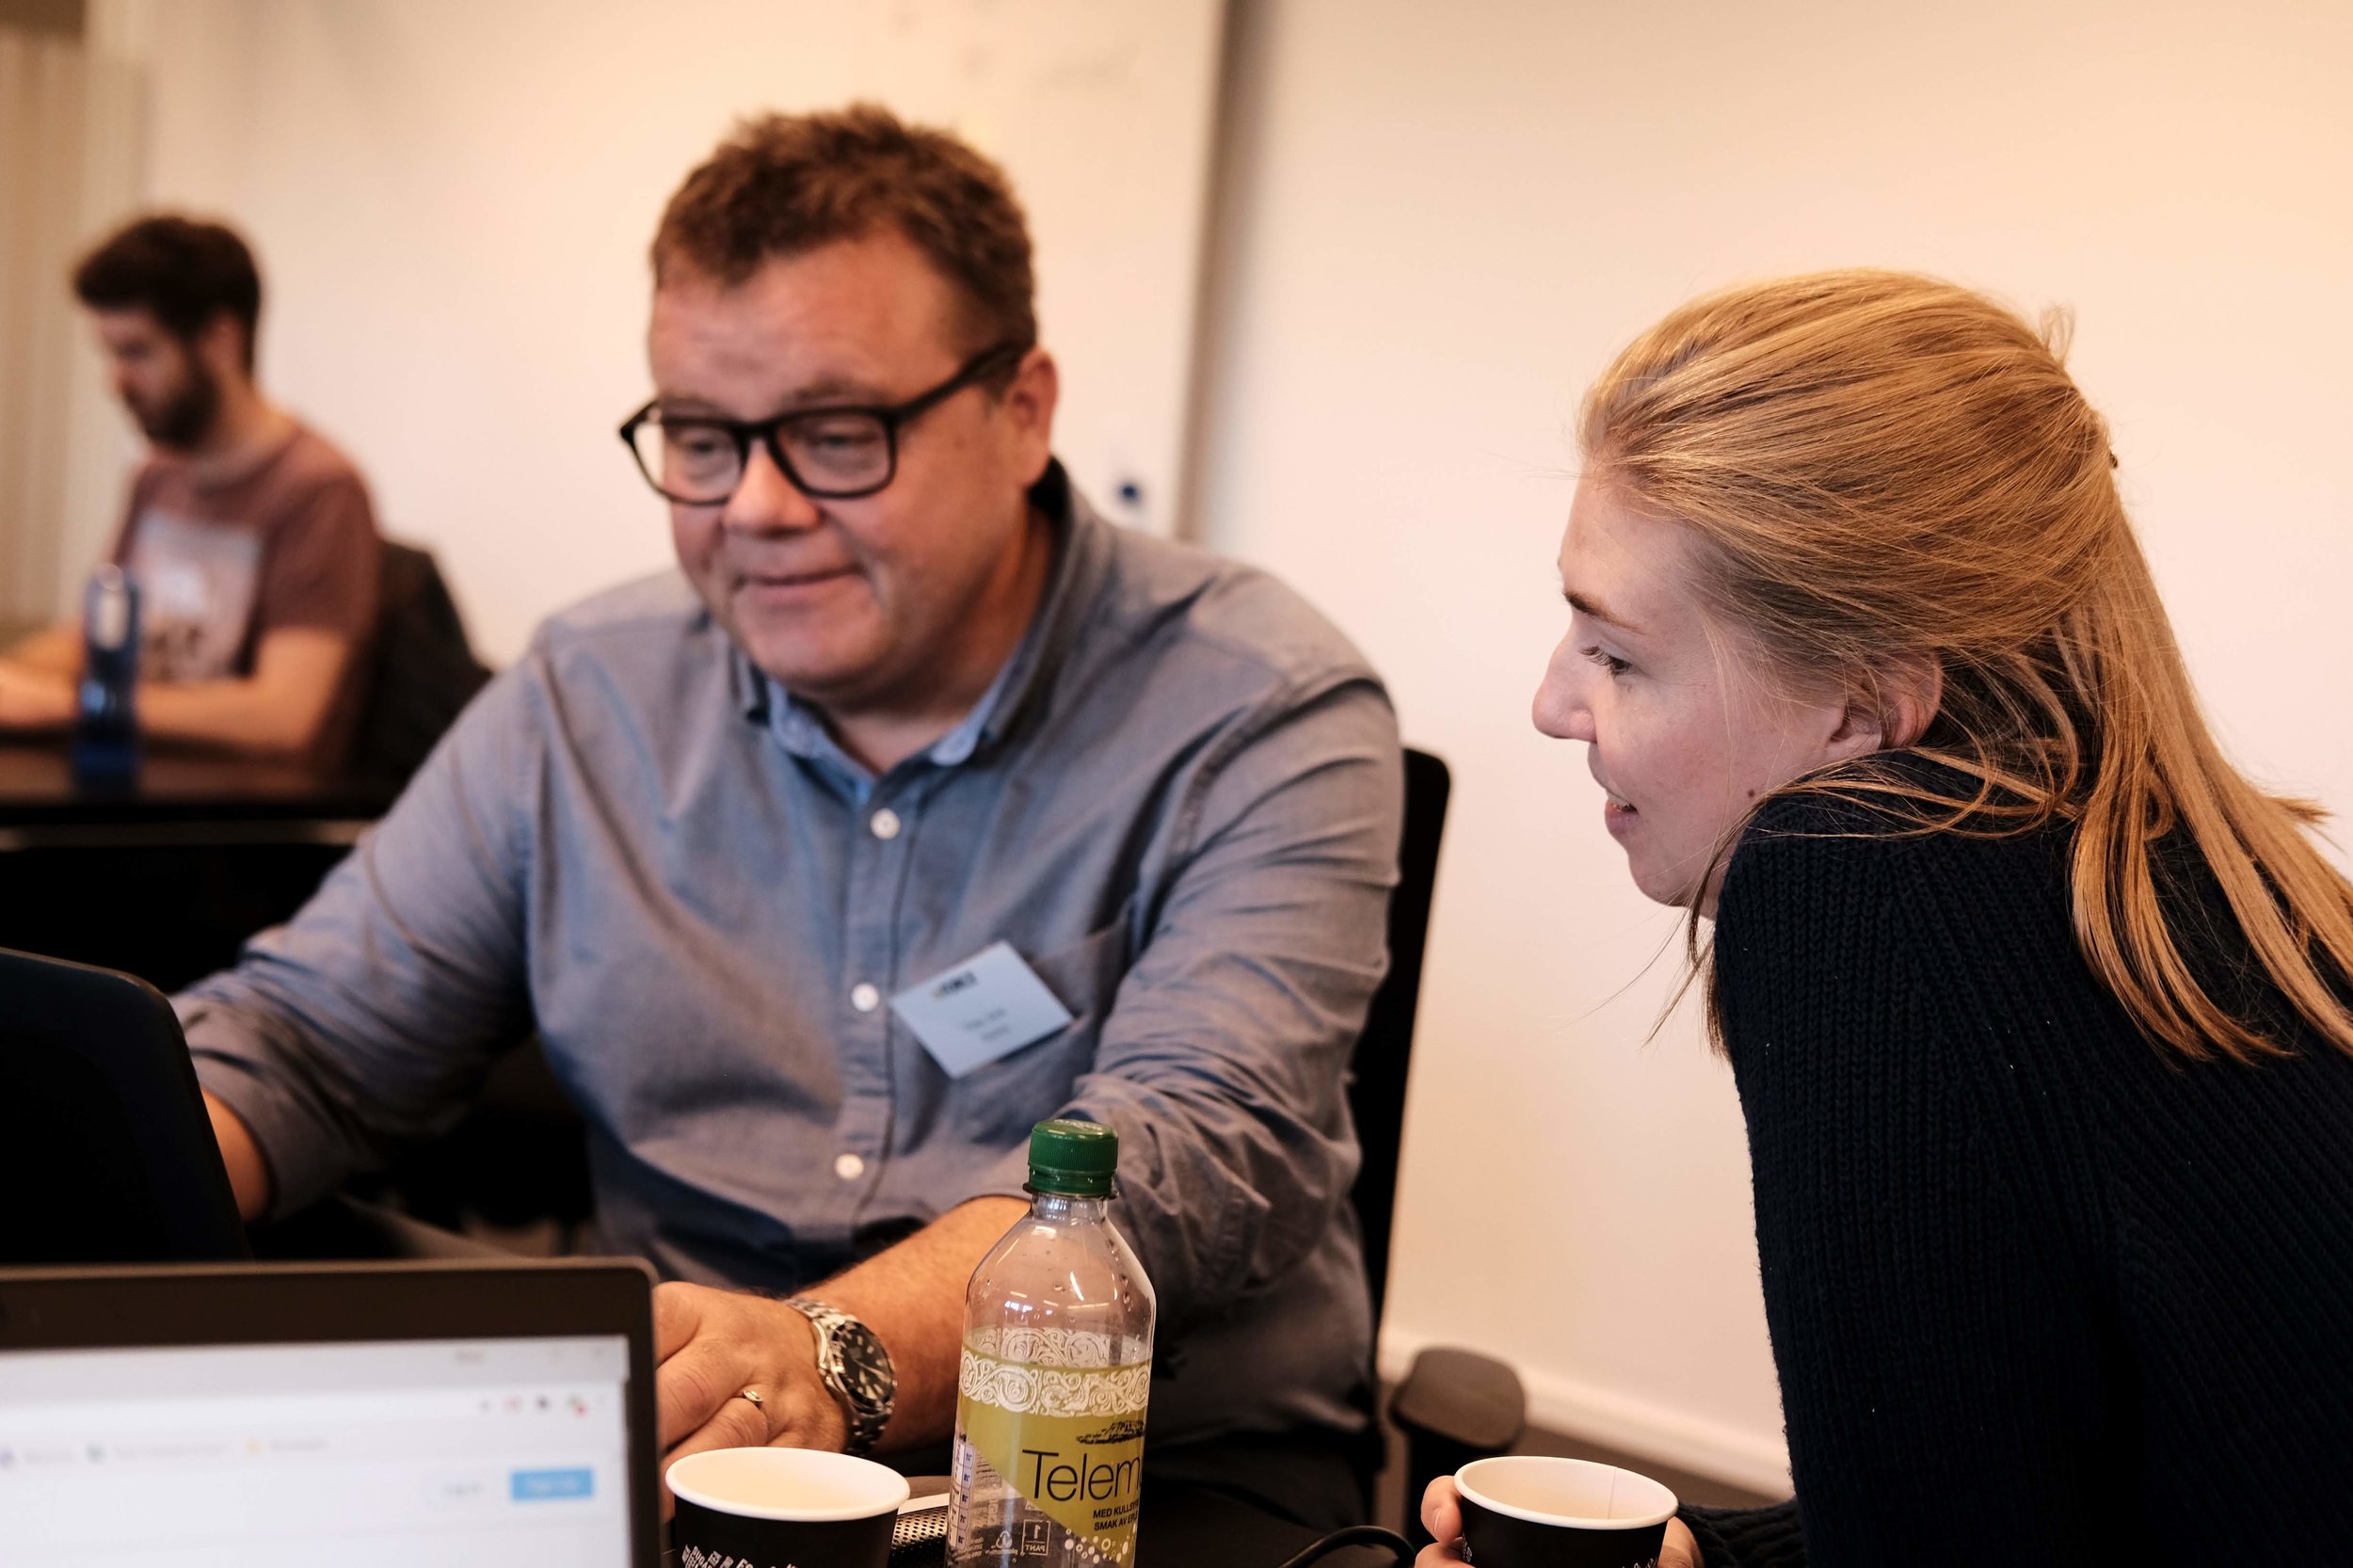
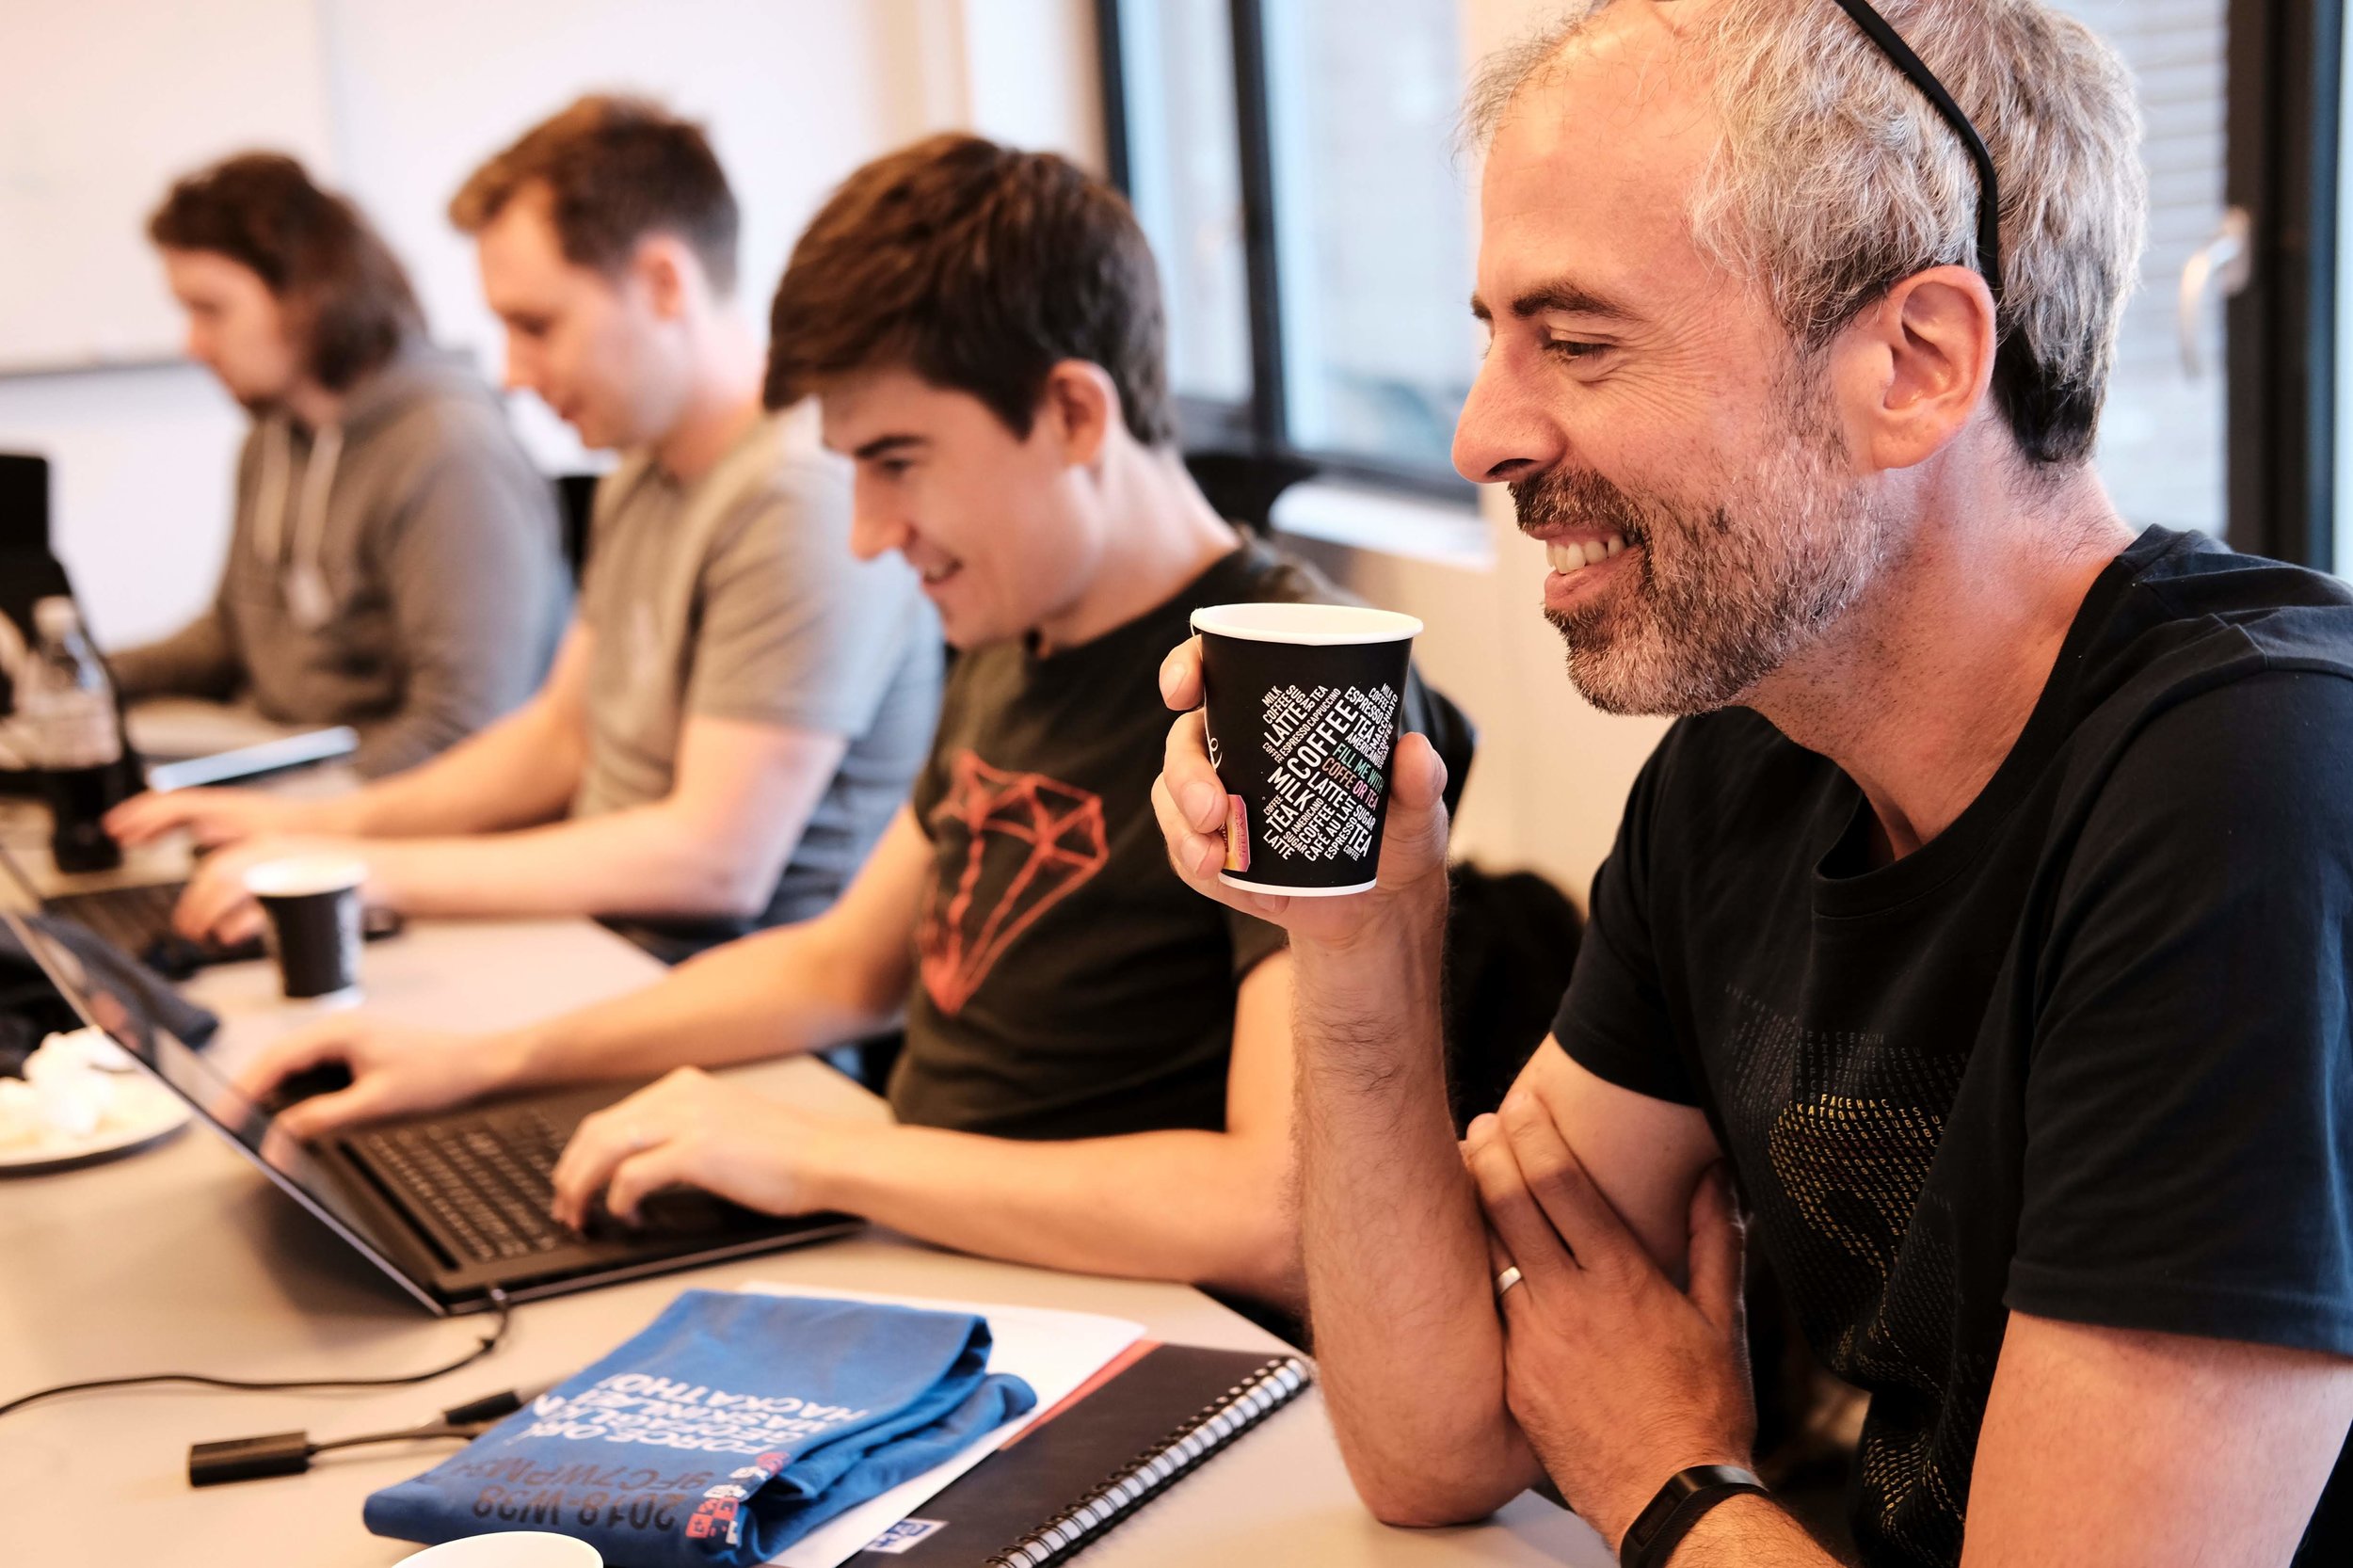
  • The transformative effect of collaborative, participatory events on the community. We can make new things!

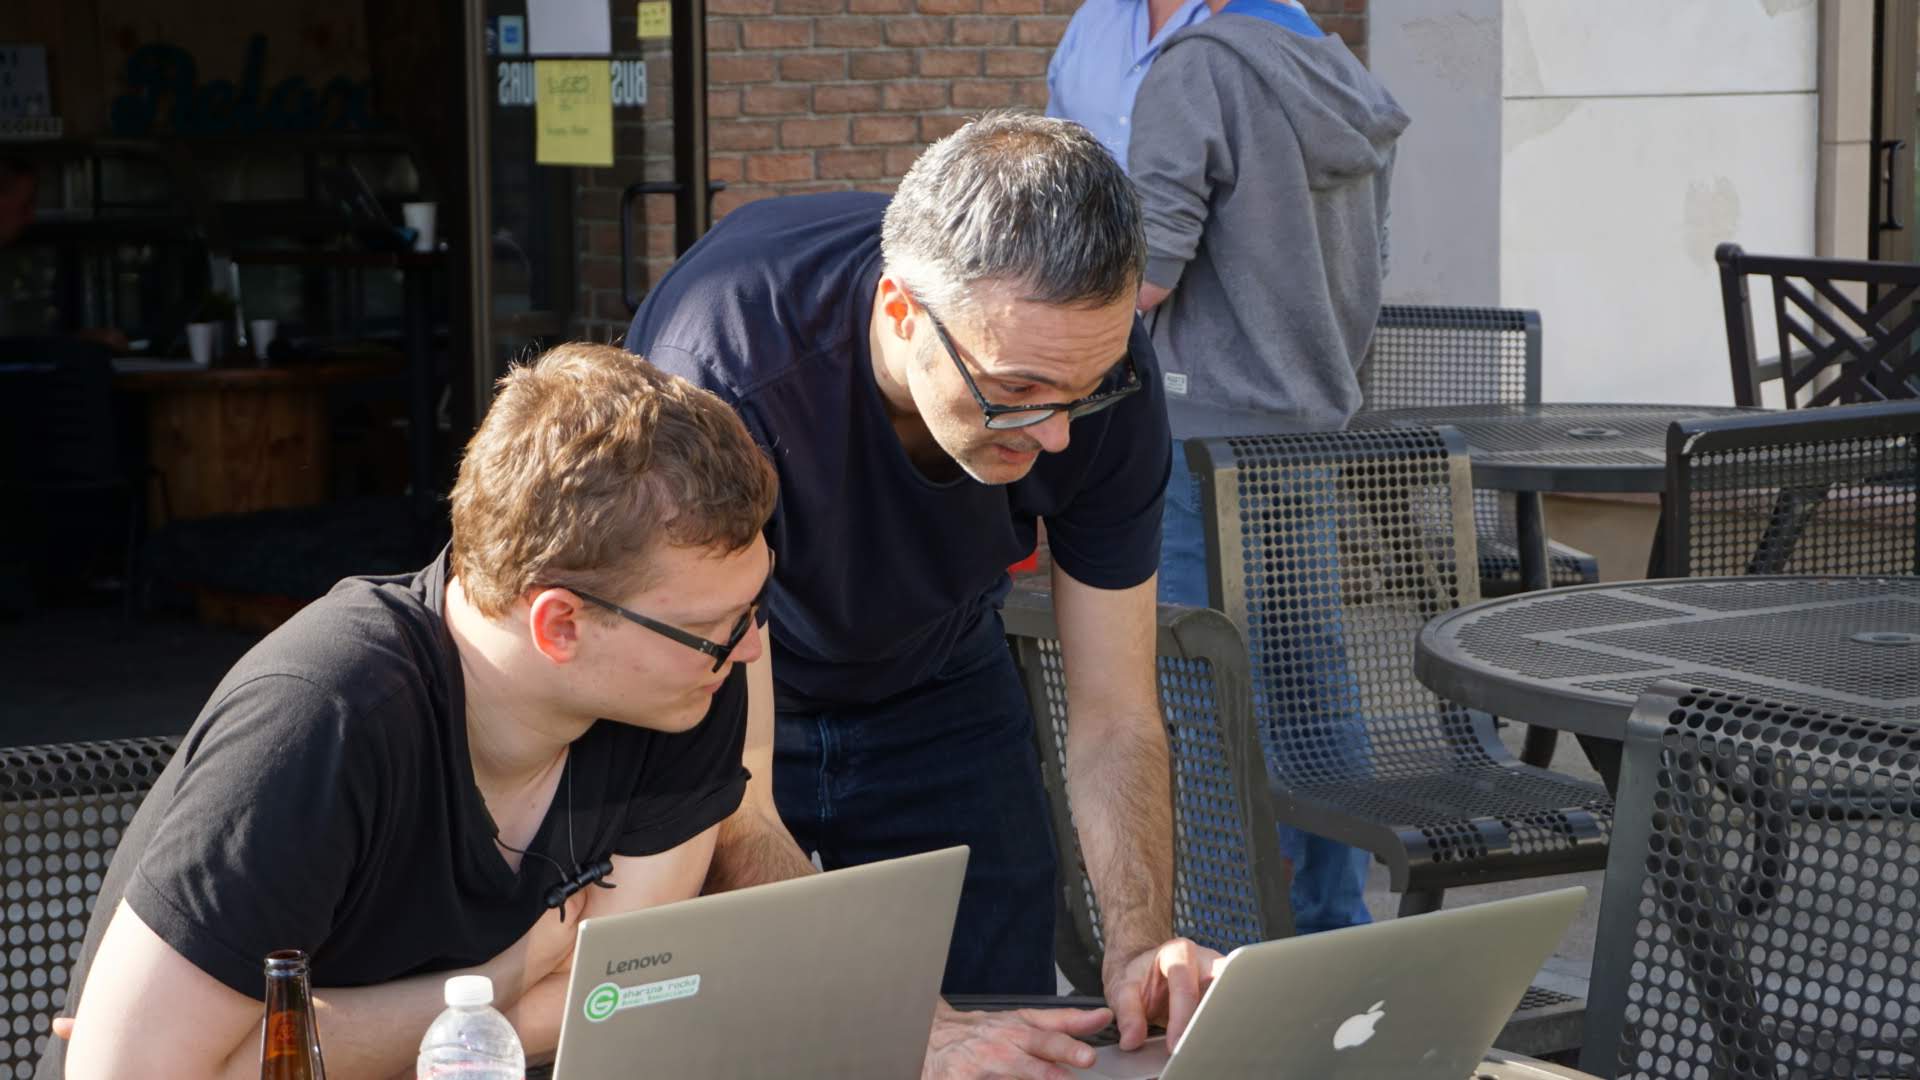
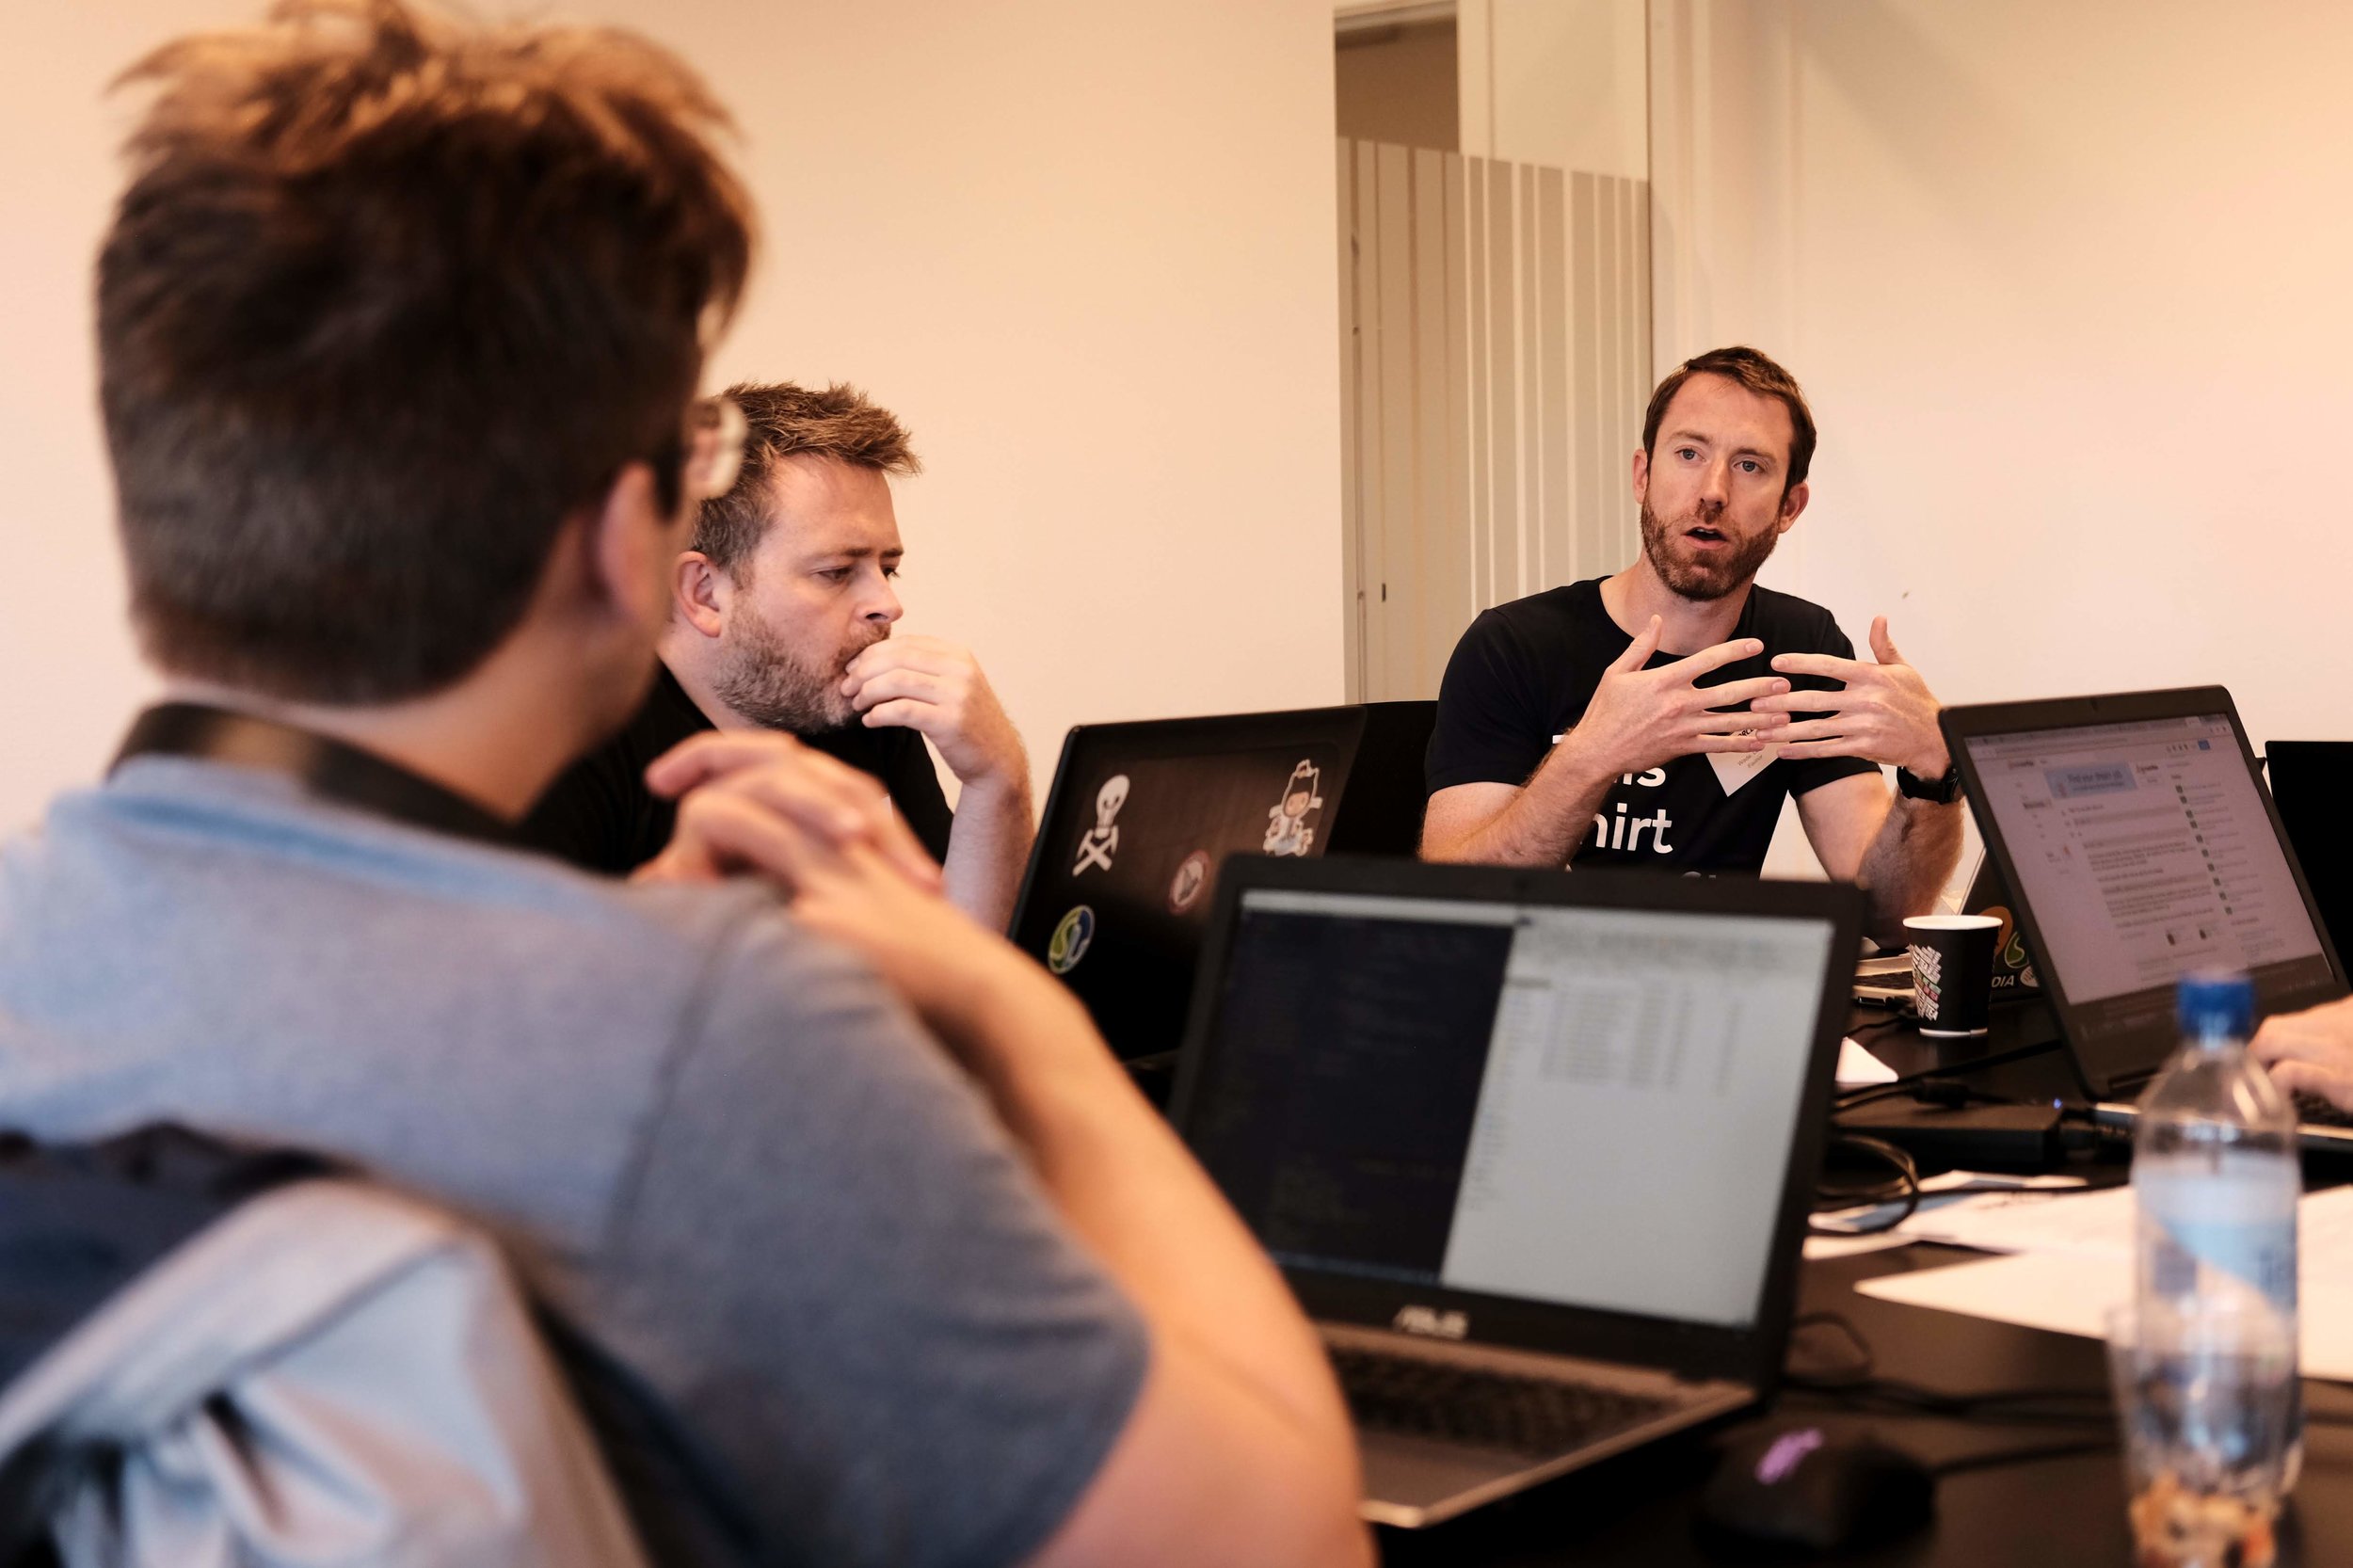
  • The transformative effect of training on ourselves and our peers. Lots of us have new superpowers!

Together, we’ve built the foundation for a new, open software platform.

A domain shift

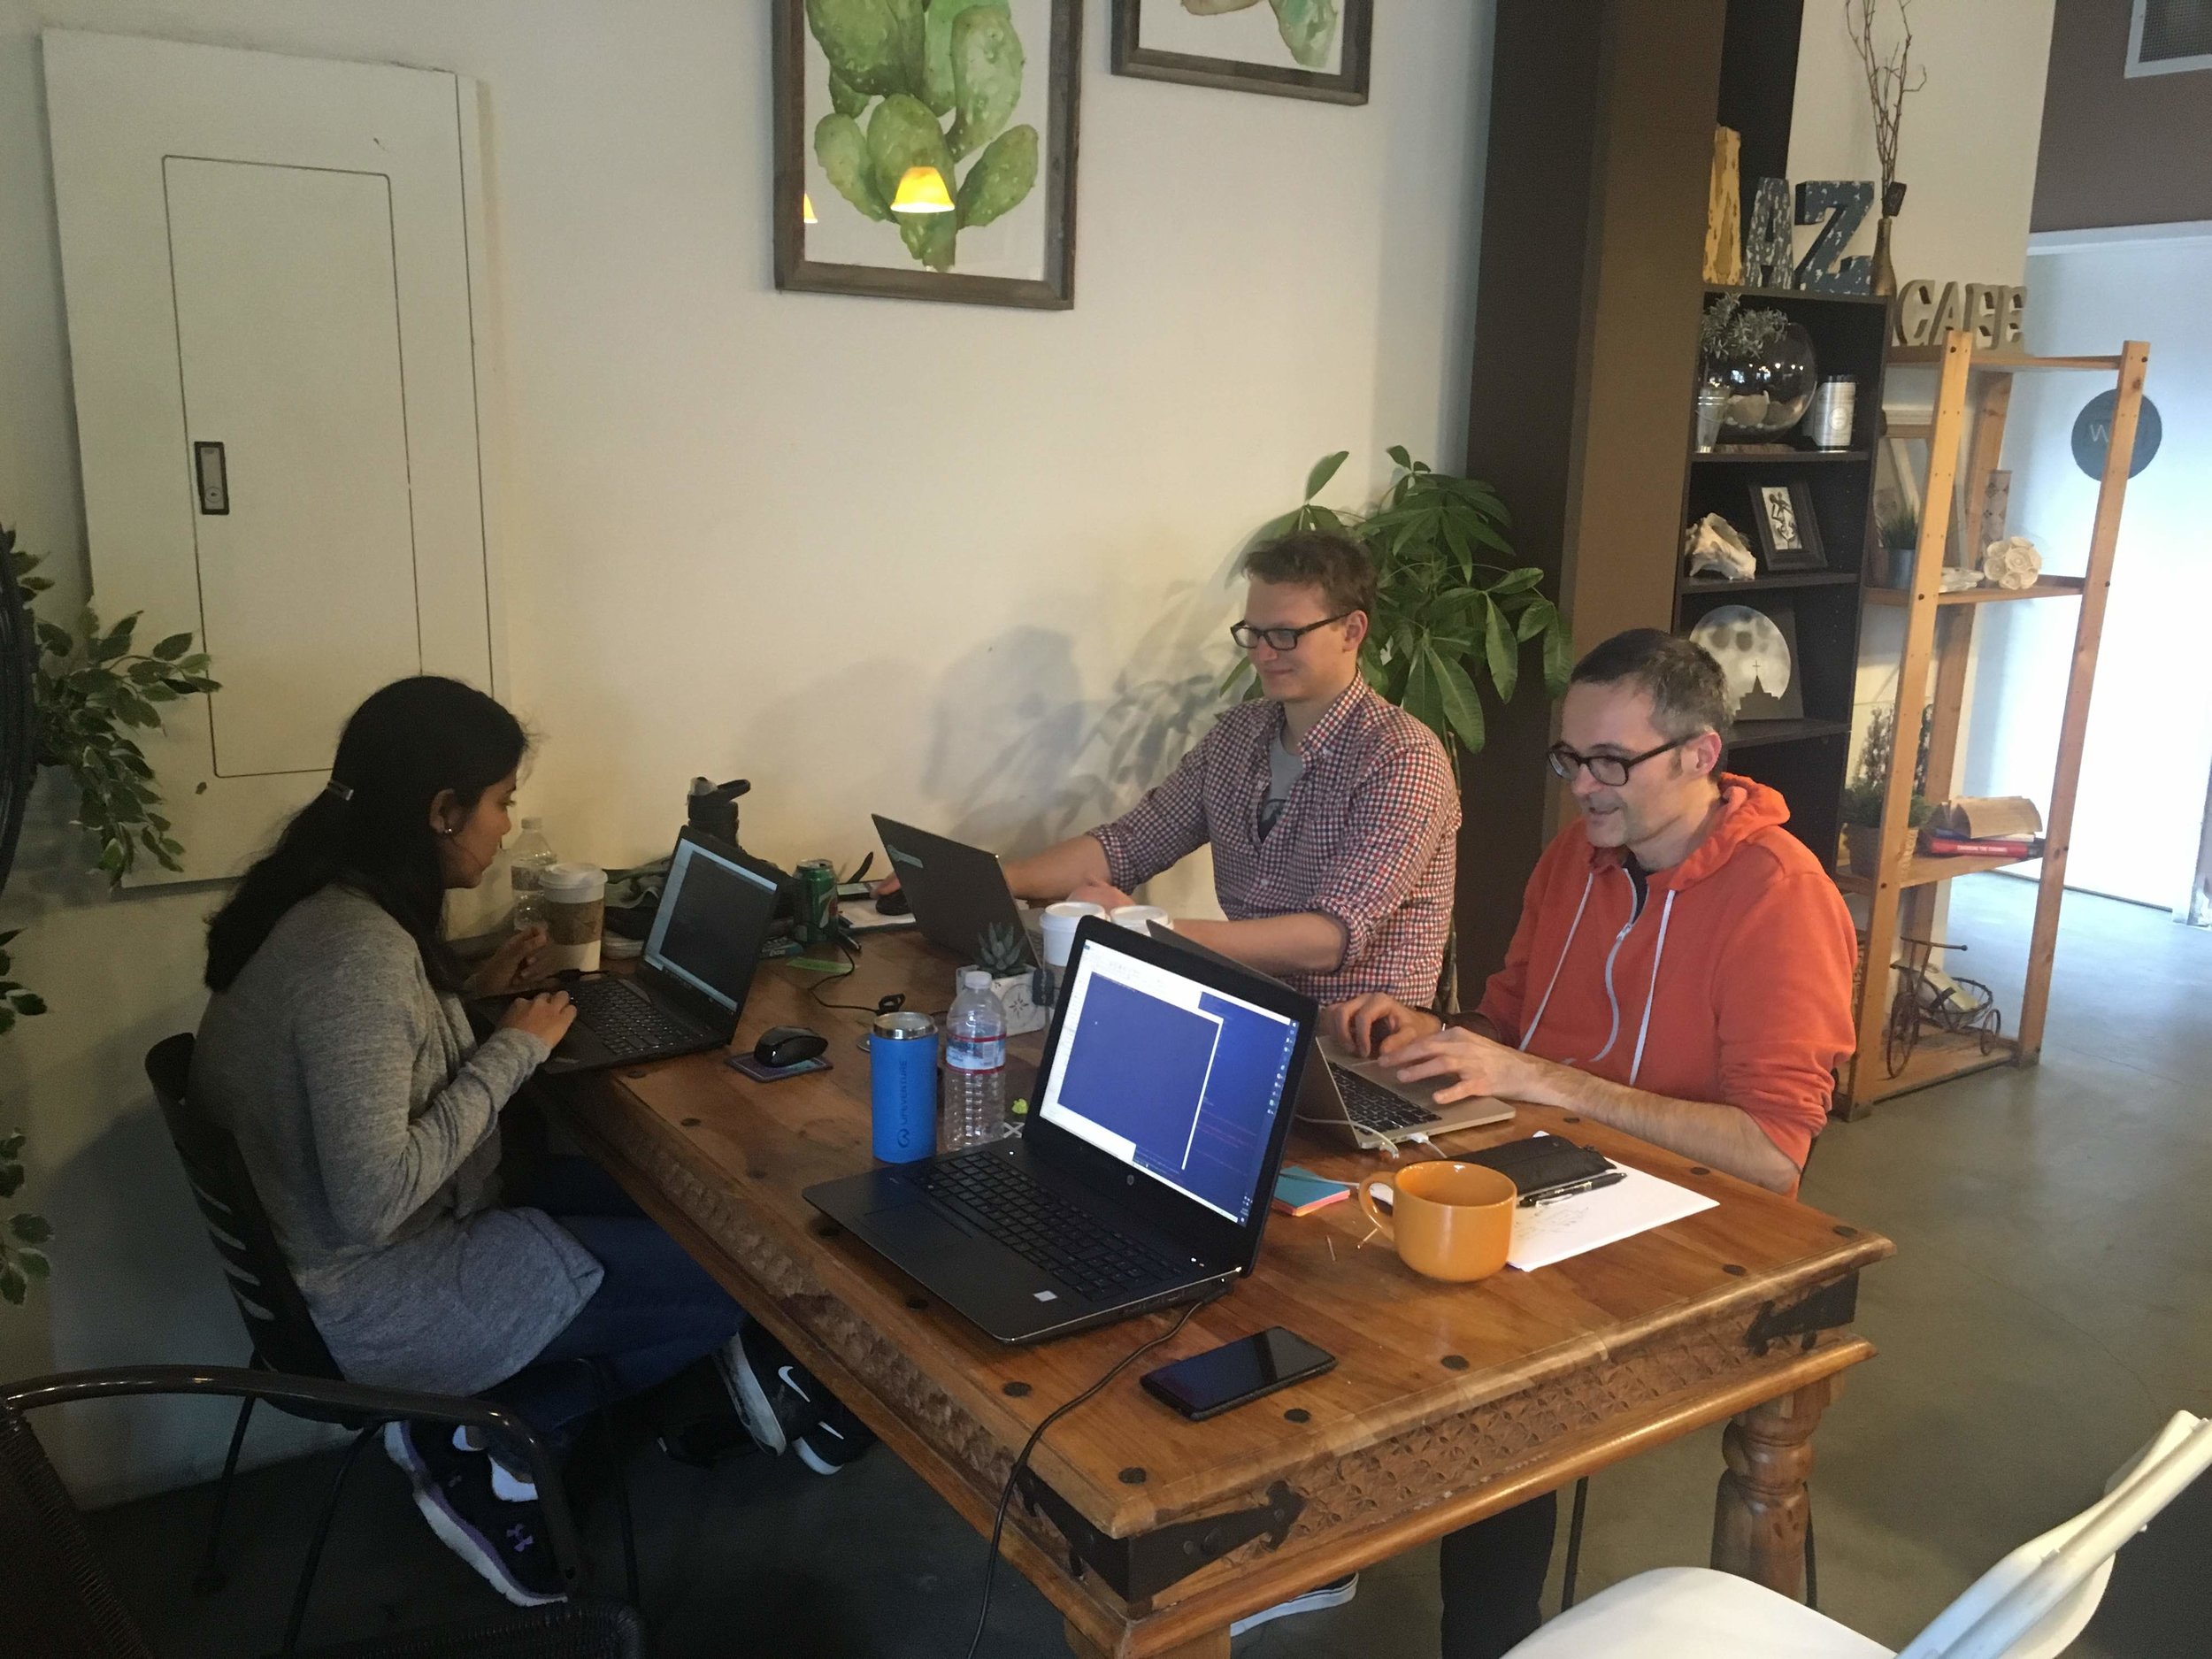
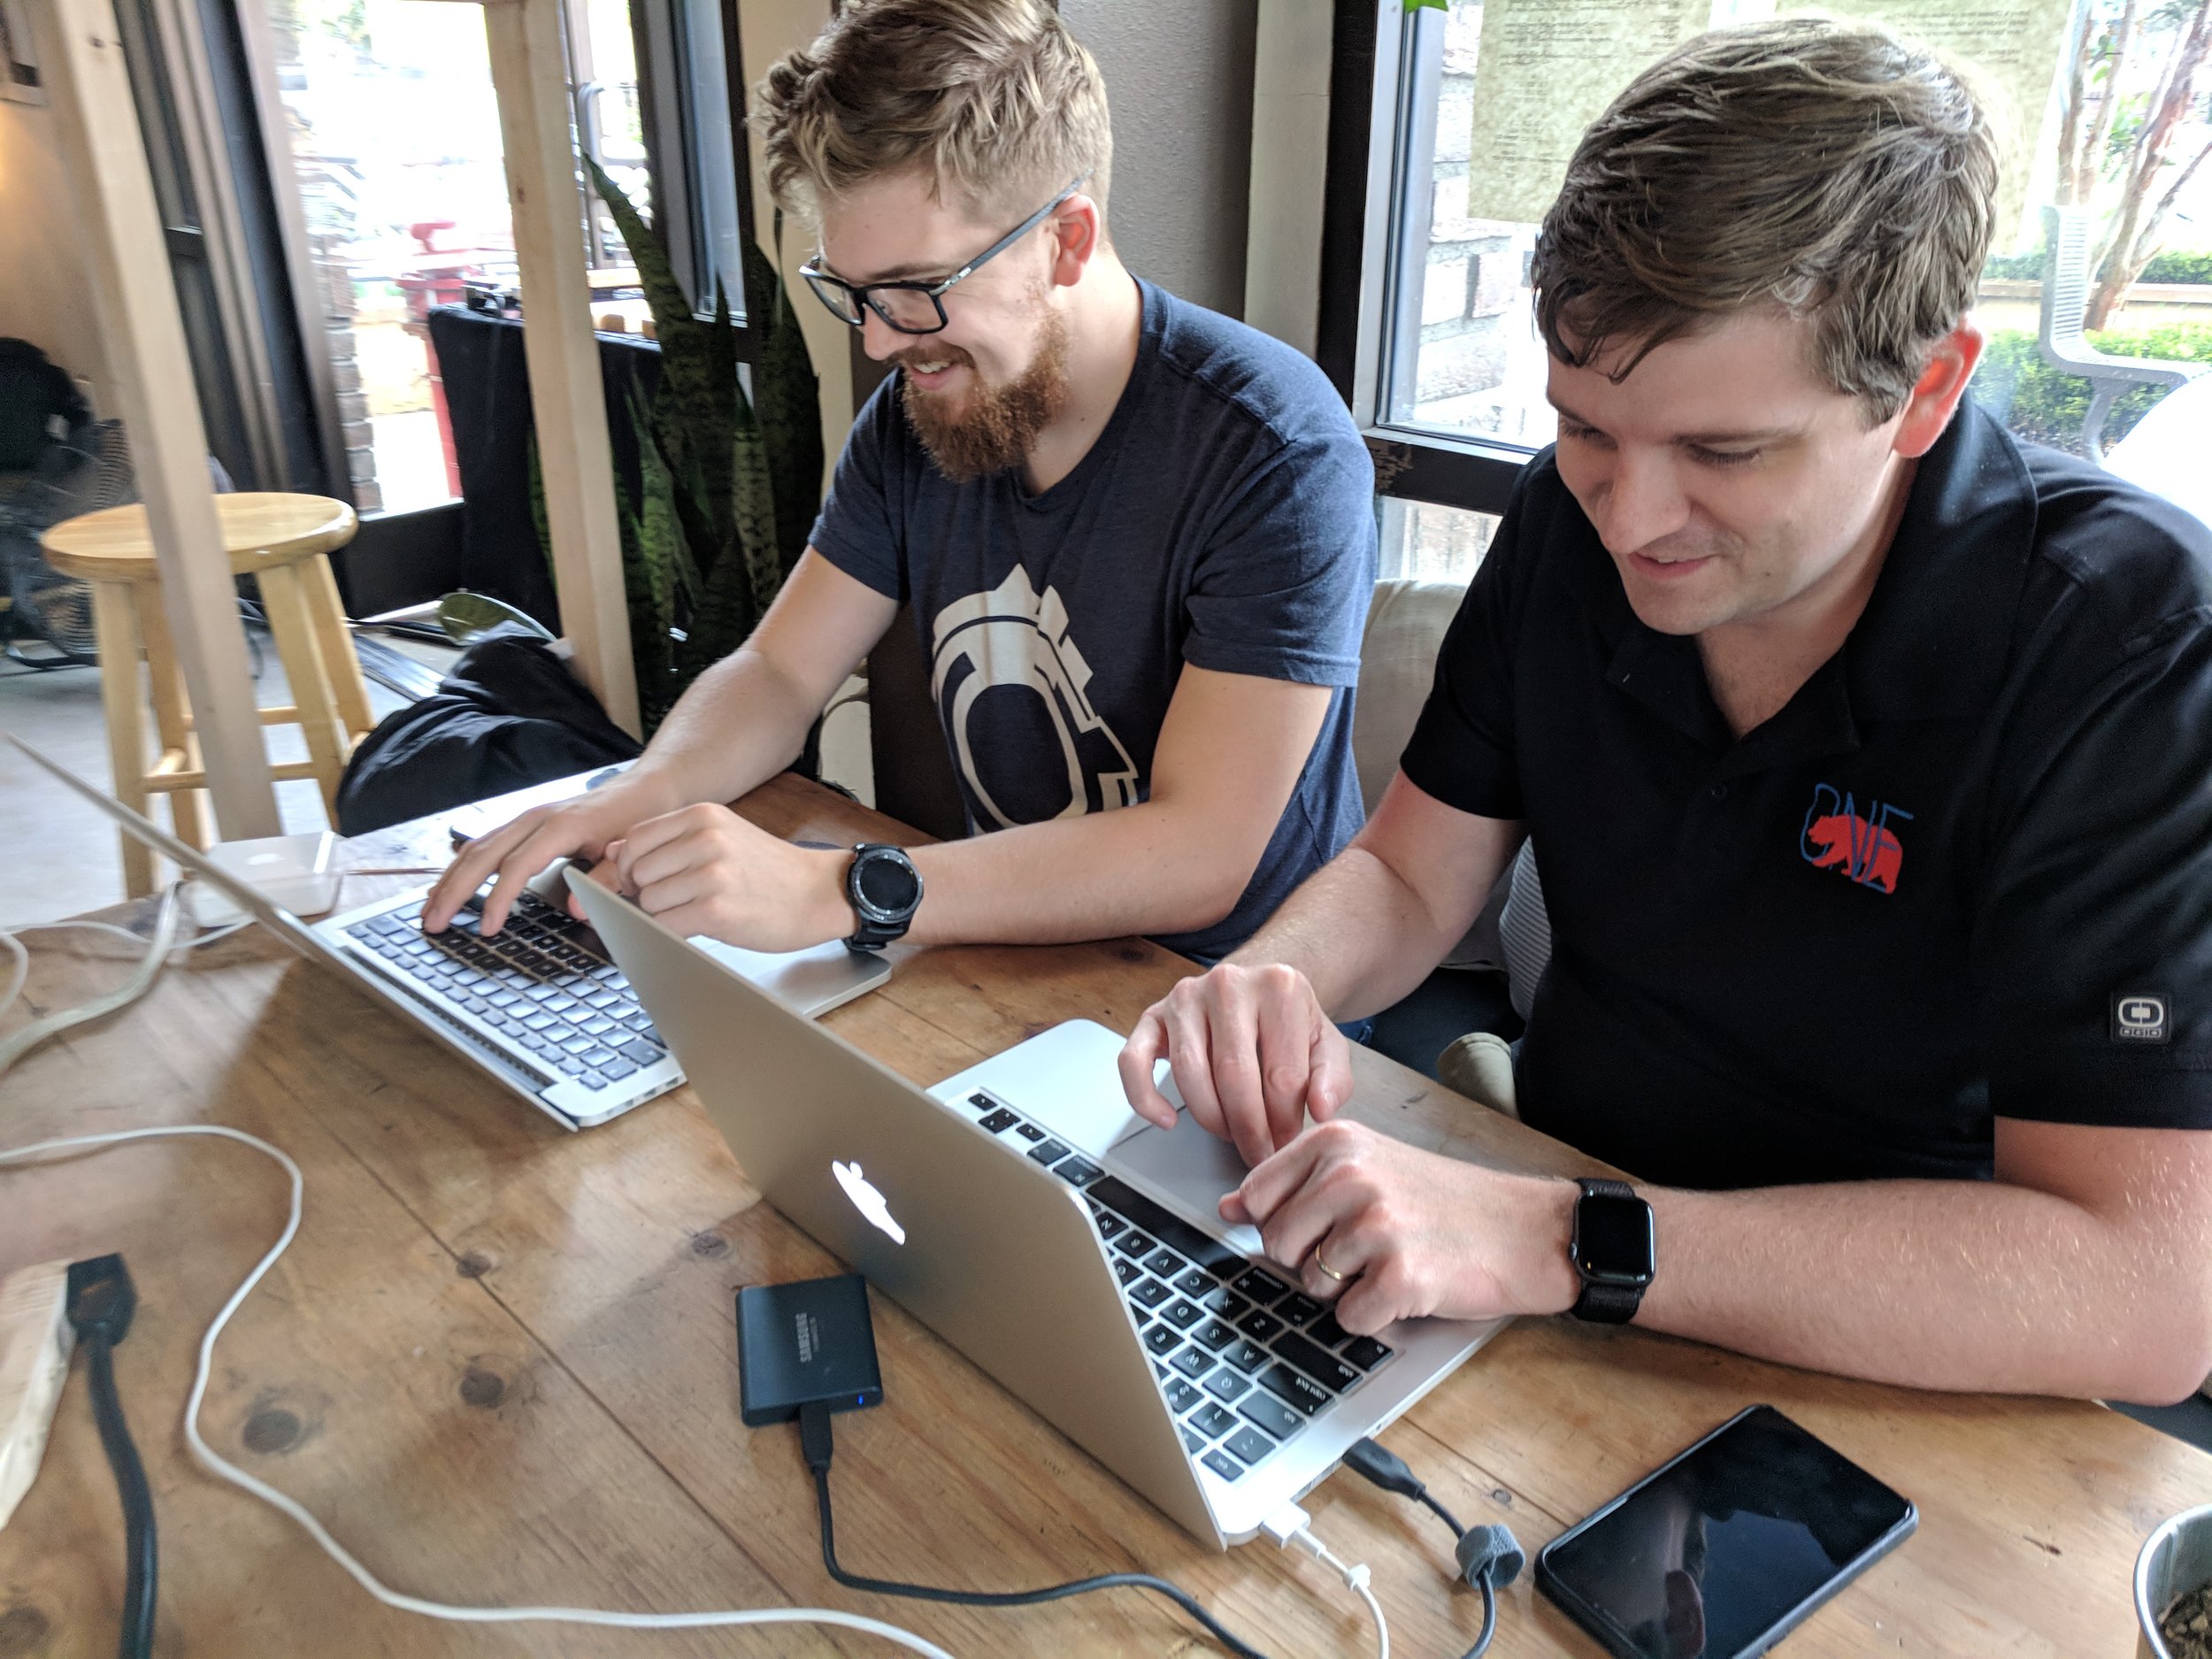
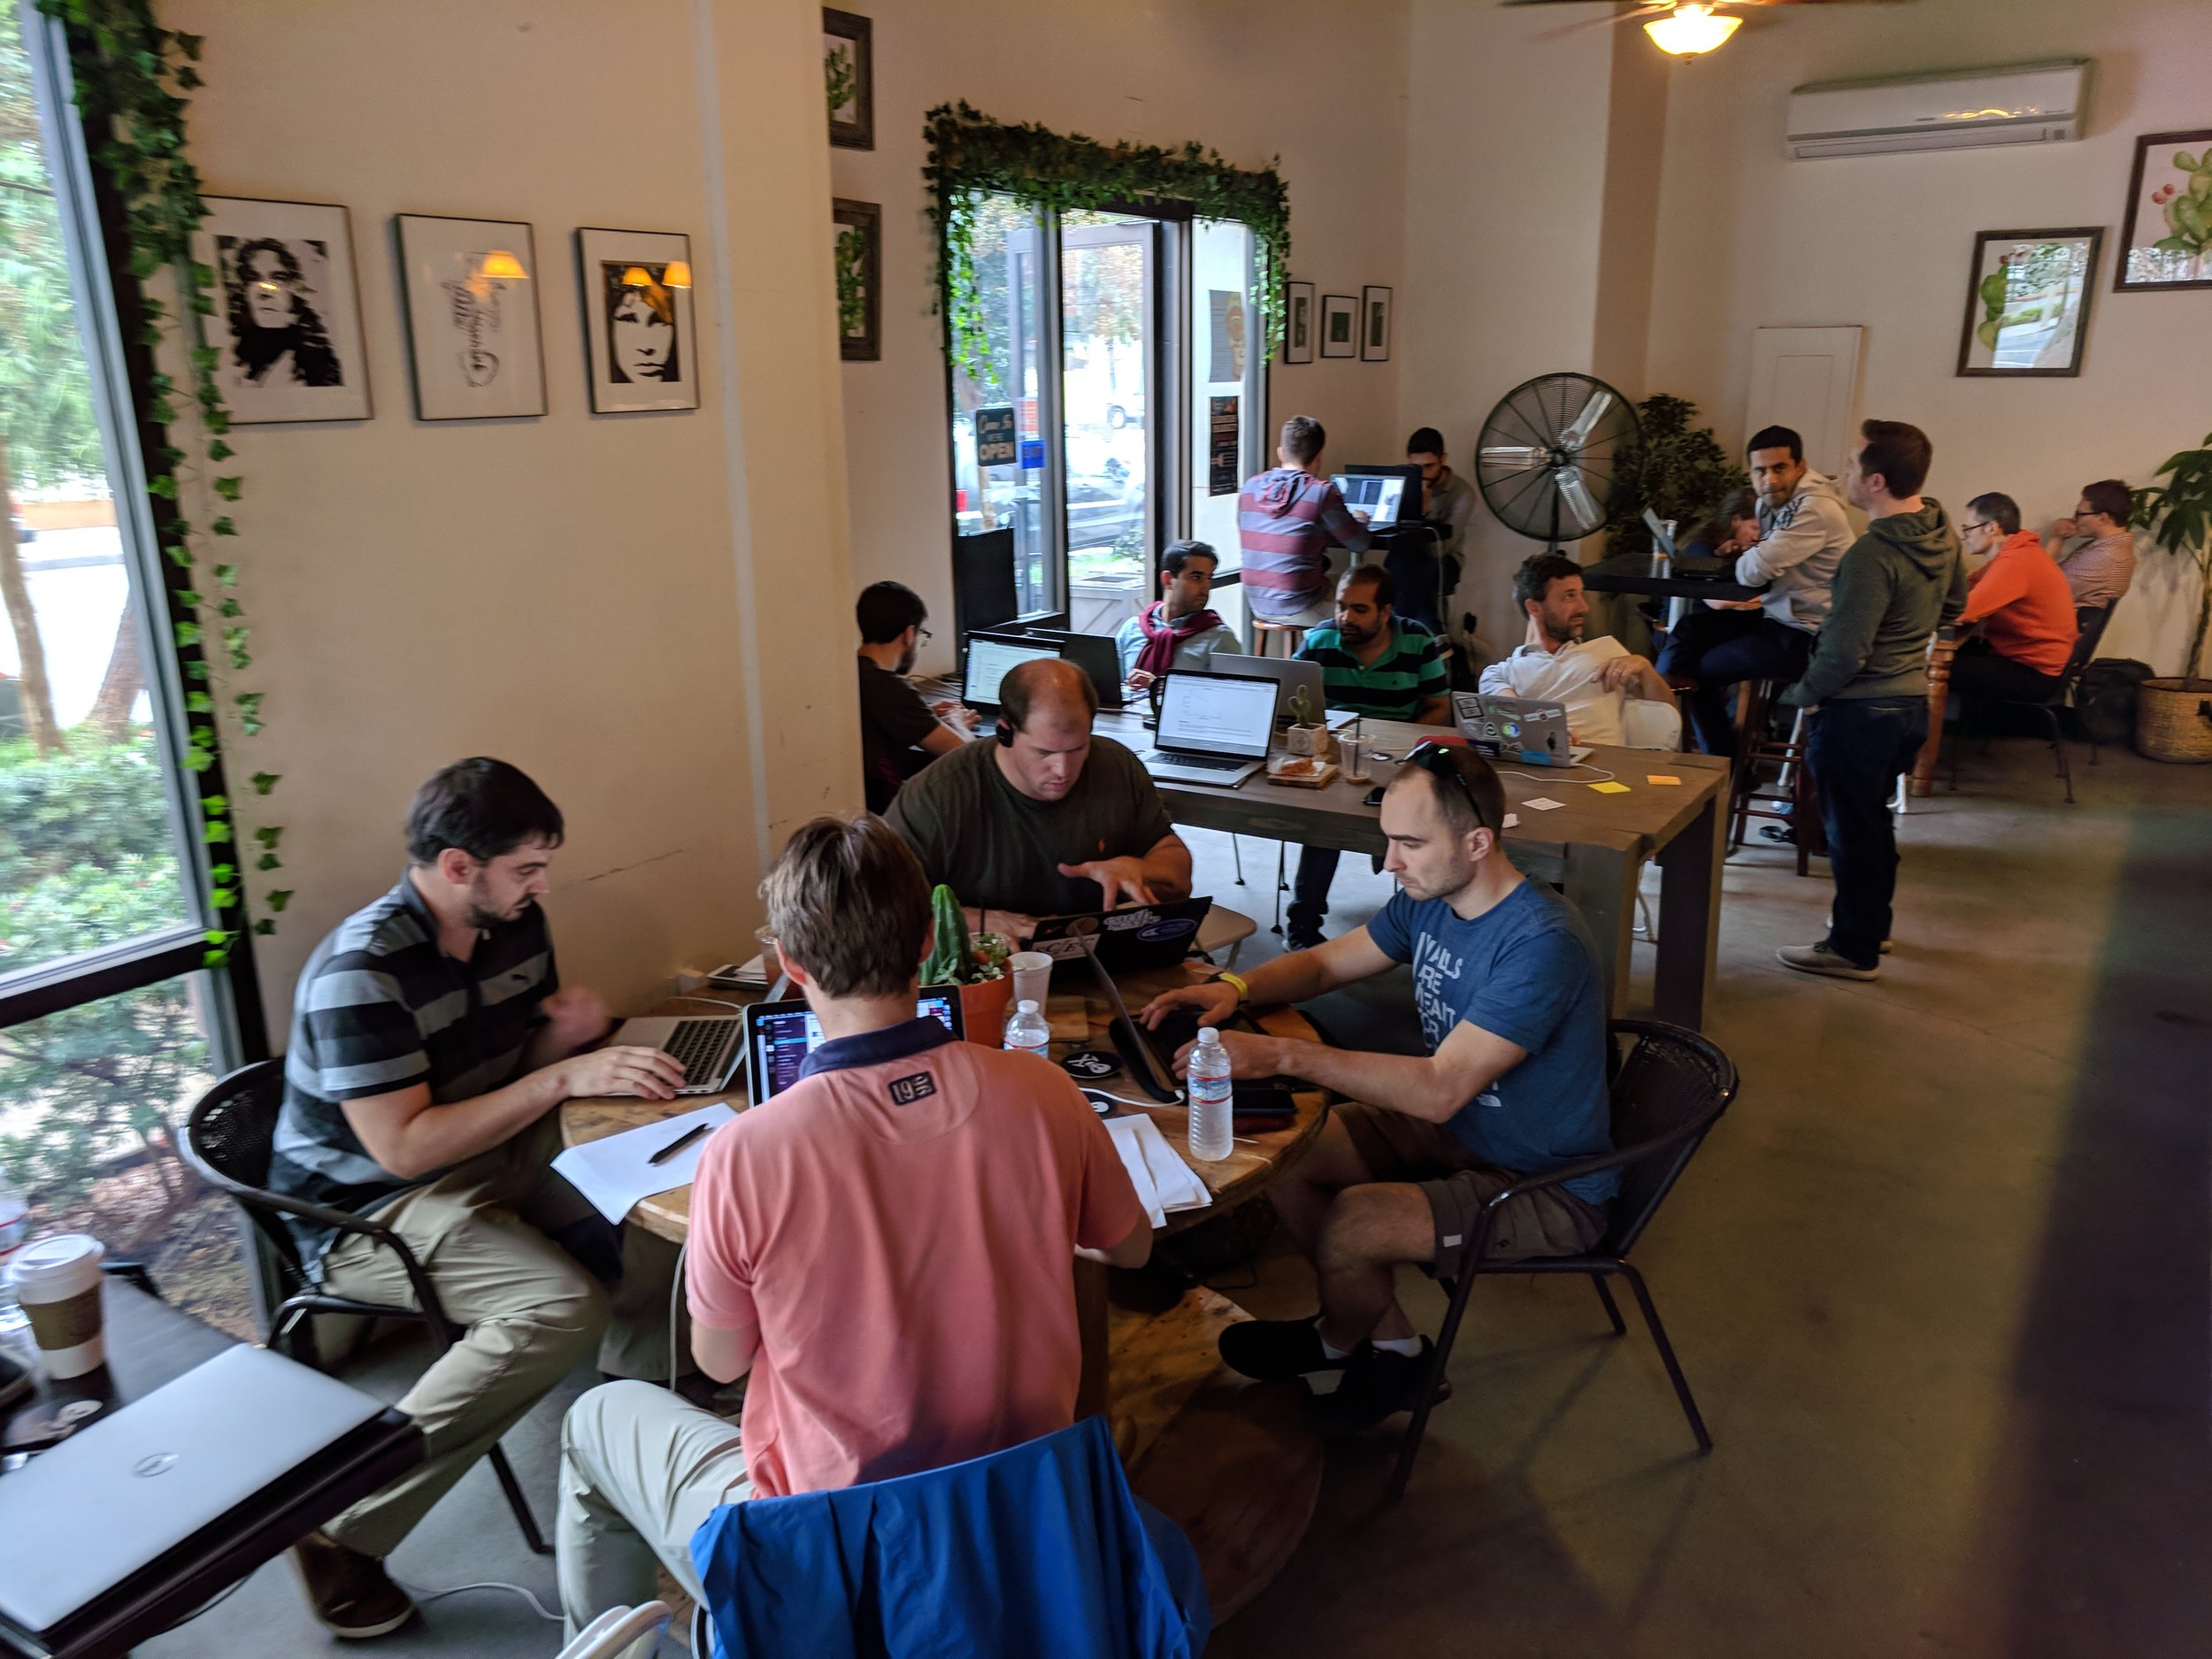
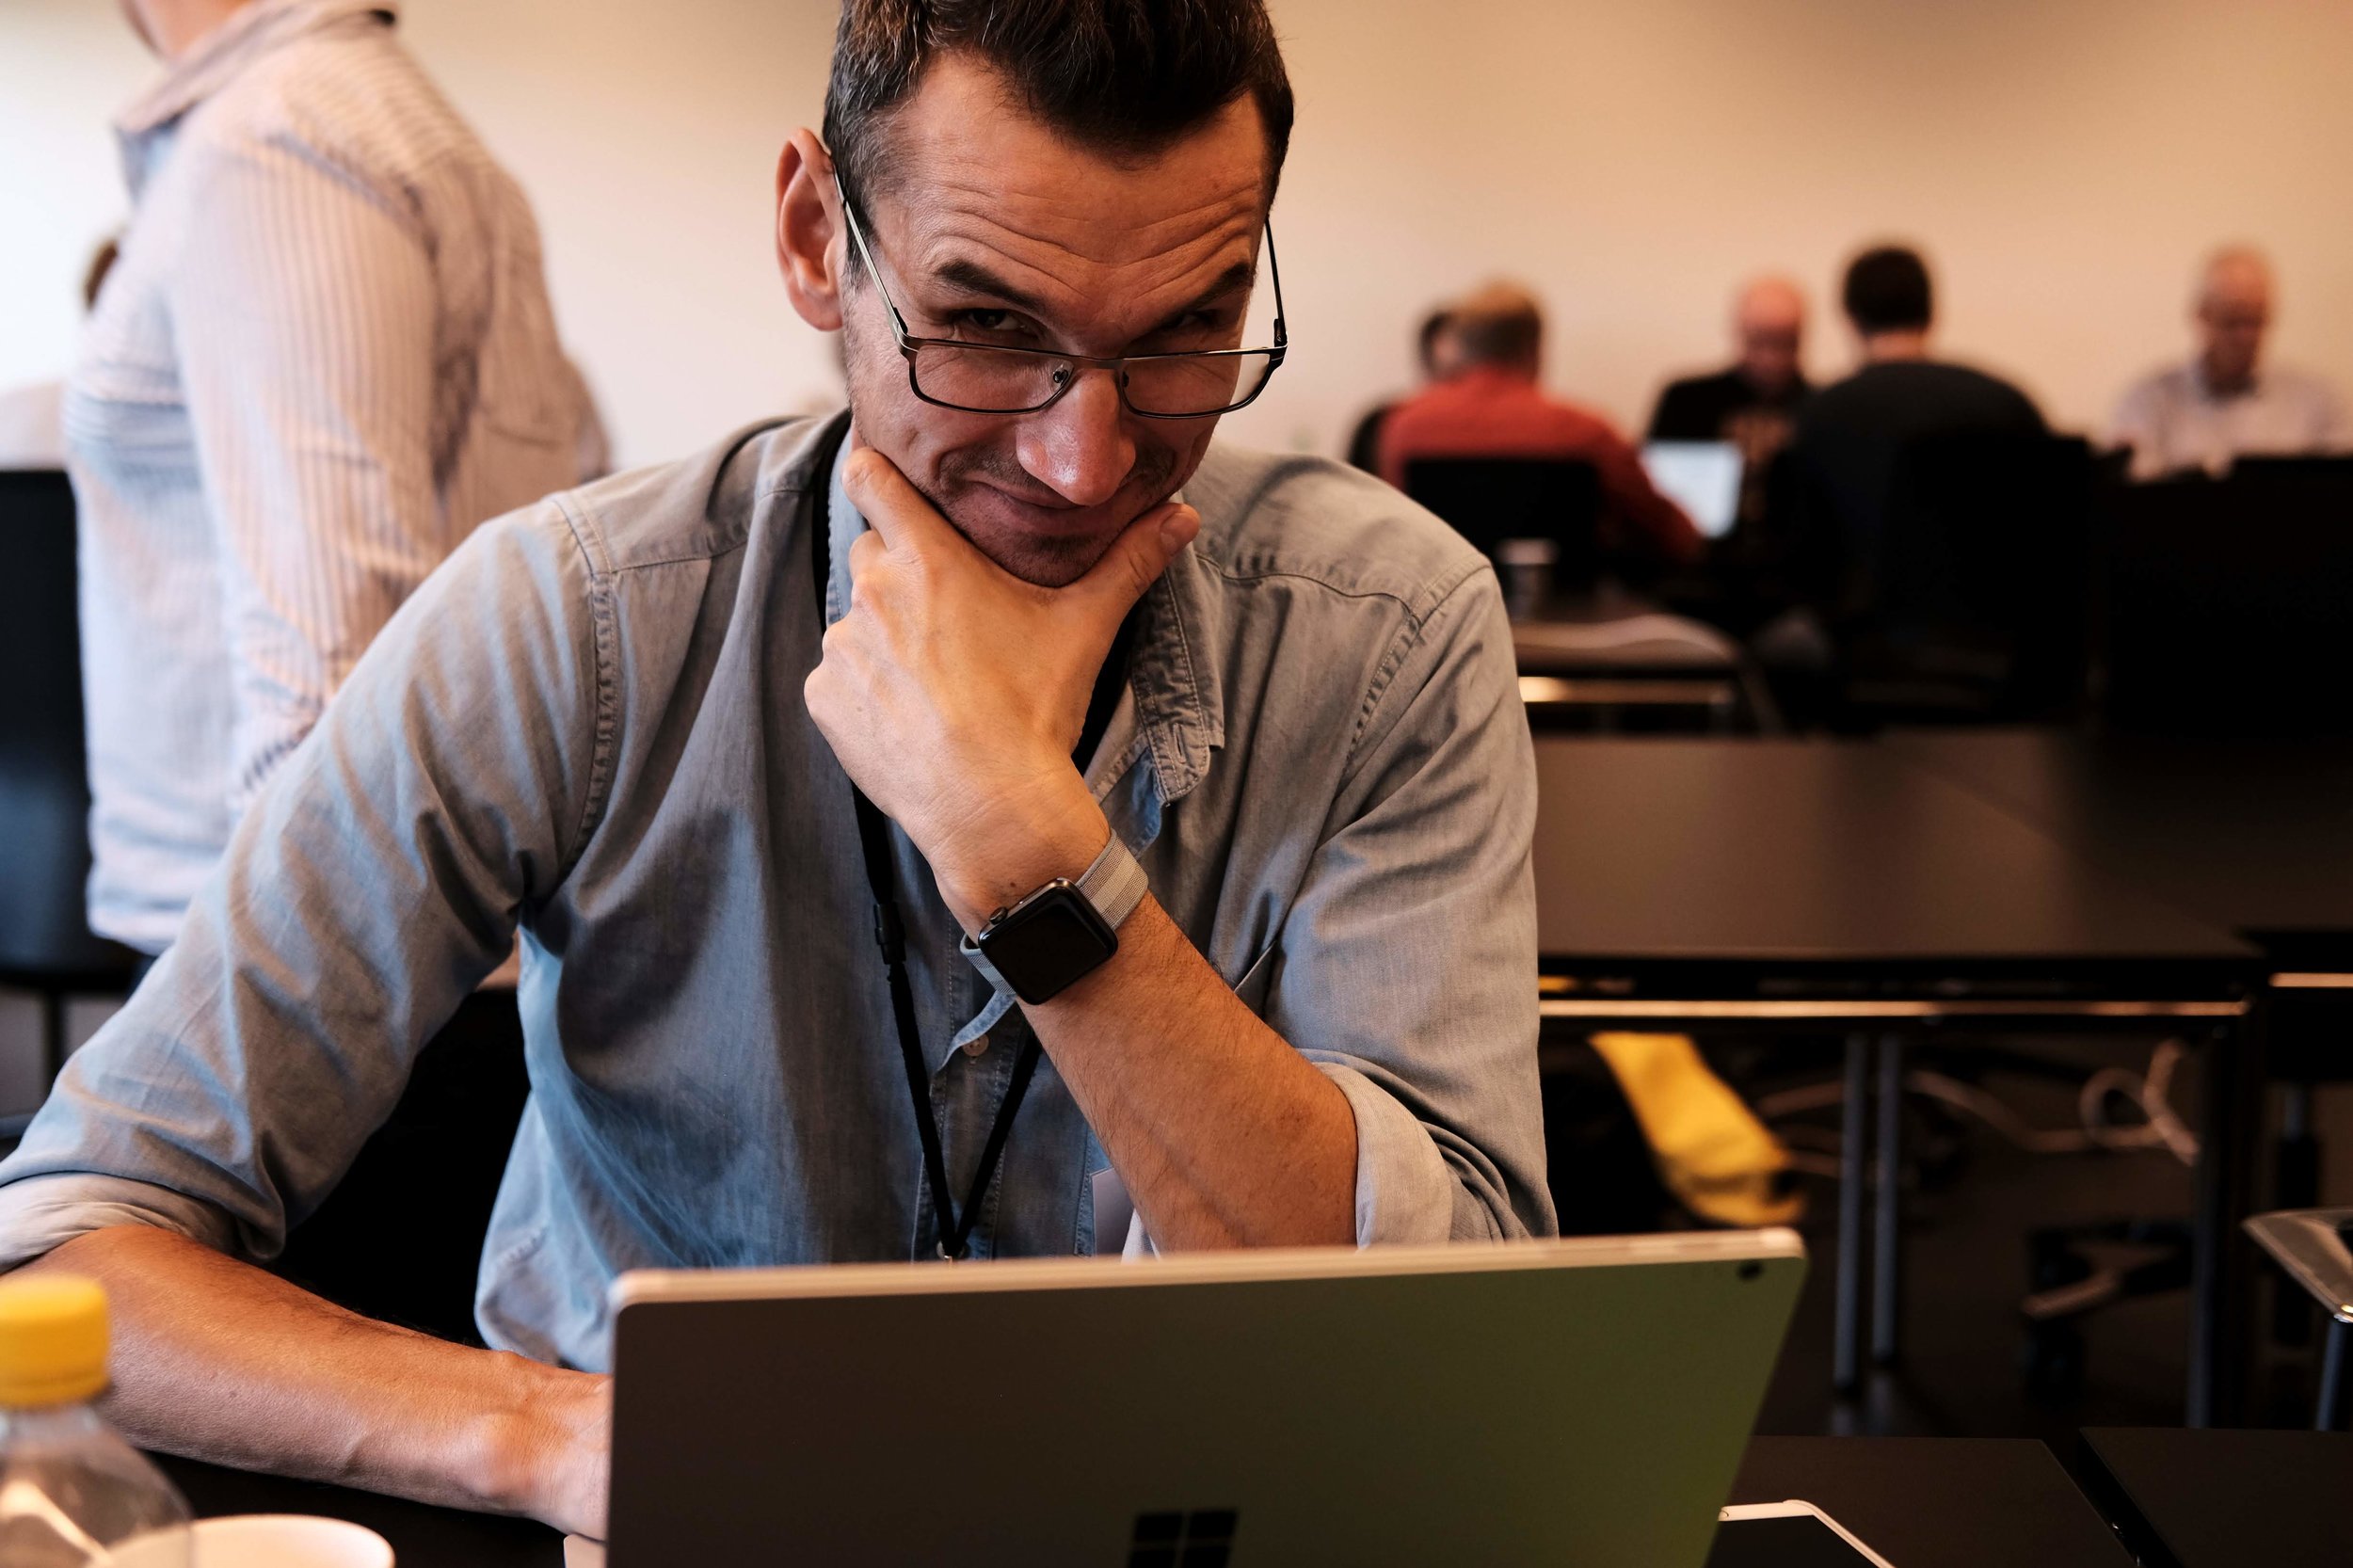
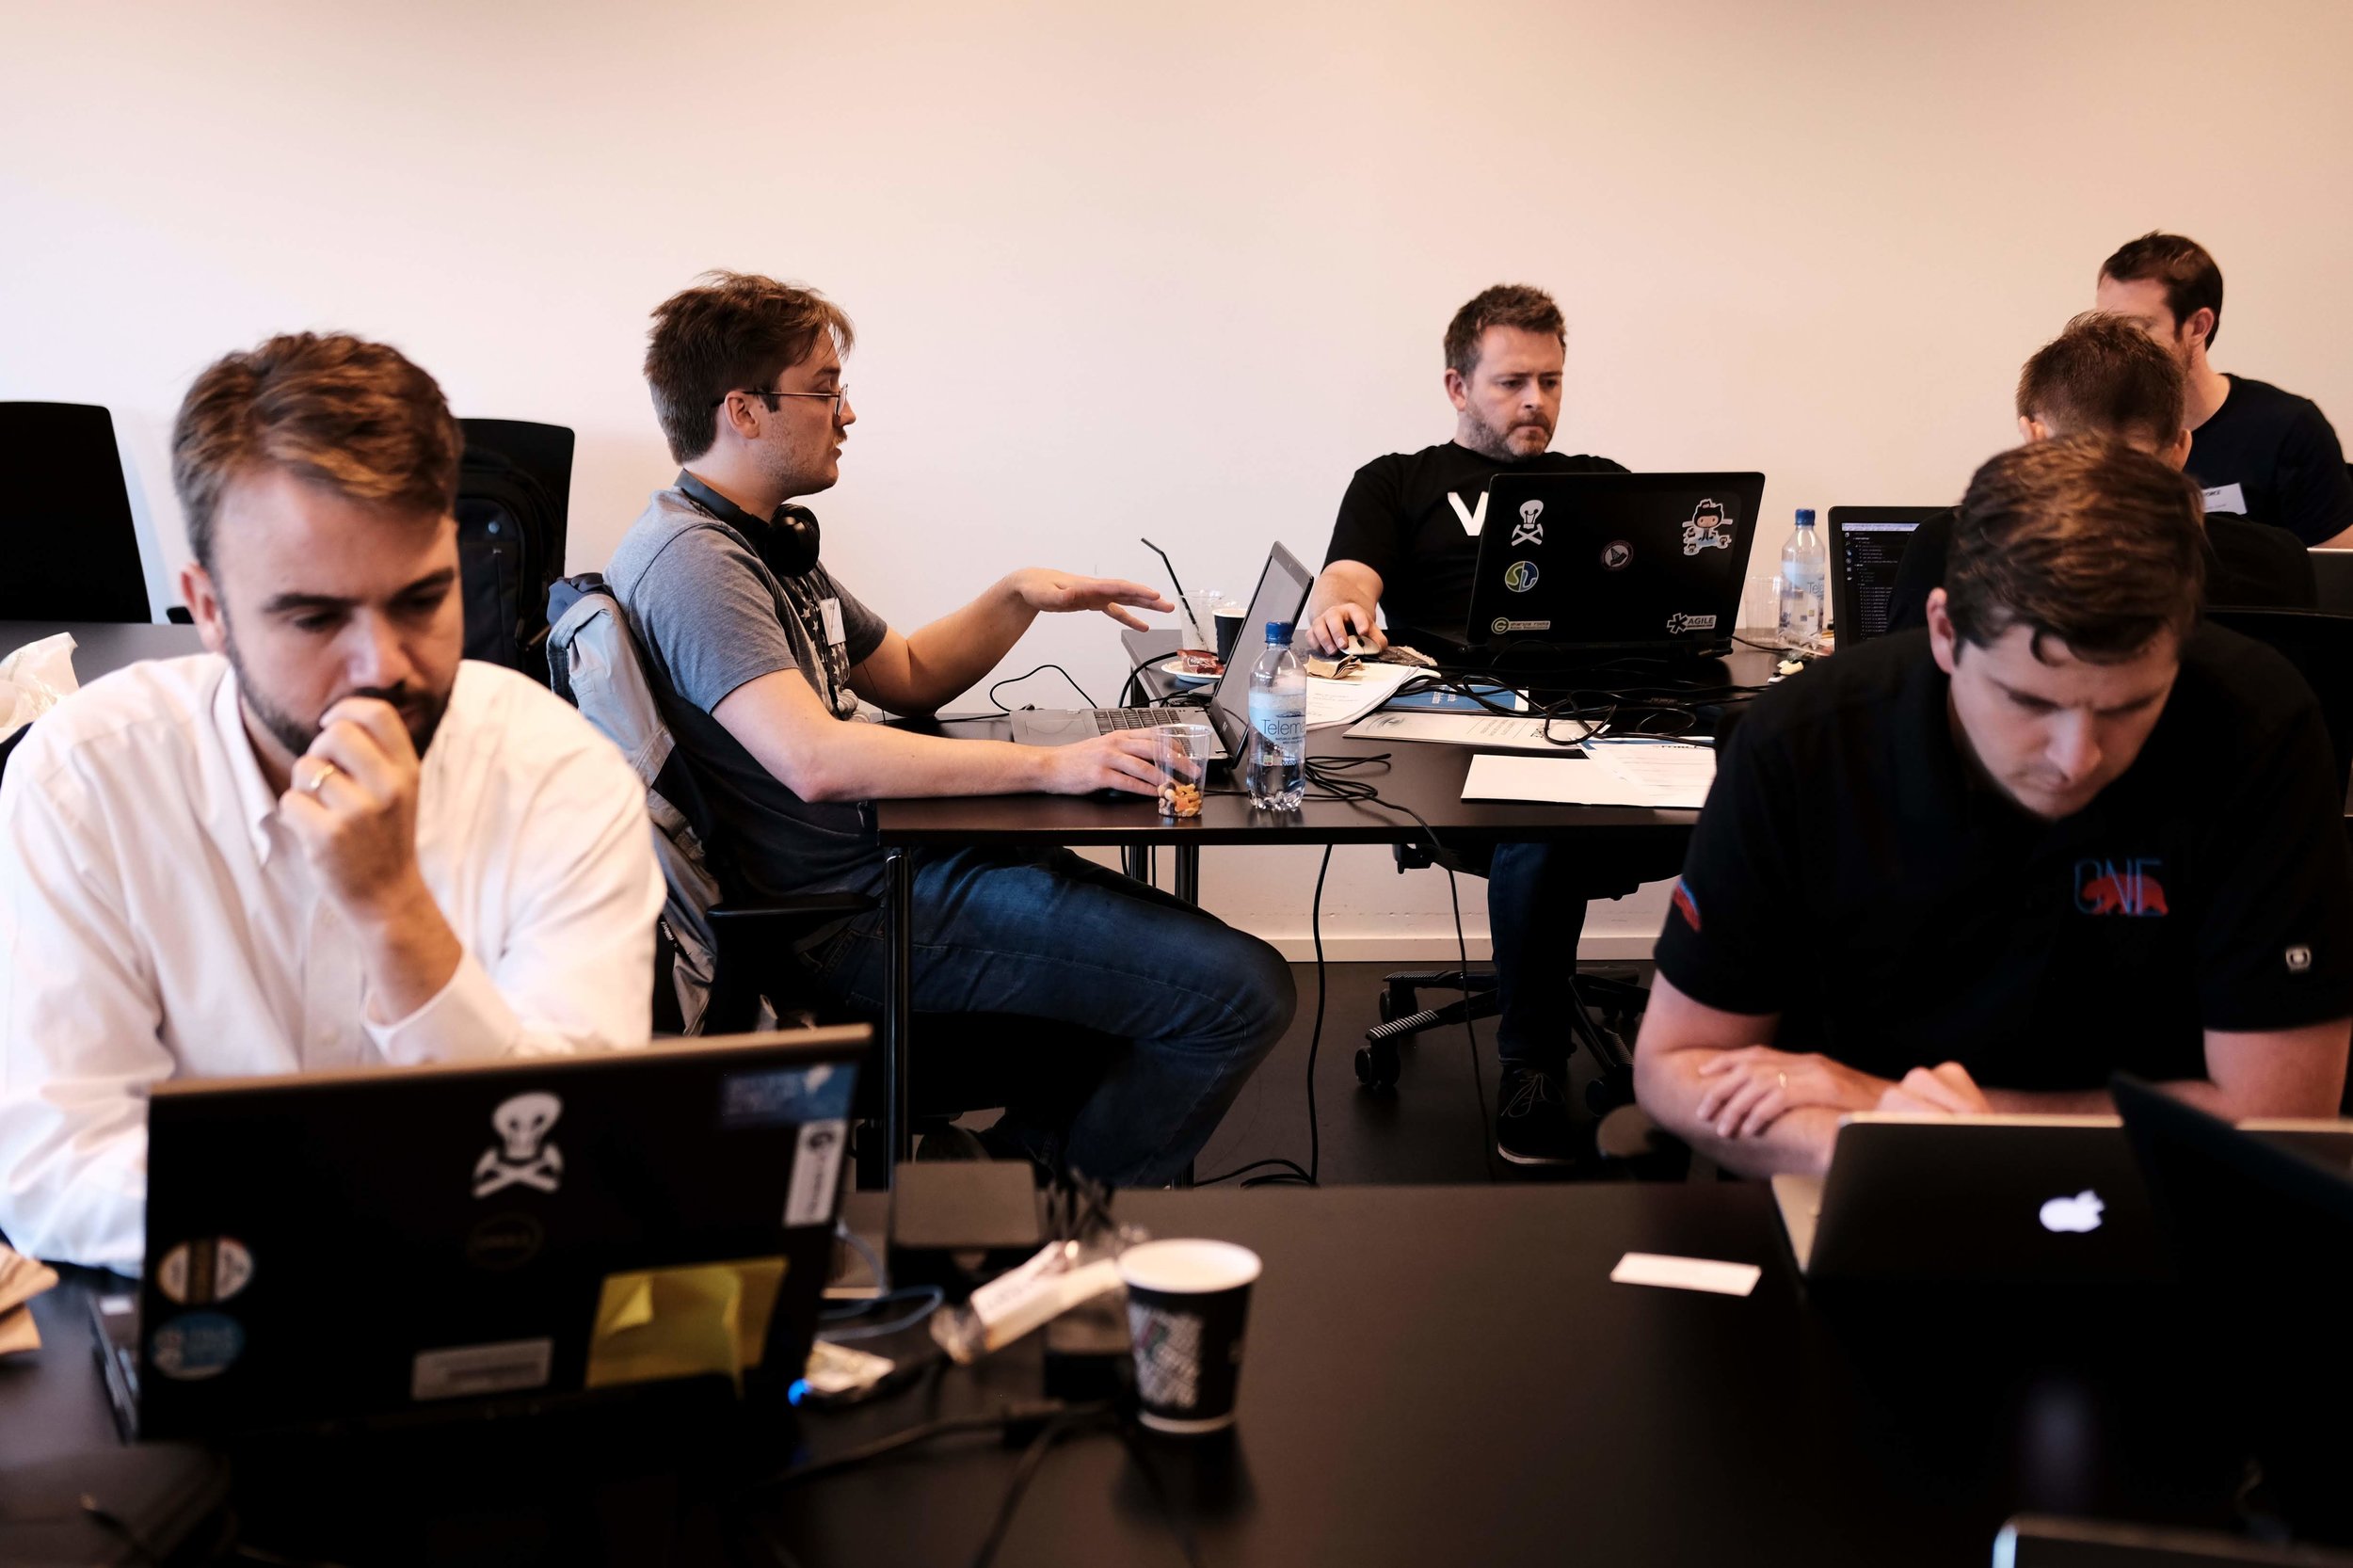
We think it’s time to refocus the hackathons as sprints — purposefully producing a sustainable, long-lasting, high quality, open source software stack that we can all use and combine into new tools, whether open or proprietary, free or commercial.

We think it’s time to bring a full-featured unconference into the mix. The half-day ‘unsessions’ open too many paths, and leave too few explored. We need more time — to share research, plan software projects, and write code.

Together, we can launch a new era in scientific computing for the subsurface.

At the core of this new era core is a new open-source software stack, created, maintained, and implemented by a community of scientists and organizations passionate about its potential.

Sign up!

Here’s the plan. We’re hosting an unconference from 5 to 11 May 2019, with full days from Monday to Friday. The event will take place at the Château de Rosay, near Rouen, France. It will be fully residential and fully catered. We have room for about 45 participants.

The goal is to lay down a road map for designing, funding, and building an open source software stack for subsurface. In the coming days and weeks, we will formulate the plan for the week, with input from the Software Underground. We want to hear from you. Propose a session! Host a sprint! Offer a bounty! There are lots of ways to get involved.

Map data: GeoBasis-DE / BKG / Google, photo: Chateauform. Click to enlarge.

If you want to be part of this effort, as a developer, an end-user, or a sponsor, then we invite you to join us.

The unconference fee will be EUR 1000, and accommodation and food will be EUR 1500. The student fees will be EUR 240 and EUR 360. There will be at least 5 bursaries of EUR 1000 available.

For the time being, we will be accepting early commitments, with a deposit of EUR 400 to secure a place (students wishing to register now should get in touch). Soon, you will be able to sign up online… we are working on a smooth process. In the meantime, click here to register your interest, share ideas for content, or sign up by paying a deposit.

Thanks for reading. We look forward to figuring this out together.


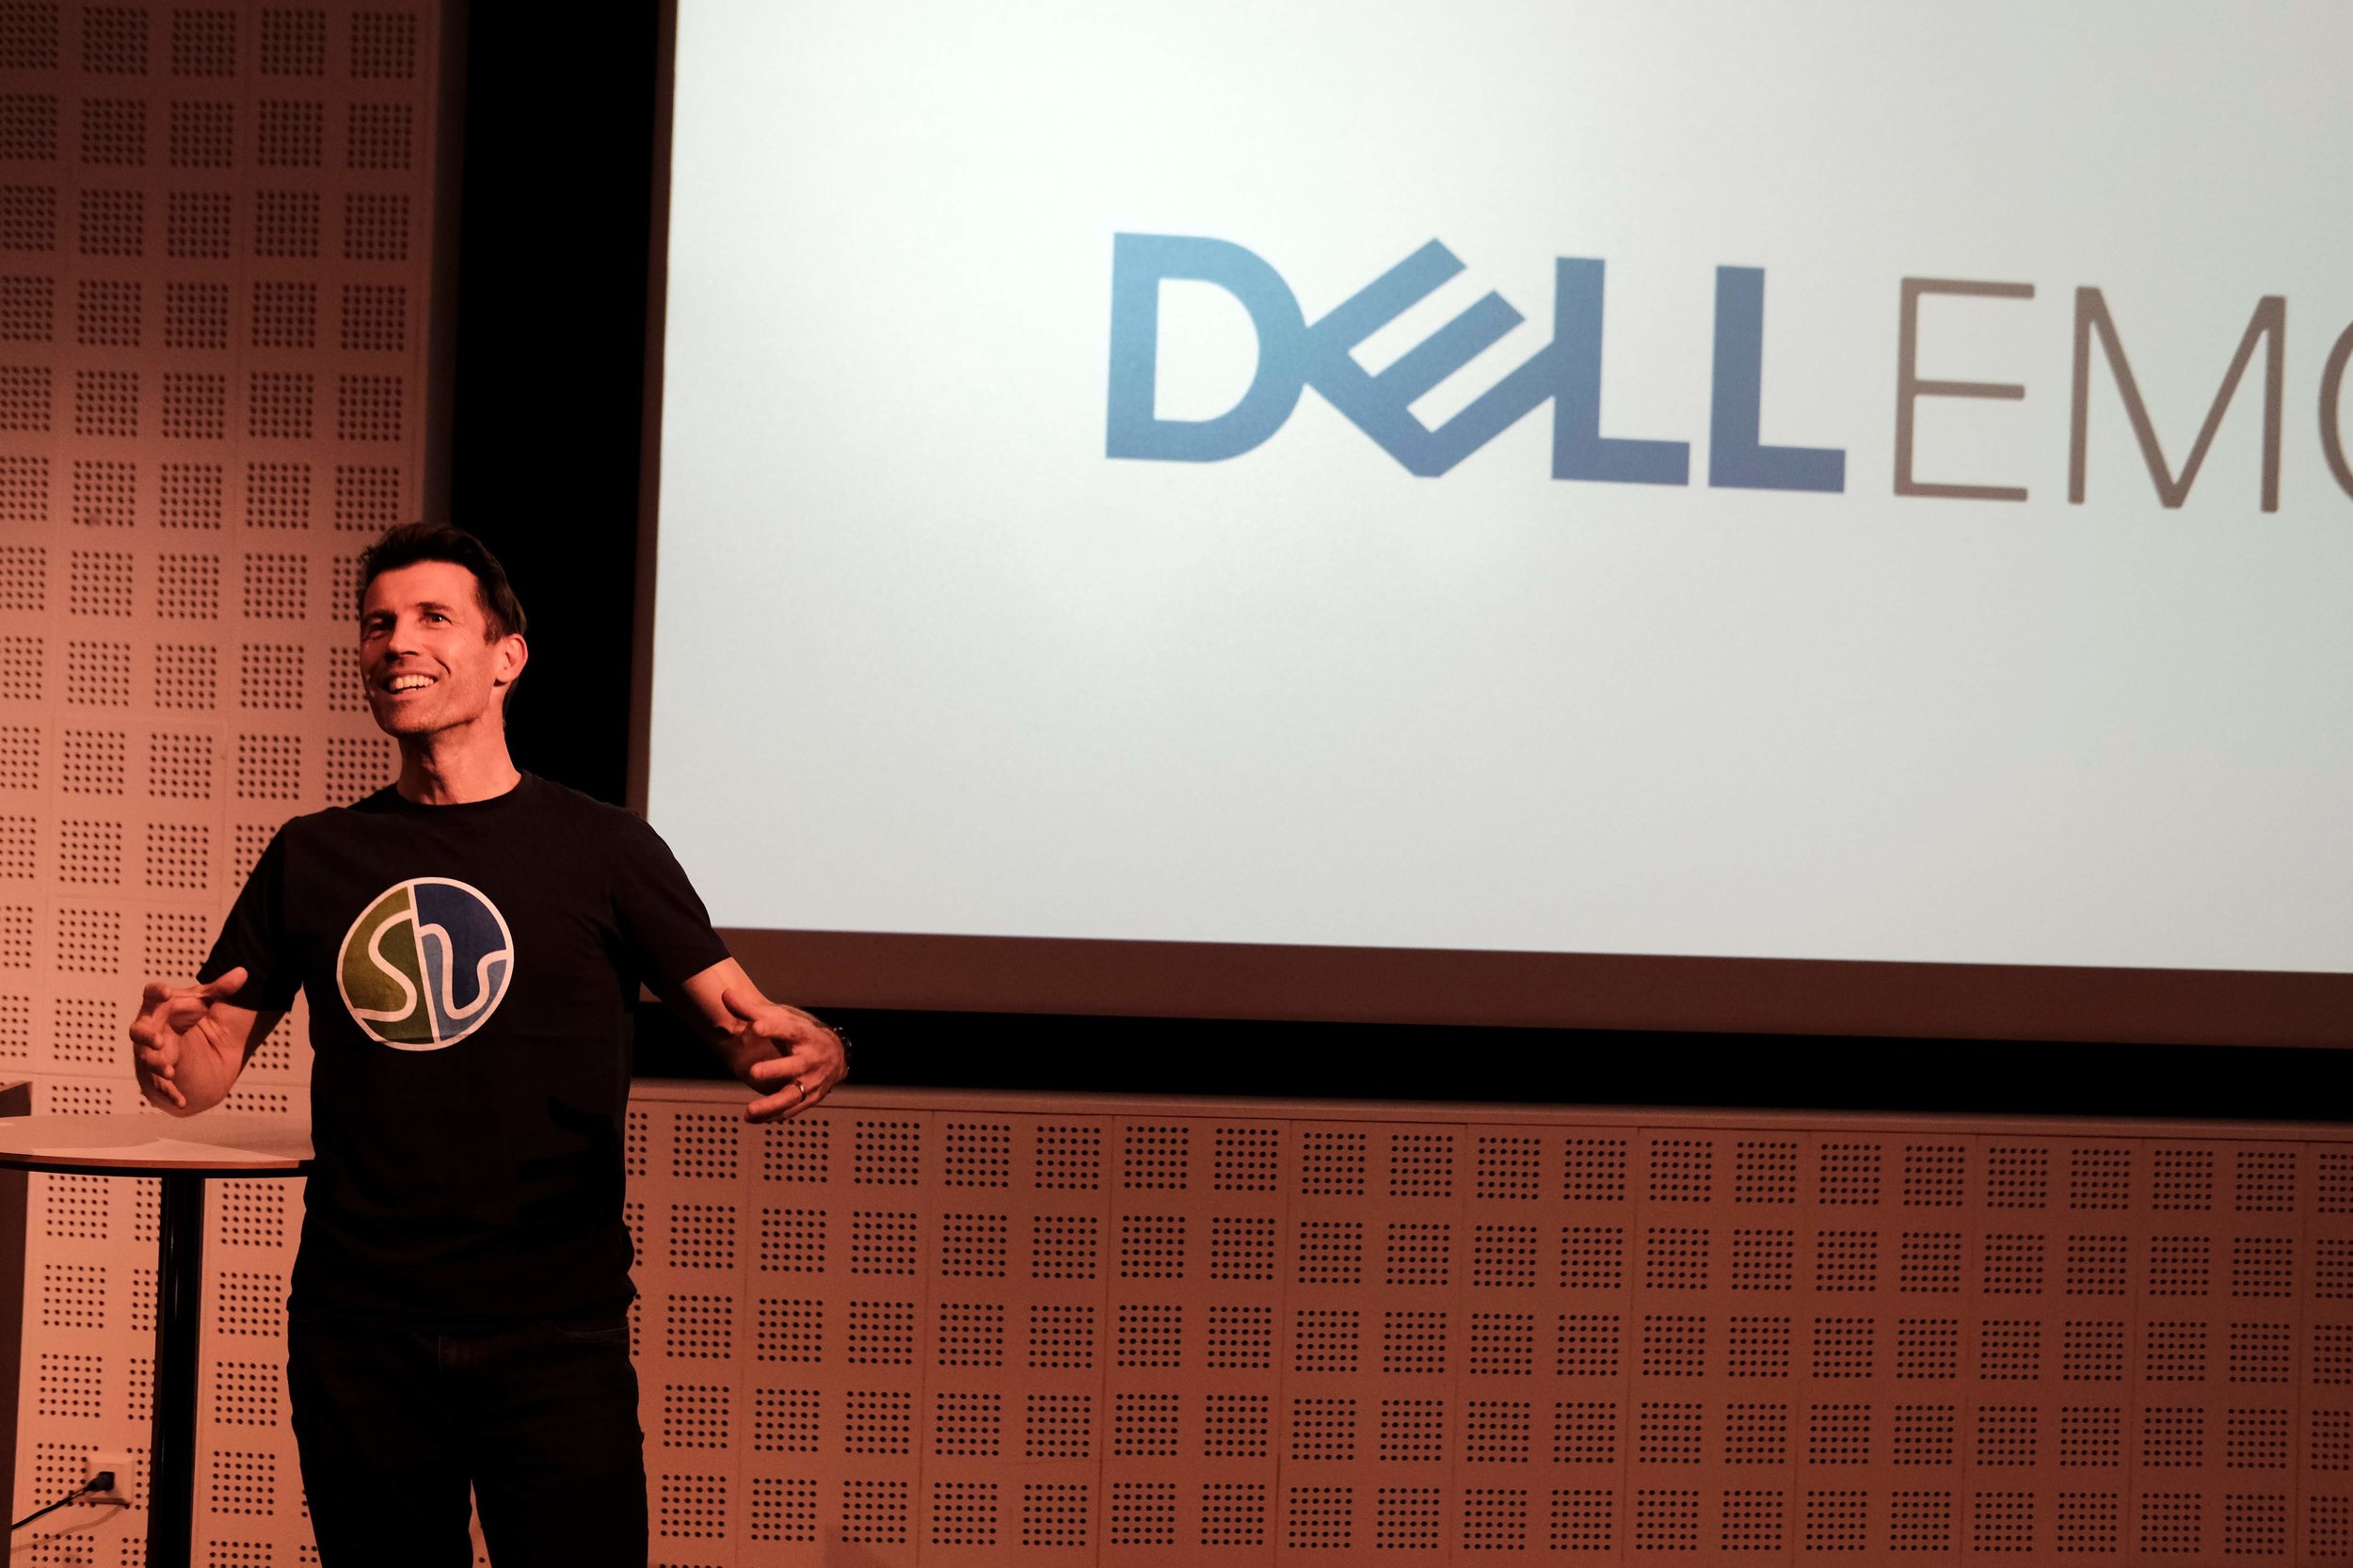
I’m delighted to be able to announce that we already have support from Dell EMC. Thanks as ever to David Holmes for his willingness to fund experiments!


In the US or Canada? Don’t despair! There will be a North American edition in Quebec in late September.

The next thing

Over the last several years, Agile has been testing some of the new ways of collaborating, centered on digital connections:

2010-2019-timeline.png
  • It all started with this blog, which started in 2010 with my move from Calgary to Nova Scotia. It’s become a central part of my professional life, but we’re all about collaboration and blogs are almost entirely one-way, so…

  • In 2011 we launched SubSurfWiki. It didn’t really catch on, although it was a good basis for some other experiments and I still use it sometimes. Still, we realized we had to do more to connect the community, so…

  • In 2012 we launched our 52 Things collaborative, open access book series. There are well over 5000 of these out in the wild now, but it made us crave a real-life, face-to-face collaboration, so…

  • In 2013 we held the first ‘unsession’, a mini-unconference, at the Canada GeoConvention. Over 50 people came to chat about unsolved problems. We realized we needed a way to actually work on problems, so…

  • Later that year, we followed up with the first geoscience hackathon. Around 15 or so of us gathered in Houston for a weekend of coding and tacos. We realized that the community needed more coding skills, so…

  • In 2014 we started teaching a one-day Python course aimed squarely at geoscientists. We only teach with subsurface data and algorithms, and the course is now 5 days long. We now needed a way to connect all these new hackers and coders, so…

  • In 2014, together with Duncan Child, we also launched Software Underground, a chat room for discussing topics related to the earth and computers. Initially it was a Google Group but in 2015 we relaunched it as an open Slack team. We wanted to double down on scientific computing, so…

  • In 2015 and 2016 we launched a new web app, Pick This (returning soon!), and grew our bruges and welly open source Python projects. We also started building more machine learning projects, and getting really good at it.

Growing and honing

We have spent the recent years growing and honing these projects. The blog gets about 10,000 readers a month. The sixth 52 Things book is on its way. We held two public unsessions this year. The hackathons have now grown to 60 or so hackers, and have had about 400 participants in total, and five of them this year already (plus three to come!). We have also taught Python to 400 geoscientists, including 250 this year alone. And the Software Underground has over 1000 members.

In short, geoscience has gone digital, and we at Agile are grateful and excited to be part of it. At no point in my career have I been more optimistic and energized than I am right now.

So it’s time for the next thing.

The next thing is starting with a new kind of event. The first one is 5 to 11 May 2019, and it’s happening in France. I’ll tell you all about it tomorrow.

Reproducibility Zoo

repro-zoo-main-banner.png

The Repro Zoo was a new kind of event at the SEG Annual Meeting this year. The goal: to reproduce the results from well-known or important papers in GEOPHYSICS or The Leading Edge. By reproduce, we meant that the code and data should be open and accessible. By results, we meant equations, figures, and other scientific outcomes.

And some of the results are scary enough for Hallowe’en :)

What we did

All the work went straight into GitHub, mostly as Jupyter Notebooks. I had a vague goal of hitting 10 papers at the event, and we achieved this (just!). I’ve since added a couple of other papers, since the inspiration for the work came from the Zoo… and I haven’t been able to resist continuing.

The scene at the Repro Zoo. An air of quiet productivity hung over the booth. Yes, that is Sergey Fomel and Jon Claerbout. Thank you to David Holmes of Dell EMC for the picture.

The scene at the Repro Zoo. An air of quiet productivity hung over the booth. Yes, that is Sergey Fomel and Jon Claerbout. Thank you to David Holmes of Dell EMC for the picture.

Here’s what the Repro Zoo team got up to, in alphabetical order:

  • Aldridge (1990). The Berlage wavelet. GEOPHYSICS 55 (11). The wavelet itself, which has also been added to bruges.

  • Batzle & Wang (1992). Seismic properties of pore fluids. GEOPHYSICS 57 (11). The water properties, now added to bruges.

  • Claerbout et al. (2018). Data fitting with nonstationary statistics, Stanford. Translating code from FORTRAN to Python.

  • Claerbout (1975). Kolmogoroff spectral factorization. Thanks to Stewart Levin for this one.

  • Connolly (1999). Elastic impedance. The Leading Edge 18 (4). Using equations from bruges to reproduce figures.

  • Liner (2014). Long-wave elastic attentuation produced by horizontal layering. The Leading Edge 33 (6). This is the stuff about Backus averaging and negative Q.

  • Luo et al. (2002). Edge preserving smoothing and applications. The Leading Edge 21 (2).

  • Yilmaz (1987). Seismic data analysis, SEG. Okay, not the whole thing, but Sergey Fomel coded up a figure in Madagascar.

  • Partyka et al. (1999). Interpretational aspects of spectral decomposition in reservoir characterization.

  • Röth & Tarantola (1994). Neural networks and inversion of seismic data. Kudos to Brendon Hall for this implementation of a shallow neural net.

  • Taner et al. (1979). Complex trace analysis. GEOPHYSICS 44. Sarah Greer worked on this one.

  • Thomsen (1986). Weak elastic anisotropy. GEOPHYSICS 51 (10). Reproducing figures, again using equations from bruges.

As an example of what we got up to, here’s Figure 14 from Batzle & Wang’s landmark 1992 paper on the seismic properties of pore fluids. My version (middle, and in red on the right) is slightly different from that of Batzle and Wang. They don’t give a numerical example in their paper, so it’s hard to know where the error is. Of course, my first assumption is that it’s my error, but this is the problem with research that does not include code or reference numerical examples.

Figure 14 from Batzle & Wang (1992). Left: the original figure. Middle: My attempt to reproduce it. Right: My attempt in red, overlain on the original.

This was certainly not the only discrepancy. Most papers don’t provide the code or data to reproduce their figures, and this is a well-known problem that the SEG is starting to address. But most also don’t provide worked examples, so the reader is left to guess the parameters that were used, or to eyeball results from a figure. Are we really OK with assuming the results from all the thousands of papers in GEOPHYSICS and The Leading Edge are correct? There’s a long conversation to have here.

What next?

One thing we struggled with was capturing all the ideas. Some are on our events portal. The GitHub repo also points to some other sources of ideas. And there was the Big Giant Whiteboard (below). Either way, there’s plenty to do (there are thousands of papers!) and I hope the zoo continues in spirit. I will take pull requests until the end of the year, and I don’t see why we can’t add more papers until then. At that point, we can start a 2019 repo, or move the project to the SEG Wiki, or consider our other options. Ideas welcome!

IMG_20181017_163926.jpg

Thank you!

The following people and organizations deserve accolades for their dedication to the idea and hard work making it a reality. Please give them a hug or a high five when you see them.

  • David Holmes (Dell EMC) and Chance Sanger worked their tails off on the booth over the weekend, as well as having the neighbouring Dell EMC booth to worry about. David also sourced the amazing Dell tech we had at the booth, just in case anyone needed 128GB of RAM and an NVIDIA P5200 graphics card for their Jupyter Notebook. (The lights in the convention centre actually dimmed when we powered up our booths in the morning.)

  • Luke Decker (UT Austin) organized a corps of volunteer Zookeepers to help manage the booth, and provided enthusiasm and coding skills. Karl Schleicher (UT Austin), Sarah Greer (MIT), and several others were part of this effort.

  • Andrew Geary (SEG) for keeping things moving along when I became delinquent over the summer. Lots of others at SEG also helped, mainly with the booth: Trisha DeLozier, Rebecca Hayes, and Beth Donica all contributed.

  • Diego Castañeda got the events site in shape to support the Repro Zoo, with a dashboard showing the latest commits and contributors.

Café con leche

At the weekend, 28 digital geoscientists gathered at MAZ Café in Santa Ana, California, to sprint on some open geophysics software projects. Teams and individuals pushed pull requests — code contributions to open source projects — left, right, and centre. Meanwhile, Senah and her team at MAZ kept us plied with coffee and horchata, with fantastic food on the side.

Because people were helping each other and contributing where they could, I found it a bit hard to stay on top of what everyone was working on. But here are some of the things I heard at the project breakdown on Sunday afternoon:

Gerard Gorman, Navjot Kukreja, Fabio Luporini, Mathias Louboutin, and Philipp Witte, all from the devito project, continued their work to bring Kubernetes cluster management to devito. Trying to balance ease of use and unlimited compute turns out to be A Hard Problem! They also supported the other teams hacking on devito.

Thibaut Astic (UBC) worked on implementing DC resistivity models in devito. He said he enjoyed the expressiveness of devito’s symbolic equation definitions, but that there were some challenges with implementing the grad, div, and curl operator matrices for EM.

Vitor Mickus and Lucas Cavalcante (Campinas) continued their work implementing a CUDA framework for devito. Again, all part of the devito project trying to give scientists easy ways to scale to production-scale datasets.

That wasn’t all for devito. Alongside all these projects, Stephen Alwon worked on adapting segyio to read shot records, Robert Walker worked on poro-elastic models for devito, and Mohammed Yadecuri and Justin Clark (California Resources) contributed too. On the second day, the devito team was joined by Felix Hermann (now Georgia Tech), with Mengmeng Yang, and Ali Siakoohi (both UBC). Clearly there’s something to this technology!

Brendon Hall and Ben Lasscock (Enthought) hacked on an open data portal concept, based on the UCI Machine Learning Repository, coincidentally based just down the road from our location. The team successfully got some examples of open data and code snippets working.

Jesper Dramsch (Heriot-Watt), Matteo Niccoli (MyCarta), Yuriy Ivanov (NTNU) and Adriana Gordon and Volodymyr Vragov (U Calgary), hacked on bruges for the weekend, mostly on its documentation and the example notebooks in the in-bruges project. Yuriy got started on a ray-tracing code for us.

Nathan Jones (California Resources) and Vegard Hagen (NTNU) did some great hacking on an interactive plotting framework for geoscience data, based on Altair. What they did looked really polished and will definitely come in useful at future hackathons.

All in all, an amazing array of projects!

This event was low-key compared to recent hackathons, and I enjoyed the slightly more relaxed atmosphere. The venue was also incredibly supportive, making my life very easy.

A big thank you as always to our sponsors, Dell EMC and Enthought. The presence of the irrepressible David Holmes and Chris Lenzsch (both Dell EMC), and Enthought’s new VP of Energy, Charlie Cosad, was greatly appreciated.

sponsors.svg.png

We will definitely be revisiting the sprint concept in the future einmal ist keinmal, as they say. Devito and bruges both got a boost from the weekend, and I think all the developers did too. So stay tuned for the next edition!

Volve: not open after all

Back in June, Equinor made the bold and exciting decision to release all its data from the decommissioned Volve oil field in the North Sea. Although the intent of the release seemed clear, the dataset did not carry a license of any kind. Since you cannot use unlicensed content without permission, this was a problem. I wrote about this at the time.

To its credit, Equinor listened to the concerns from me and others, and considered its options. Sensibly, it chose an off-the-shelf license. It announced its decision a few days ago, and the dataset now carries a Creative Commons Attribution-NonCommercial-ShareAlike license.

Unfortunately, this license is not ‘open’ by any reasonable definition. The non-commercial stipulation means that a lot of people, perhaps most people, will not be able to legally use the data (which is why non-commercial licenses are not open licenses). And the ShareAlike part means that we’re in for some interesting discussion about what derived products are, because any work based on Volve will have to carry the CC BY-NC-SA license too.

Non-commercial licenses are not open

Here are some of the problems with the non-commercial clause:

NC licenses come at a high societal cost: they provide a broad protection for the copyright owner, but strongly limit the potential for re-use, collaboration and sharing in ways unexpected by many users

  • NC licenses are incompatible with CC-BY-SA. This means that the data cannot be used on Wikipedia, SEG Wiki, or AAPG Wiki, or in any openly licensed work carrying that license.

  • NC-licensed data cannot be used commercially. This is obvious, but far-reaching. It means, for example, that nobody can use the data in a course or event for which they charge a fee. It means nobody can use the data as a demo or training data in commercial software. It means nobody can use the data in a book that they sell.

  • The boundaries of the license are unclear. It's arguable whether any business can use the data for any purpose at all, because many of the boundaries of the scope have not been tested legally. What about a course run by AAPG or SEG? What about a private university? What about a government, if it stands to realize monetary gain from, say, a land sale? All of these uses would be illiegal, because it’s the use that matters, not the commercial status of the user.

Now, it seems likely, given the language around the release, that Equinor will not sue people for most of these use cases. They may even say this. Goodness knows, we have enough nudge-nudge-wink-wink agreements like that already in the world of subsurface data. But these arrangements just shift the onus onto the end use and, as we’ve seen with GSI, things can change and one day you wake up with lawsuits.

ShareAlike means you must share too

Creative Commons licenses are, as the name suggests, intended for works of creativity. Indeed, the whole concept of copyright, depends on creativity: copyright protects works of creative expression. If there’s no creativity, there’s no basis for copyright. So for example, a gamma-ray log is unlikely to be copyrightable, but seismic data is (follow the GSI link above to find out why). Non-copyrightable works are not covered by Creative Commons licenses.

All of which is just to help explain some of the language in the CC BY-NC-SA license agreement, which you should read. But the key part is in paragraph 4(b):

You may distribute, publicly display, publicly perform, or publicly digitally perform a Derivative Work only under the terms of this License

What’s a ‘derivative work’? It’s anything ‘based upon’ the licensed material, which is pretty vague and therefore all-encompassing. In short, if you use or show Volve data in your work, no matter how non-commercial it is, then you must attach a CC BY-NC-SA license to your work. This is why SA licenses are sometimes called ‘viral’.

By the way, the much-loved F3 and Penobscot datasets also carry the ShareAlike clause, so any work (e.g. a scientific paper) that uses them is open-access and carries the CC BY-SA license, whether the author of that work likes it or not. I’m pretty sure no-one in academic publishing knows this.

By the way again, everything in Wikipedia is CC BY-SA too. Maybe go and check your papers and presentations now :)

problems-dont-have.png

What should Equinor do?

My impression is that Equinor is trying to satisfy some business partner or legal edge case, but they are forgetting that they have orders of magnitude more capacity to deal with edge cases than the potential users of the dataset do. The principle at work here should be “Don’t solve problems you don’t have”.

Encumbering this amazing dataset with such tight restrictions effectively kills it. It more or less guarantees it cannot have the impact I assume they were looking for. I hope they reconsider their options. The best choice for any open data is CC-BY.

Reproduce this!

logo_simple.png

There’s a saying in programming: untested code is broken code. Is unreproducible science broken science?

I hope not, because geophysical research is — in general — not reproducible. In other words, we have no way of checking the results. Some of it, hopefully not a lot of it, could be broken. We have no way of knowing.

Next week, at the SEG Annual Meeting, we plan to change that. Well, start changing it… it’s going to take a while to get to all of it. For now we’ll be content with starting.

We’re going to make geophysical research reproducible again!

Welcome to the Repro Zoo!

If you’re coming to SEG in Anaheim next week, you are hereby invited to join us in Exposition Hall A, Booth #749.

We’ll be finding papers and figures to reproduce, equations to implement, and data tables to digitize. We’ll be hunting down datasets, recreating plots, and dissecting derivations. All of it will be done in the open, and all the results will be public and free for the community to use.

You can help

There are thousands of unreproducible papers in the geophysical literature, so we are going to need your help. If you’ll be in Anaheim, and even if you’re not, here some things you can do:

That’s all there is to it! Whether you’re a coder or an interpreter, whether you have half an hour or half a day, come along to the Repro Zoo and we’ll get you started.

Figure 1 from Connolly’s classic paper on elastic impedance. This is the kind of thing we’ll be reproducing.

Figure 1 from Connolly’s classic paper on elastic impedance. This is the kind of thing we’ll be reproducing.

FORCE ML Hackathon: project round-up

The FORCE Machine Learning Hackathon last week generated hundreds of new relationships and nine new projects, including seven new open source tools. Here’s the full run-down, in no particular order…


Predicting well rates in real time

Team Virtual Flow Metering: Nils Barlaug, Trygve Karper, Stian Laagstad, Erlend Vollset (all from Cognite) and Emil Hansen (AkerBP).

Tech: Cognite Data Platform, scikit-learn. GitHub repo.

Project: An engineer from AkerBP brought a problem: testing the rate from a well reduces the pressure and therefore reduces the production rate for a short time, costing about $10k per day. His team investigated whether they could instead predict the rate from other known variables, thereby reducing the number of expensive tests.

This project won the Most Commercial Potential award.

The predicted flow rate (blue) compared to the true flow rate (orange). The team used various models, from multilinear regression to boosted trees.


Reinforcement learning tackles interpretation

Team Gully Attack: Steve Purves, Eirik Larsen, JB Bonas (all Earth Analytics), Aina Bugge (Kalkulo), Thormod Myrvang (NTNU), Peder Aursand (AkerBP).

Tech: keras-rl. GitHub repo.

Project: Deep reinforcement learning has proven adept at learning, and winning, games, and at other tasks including image segmentation. The team tried training an agent to pick these channels in the Parihaka 3D, as well as some other automatic interpretation approaches.

The agent learned something, but in the end it did not prevail. The team learned lots, and did prevail!

This project won the Most Creative Idea award.

Early in training, the learning agent wanders around the image (top left). After an hour of training, the agent tends to stick to the gullies (right).


A new kind of AVO crossplot?

Team ASAP: Per Avseth (Dig), Lucy MacGregor (Rock Solid Images), Lukas Mosser (Imperial), Sandeep Shelke (Emerson), Anders Draege (Equinor), Jostein Heredsvela (DEA), Alessandro Amato del Monte (ENI).

Tech: t-SNE, UMAP, VAE. GitHub repo.

Project: If you were trying to come up with a new approach to AVO analysis, these are the scientists you’d look for. The idea was to reduce the dimensionality of the input traces — using first t-SNE and UMAP then a VAE. This resulted in a new 2-space in which interesting clusters could be probed, chiefly by processing synthetics with known variations (e.g. in thickness or porosity).

This project won the Best In Show award. Look out for the developments that come from this work!

Top: Illustration of the variational autoencoder, which reduces the input data (top left) into some abstract representation — a crossplot, essentially (top middle) — and can also reconstruct the data, but without the features that did not discriminate between the datasets, effectively reducing noise (top right).

The lower image shows the interpreted crossplot (left) and the implied distribution of rock properties (right).


Acquiring seismic with crayons

Team: Jesper Dramsch (Technical University of Denmark), Thilo Wrona (University of Bergen), Victor Aare (Schlumberger), Arno Lettman (DEA), Alf Veland (NPD).

Tech: pix2pix GAN (TensorFlow). GitHub repo.

Project: Not everything tht looks like a toy is a toy. The team spent a few hours drawing cartoons of small seismic sections, then re-trained the pix2pix GAN on them. The result — an app (try it!) that turns sketches into seismic!

This project won the People’s Choice award.

A sketch of a salt diapir penetrating geological layers (left) and the inferred seismic expression, generated by the neural network. In principal, the model could also be trained to work in the other direction.

A sketch of a salt diapir penetrating geological layers (left) and the inferred seismic expression, generated by the neural network. In principal, the model could also be trained to work in the other direction.


Extracting show depths and confidence from PDFs

Team: Florian Basier (Emerson), Jesse Lord (Kadme), Chris Olsen (ConocoPhillips), Anne Estoppey (student), Kaouther Hadji (Accenture).

Tech: sklearn, PyPDF2, NLTK, JavaScript. GitHub repo.

Project: A couple of decades ago, the last great digital revolution gave us PDFs. Lots of PDFs. But these pseudodigital documents still need to be wrangled into Proper Data. This team took on that project, trying in particular to extract both the depth of a show, and the confidence in its identification, from well reports.

This project won the Best Presentation award.

Kaouther Hadji (left), Florian Basier, Jesse Lord, and Anne Estoppey (right).

Kaouther Hadji (left), Florian Basier, Jesse Lord, and Anne Estoppey (right).


Grain size and structure from core images

Team: Eirik Time, Xiaopeng Liao, Fahad Dilib (all Equinor), Nathan Jones (California Resource Corp), Steve Braun (ExxonMobil), Silje Moeller (Cegal).

Tech: sklearn, skimage, fast.ai. GitHub repo.

Project: One of the many teams composed of professionals from all over the industry — it’s amazing to see this kind of collaboration. The team did a great job of breaking the problem down, going after what they could and getting some decent results. An epic task, but so many interesting avenues — we need more teams on these problems!

The pipeline was as ambitious as it looks. But this is a hard problem that will take some time to get good at. Kudos to this team for starting to dig into it and for making amazing progress in just 2 days.


Learning geological age from bugs

Team: David Wade (Equinor), Per Olav Svendsen (Equinor), Bjoern Harald Fotland (Schlumberger), Tore Aadland (University of Bergen), Christopher Rege (Cegal).

Tech: scikit-learn (random forest). GitHub repo.

Project: The team used DEX files from five wells from the recently released Volve dataset from Equinor. The goal was to learn to predict geological age from biostratigraphic species counts. They made substantial progress — and highlighted what a great resource Volve will be as the community explores it and publishes results like these.

David Wade and Per Olav Svendsen of Equinor (top), and some results (bottom)


Lost in 4D space!

Team: Andres Hatloey, Doug Hakkarinen, Mike Brhlik (all ConocoPhillips), Espen Knudsen, Raul Kist, Robin Chalmers (all Cegal), Einar Kjos (AkerBP).

Tech: scikit-learn (random forest regressor). GitHub repo.

Project: Another cross-industry collaboration. In their own words, the team set out to “identify trends between 4D seismic and well measurements in order to calculate reservoir pressures and/or thickness between well control”. They were motivated by real data from Valhall, and did a great job making sense of a lot of real-world data. One nice innovation: using the seismic quality as a weighting factor to try to understand the role of uncertainty. See the team’s presentation.

4D-pressure.png

Clustering reveals patterns in 4D maps

Team: Tetyana Kholodna, Simon Stavland, Nithya Mohan, Saktipada Maity, Jone Kristoffersen Bakkevig (all CapGemini), Reidar Devold Midtun (ConocoPhillips).

Project: The team worked on real 4D data from an operating field. Reidar provided a lot of maps computed with multiple seismic attributes. Groups of maps represent different reservoir layers, and thirteen different time-lapse acquisitions. So… a lot of maps. The team attempted to correlate 4D effects across all of these dimensions — attributes, layers, and production time. Reidar, the only geoscientist on a team of data scientists, also provided one of the quotes of the hackathon: “I’m the geophysicist, and I represent the problem”.

4D-layers.png

That’s it for the FORCE Hackathon for 2018. I daresay there may be more in the coming months and years. If they can build on what we started last week, I think more remarkable things are on the way!


all_small.png

One more thing…

I mentioned the UK hackathons last time, but I went and forgot to include the links to the events. So here they are again, in case you couldn’t find them online…

What are you waiting for? Get signed up and tell your friends!

Machine learning goes mainstream

At our first machine-learning-themed hackathon, in New Orleans in 2015, we had fifteen hackers. TImes were hard in the industry. Few were willing or able to compe out and play. Well, it’s now clear that times have changed! After two epic ML hacks last year (in Paris and Houston), at which we hosted about 115 scientists, it’s clear this year is continuing the trend. Indeed, by the end of 2018 we expect to have welcomed at least 240 more digital scientists to hackathons in the US and Europe.

Conclusion: something remarkable is happening in our field.

The FORCE hackathon

Last Tuesday and Wednesday, Agile co-organized the FORCE Machine Learning Hackathon in Stavanger, Norway. FORCE is a cross-industry geoscience organization, coordinating meetings and research in subsurface. The event preceeded a 1-day symposium on the same theme: machine learning in geoscience. And it was spectacular.

Get a flavour of the spectacularness in Alessandro Amato’s beautiful photographs:

Fifty geoscientists and engineers spent two days at the Norwegian Petroleum Directorate (NPD) in Stavanger. Our hosts were welcoming, accommodating, and generous with the waffles. As usual, we gently nudged the participants into teams, and encouraged them to define projects and find data to work on. It always amazes me how smoothly this potentially daunting task goes; I think this says something about the purposefulness and resourcefulness of our community.

Here’s a quick run-down of the projects:

  • Biostrat! Geological ages from species counts.

  • Lost in 4D Space. Pressure drawdown prediction.

  • Virtual Metering. Predicting wellhead pressure in real time.

  • 300 Wells. Extracting shows and uncertainty from well reports.

  • AVO ML. Unsupervised machine learning for more geological AVO.

  • Core Images. Grain size and lithology from core photos.

  • 4D Layers. Classification engine for 4D seismic data.

  • Gully Attack. Strat trap picking with deep reinforcement learning.

  • sketch2seis. Turning geological cartoons into seismic with pix2pix.

I will do a complete review of the projects in the coming few days, but notice the diversity here. Five of the projects straddle geological topics, and five are geophysical. Two or three involve petroleum engineering issues, while two or three move into sed/strat. We saw natural language processing. We saw random forests. We saw GANs, VAEs, and deep reinforcement learning. In terms of input data, we saw core photos, PDF reports, synthetic seismograms, real-time production data, and hastily assembled label sets. In short — we saw everything.

Takk skal du ha

Many thanks to everyone that helped the event come together:

  • Peter Bormann, the mastermind behind the symposium, was instrumental in making the hackathon happen.

  • Grete Block Vargle (AkerBP) and Pernille Hammernes (Equinor) kept everyone organized and inspired.

  • Tone Helene Mydland (NPD) and Soelvi Amundrud (NPD) made sure everything was logistically honed.

  • Eva Halland (NPD) supported the event throughout and helped with the judging.

  • Alessandro Amato del Monte (Eni) took some fantastic photos — as seen in this post.

  • Diego Castaneda and Rob Leckenby helped me on the Agile side of things, and helped several teams.

And a huge thank you to the sponsors of the event — too many to name, but here they all are:

all_small.png

There’s more to come!

If you’re reading this thinking, “I’d love to go to a geoscience hackathon”, and you happen to live in or near the UK, you’re in luck! There are two machine learning geoscience hackathons coming up this fall:

Don’t miss out! Get signed up and we’ll see you there.

How good is what?

Geology is a descriptive science, which is to say, geologists are label-makers. We record observations by assigning labels to data. Labels can either be numbers or they can be words. As such, of the numerous tasks that machine learning is fit for attacking, supervised classification problems are perhaps the most accessible – the most intuitive – for geoscientists. Take data that already has labels. Build a model that learns the relationships between the data and labels. Use that model to make labels for new data. The concept is the same whether a geologist or an algorithm is doing it, and in both cases we want to test how well our classifier is at doing its label-making.

2d_2class_classifier_left.png

Say we have a classifier that will tell us whether a given combination of rock properties is either a dolomite (purple) or a sandstone (orange). Our classifier could be a person named Sally, who has seen a lot of rocks, or it could be a statistical model trained on a lot of rocks (e.g. this one on the right). For the sake of illustration, say we only have two tools to measure our rocks – that will make visualizing things easier. Maybe we have the gamma-ray tool that measures natural radioactivity, and the density tool that measures bulk density. Give these two measurements to our classifier, and they return to you a label. 

How good is my classifier?

Once you've trained your classifier – you've done the machine learning and all that – you've got yourself an automatic label maker. But that's not even the best part. The best part is that we get to analyze our system and get a handle on how good we can expect our predictions to be. We do this by seeing if the classifier returns the correct labels for samples that it has never seen before, using a dataset for which we know the labels. This dataset is called validation data.

Using the validation data, we can generate a suite of statistical scores to tell us unambiguously how this particular classifier is performing. In scikit-learn, this information compiled into a so-called classification report, and it’s available to you with a few simple lines of code. It’s a window into the behaviour of the classifier that warrants deeper inquiry.

To describe various elements in a classification report, it will be helpful to refer to some validation data:

Our Two-class Classifier (left) has not seen the Validation Data (middle). We can calculate a classification report by Analyzing the intersection of the two (right).

Our Two-class Classifier (left) has not seen the Validation Data (middle). We can calculate a classification report by Analyzing the intersection of the two (right).

Accuracy is not enough

When people straight up ask about a model’s accuracy, it could be that they aren't thinking deeply enough about the performance of the classifier. Accuracy is a measure of the entire classifier. It tells us nothing about how well we are doing with one class compared to another, but there are other metrics that tell us this:

metric_definitions2.png

Support — how many instances there were of that label in the validation set.

Precision — the fraction of correct predictions for a given label. Also known as positive predictive value.

Recall — the proportion of the class that we correctly predicted. Also known as sensitivity.

F1 score — the harmonic mean of precision and recall. It's a combined metric for each class.

Accuracy – the total fraction of correct predictions for all classes. You can calculate this for each class, but it will be the same value for each of the class.   

DIY classification report

If you're like me and you find the grammar of true positives and false negatives confusing, it might help to to treat each class within the classifier as its own mini diagnostic test, and build up data for the classification report row by row. Then it's as simple as counting hits and misses from the validation data and computing some fractions. Inspired by this diagram on the Wikipedia page for the F1 score, I've given both text and pictorial versions of the equations:

dolomite_and_classifier_report_sheet.png

Have a go at filling in the scores for the two classes above. After that, fill in your answers into your own hand-drawn version of the empty table below. Notice that there is only a single score for accuracy for the entire classifier, and that there may be a richer story between the various other scores in the table. Do you want to optimize accuracy overall? Or perhaps you care about maximizing recall in one class above all else? What matters most to you? Should you penalize some mistakes stronger than others?

clf_report.png

When data sets get larger – by either increasing the number of samples, or increasing the dimensionality of the data – even though this scoring-by-hand technique becomes impractical, the implementation stays the same. In classification problems that have more than two classes we can add in a confusion matrix to our reporting, which is something that deserves a whole other post. 

Upon finishing logging a slab of core, if you were to ask Sally the stratigrapher, "How accurate are your facies?", she may dismiss your inquiry outright, or maybe point to some samples she's not completely confident in. Or she might tell you that she was extra diligent in the transition zones, or point to regions where this is very sandy sand, or this is very hydrothermally altered. Sadly, we in geoscience – emphasis on the science – seldom take the extra steps to test and report our own performance. But we totally could.

The ANSWERS. Upside Down. To two Decimal places.

The ANSWERS. Upside Down. To two Decimal places.

Are there benefits to pseudoscience?

No, of course there aren't. 

Balance! The scourge of modern news. CC-BY by SkepticalScience.com

Balance! The scourge of modern news. CC-BY by SkepticalScience.com

Unless... unless you're a journalist, perhaps. Then a bit of pseudoscience can provide some much-needed balance — just to be fair! — to the monotonic barrage of boring old scientific consensus. Now you can write stories about flat-earthers, anti-vaxxers, homeopathy, or the benefits of climate change!*

So far, so good. It's fun to pillory the dimwits who think the moon landings were filmed in a studio in Utah, or that humans have had no impact on Earth's climate. The important thing is for the journalist to have a clear and unequivocal opinion about it. If an article doesn't make it clear that the deluded people at the flat-earth convention ("Hey, everyone thought Copernicus was mad!") have formed their opinions in spite of, not because of, the overwhelming evidence before them, then readers might think the journalist — and the publisher — agree with them.

In other words, if you report on hogwash, then you had better say that it's hogwash, or you end up looking like one of the washers of the hog.


Fake geoscience?

AAPG found this out recently, when the August issue of its Explorer magazine published an article by Ken Milam called Are there benefits to climate change? Ken was reporting on a talk by AAPG member Greg Wrightstone at URTeC in July. Greg wrote a book called Inconvenient Facts: The Science That Al Gore Doesn't Want You To Know. The gist: no need to be concerned about carbon dioxide because, "The U.S. Navy’s submarines often exceed 8,000 ppm (20 times current levels) and there is no danger to our sailors" — surely some of the least watertight reasoning I've ever encountered. Greg's basic idea is that, since the earth has been warmer before, with higher levels of CO2, there's nothing to worry about today (those Cretaceous conurbations and Silurian civilizations had no trouble adapting!) So he thinks, "the correct policy to address climate change is to have the courage to do nothing".

So far, so good. Except that Ken — in reporting 'just the facts' — didn't mention that Greg's talk was full of half-truths and inaccuracies and that few earth scientists agree with him. He forgot to remark upon the real news story: how worrying it is that URTeC 2018 put on a breakfast promoting Greg and his marginal views. He omitted to point out that this industry needs to grow up and face the future with reponsibility, supporting society with sound geoscience.

So it looked a bit like Explorer and AAPG were contributing to the washing of this particular hog.


Discussion

As you might expect, there was some discussion about the article — both on aapg.org and on Twitter (and probably elsewhere). For example, Mark Tingay (University of Adelaide) called AAPG and SPE out:

So did Brian Romans (Virginia Tech):

And there was further discussion (sort of) involving Greg Wrightstone himself. Trawl through Mark Tingay's timeline, especially his systematic dismantling of Greg's 'evidence', if your curiosity gets the better of you.


Response

Of course AAPG noticed the commotion. The September issue of Explorer contains two statements from AAPG staff. David Curtiss, AAPG Executive Director, said this in his column:

Milam was assigned to report on an invited presentation by Greg Wrightstone, a past president of AAPG’s Eastern Section, based on a recently self-published book on climate change, at the Unconventional Resources Technology Conference in July. Here was an AAPG Member and past section officer speaking about climate change – an issue of interest to many of our members, who had been invited by a group of his geoscience and engineering peers to present at a topical breakfast – not a technical session – at a major conference.

This sounds fine, on the face of it, but details matter. A glance at the book in question should have been enough to indicate that the content of the talk could only have been presented in a non-technical session, with a side of hash browns.

Anyway, David does go on to point out the tension between the petroleum industry's activities and society's environmental concerns. The tension is real, and AAPG and its members, are in the middle of it. We can contribute scientifically to the conversations that need to happen to resolve that tension. But pushing junk science and polemical bluster is definitely not going to help. I believe that most of the officers and members of AAPG agree. 

The editor of Explorer, Brian Ervin, had this to say:

For the record, none of our coverage of any issue or any given perspective on an issue should be taken as an endorsement — explicit or implicit — of that perspective. Also, the EXPLORER is — quite emphatically — not a scientific journal. Our content is not peer-reviewed. [...] No, the EXPLORER exists for an entirely different purpose. We provide news about Earth science, the industry and the Association, so our mission is different and unrelated to that of a scientific publication.

He goes on to say that he knew that Wrightstone's views are not popular and that it would provoke some reaction, but wanted to present it impartially and "give [readers] the opportunity to evaluate his position for themselves".

I just hope Explorer doesn't start doing this with too many other marginal opinions.


I'd have preferred to see AAPG back-pedal a bit more energetically. Publishing this article was a mistake. AAPG needs to think about the purpose, and influence, of its reporting, as well as its stance on climate change (which, according to David Curtiss, hasn't been discussed substantially in more than 10 years). This isn't about pushing agendas, any more than talking about the moon landings is about pushing agendas. It's about being a modern scientific association with high aspirations for itself, its members, and society.