What is spectral gamma-ray?

The spectral gamma-ray log is a measure of the natural radiation in rocks. The amplitude of the signal from the gamma-ray tool, which is just a sensor with no active source, is proportional to the energy of the gamma-ray photons it encounters. Being able to differentiate between photons of different energies turns out to be very handy Compared to the ordinary gamma-ray log, which ignores the energies and only counts the photons, it's like seeing in colour instead of black and white.

Why do we care about gamma radiation?

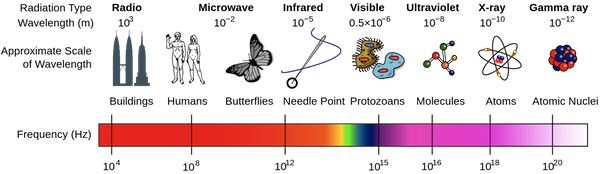
First, what are gamma rays? Highly energetic photons: electromagnetic radiation with very short wavelengths. 

Being able to see different energies, or 'colours', means we can differentiate between the radioactive decay of different elements. Elements decay by radiating energy, and the 'colour' of that energy is characteristic of that element (actually, of each isotope). So, we can tell by looking at the energy of a photon if we are seeing a potassium atom (40K) or a uranium atom (238U) decay. These are very different isotopes, with very different habits. We can do geology!

In fact, all sorts of radioisotopes occur naturally in the earth. By far the most abundant are potassium 40K, thorium 232Th and uranium 238U. Of these, potassium is the most abundant in sedimentary rocks, but thorium and uranium are present in small quantities, and have particular sedimentological implications.

What exactly are we measuring?

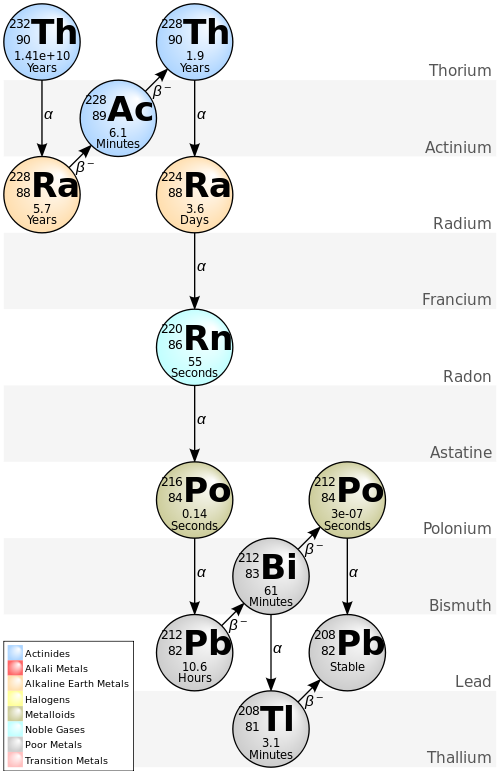
Potassium 40K decays to argon about 10% of the time, with γ-emission at 1.46 MeV (the other 90% of the time it decays to calcium). However, all of the decay in the 232Th and 238U decay series occurs by α- and β-particle decay, which don't always result in photon emission. The tool in fact measures γ-radiation from the decay of thallium 208Tl in the 232Th series (right), and from bismuth 214Bi in the 238U series. The spectral gamma-ray tool must be calibrated to known samples to give concentrations of 232Th and 238U from its readings. Proper calibration is vital, and is temperature-sensitive (of note in Canada!).

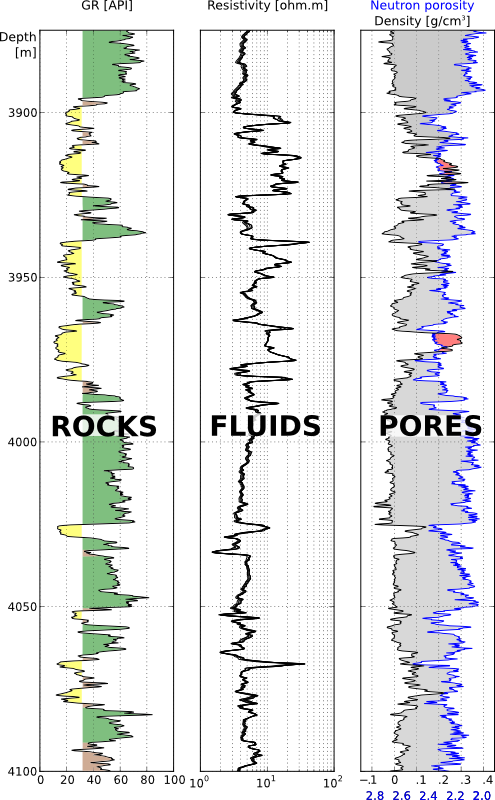
The concentrations of the three elements are estimated from the spectral measure­ments. The concentration of potassium is usually measured in percent (%) or per mil (‰), or sometimes in kilograms per tonne, which is equivalent to per mil. The other two elements are measured in parts per million (ppm).

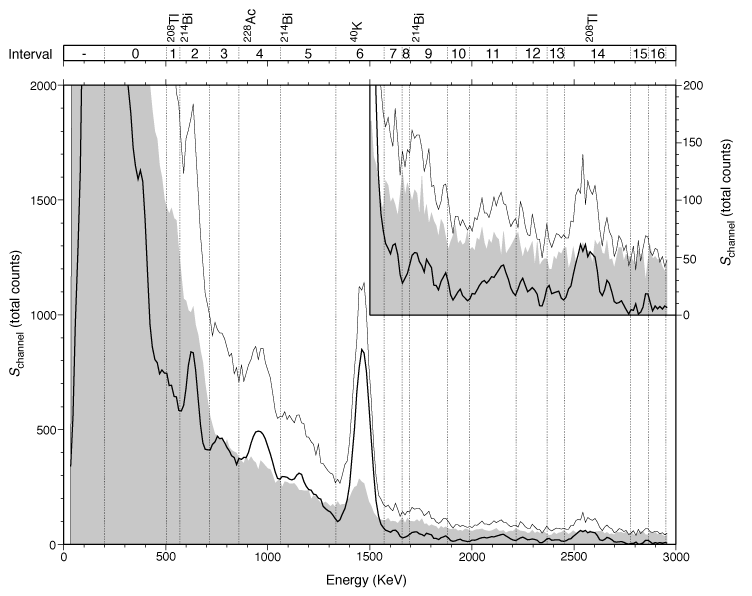
Here is the gamma-ray spectrum from a single sample from 509 m below the sea-floor at ODP Site 1201. The final spectrum (heavy black line) is shown after removing the background spectrum (gray region) and applying a three-point mean boxcar filter. The thin black line shows the raw spectrum. Vertical lines mark the interval boundaries defined by Peter Blum (an ODP scientist at Texas A&M). Prominent energy peaks relating to certain elements are identified at the top of the figure. The inset shows the spectrum for energies >1500 keV at an expanded scale. 

We wouldn't normally look at these spectra. Instead, the tool provides logs for K, Th, and U. Next time, I'll look at the logs.

Spectrum illustration by Wikipedia user Inductiveload, licensed GFDL; decay chain by Wikipedia user BatesIsBack, licensed CC-BY-SA.

Making images or making prospects?

Well-rounded geophysicists will have experience in each of the following three areas: acquisition, processing, and interpretation. Generally speaking, these three areas make up the seismic method, each requiring highly specified knowledge and tools. Historically, energy companies used to control the entire spectrum, owning the technology, the know-how and the risk, but that is no longer the case. Now, service companies do the acquisition and the processing. Interpretation is largely hosted within E & P companies, the ones who buy land and drill wells. Not only has it become unreasonable for a single geophysicist to be proficient across the board, but organizational structures constrain any particular technical viewpoint. 

Aligning with the industry's strategy, if you are a geophysicist, you likely fall into one of two camps: those who make images, or those who make prospects. One set of people to make the data, one set of people to do the interpretation.

This seems very un-scientific to me.

Where does science fit in?

Science, the standard approach of rational inquiry and accruing knowledge, is largely vacant from the applied geophysical business landscape. But, when science is used as a model, making images and making prospects are inseperable.

Can applied geophysics use scientific behaviour as a central anchor across disciplines?

There is a significant amount of science that is needed in the way that we produce observations, in the way that we make images. But the business landscape built on linear procedures leaves no wiggle room for additional testing and refinement. How do processors get better if they don't hear about their results? As a way of compensating, processing has deflected away from being a science of questioning, testing, and analysis, and moved more towards, well,... a process.

The sure-fire way to build knowledge and decrease uncertainty, is through experimentation and testing. In this sense this notion of selling 'solutions', is incompatible with scientific behavior. Science doesn't claim to give solutions, science doesn't claim to give answers, but it does promise to address uncertainty; to tell you what you know.

In studying the earth, we have to accept a lack of clarity in our data, but we must not accept mistakes, errors, or mediocrity due to shortcomings in our shared methodologies.

We need a new balance. We need more connectors across these organizational and disciplinary divides. That's where value will be made as industry encounters increasingly tougher problems. Will you be a connector? Will you be a subscriber to science?

Hall, M (2012). Do you know what you think you know? CSEG Recorder 37 (2), February 2012, p 26–30. Free to download from CSEG. 

Filters that distort vision

Almost two weeks ago, I had LASIK vision correction surgery. Although the recovery took longer than average, I am seeing better than I ever did before with glasses or contacts. Better than 20/20. Here's why.

Low order and high order refractive errors

Most people (like me) who have (had) poor vision fall short of pristine correction because lenses only correct low order refractive errors. Still, any correction gives a dramatic improvement to the naked eye; further refinements may be negligible or imperceptible. Higher order aberrations, caused by small scale structural irregularities of the cornea, can still affect one's refractive power by up to 20%, and they can only be corrected using customized surgical methods.

It occurs to me that researchers in optometry, astronomy, and seismology face a common challenge: how to accurately measure and subsequently correct for structural deformations in refractive media, and the abberrations in wavefronts caused by such higher-order irregularities. 

The filter is the physical model

Before surgery, a wavefront imaging camera was used to make detailed topographic maps of my corneas, and estimate point spread functions for each eye. The point spread function is a 2D convolution operator that fuzzies the otherwise clear. It shows how a ray is scattered and smeared across the retina. Above all, it is a filter that represents the physical eye.

Point spread function (similar to mine prior to LASIK) representing refractive errors of the cornea (top two rows), and corrected vision (bottom row). Point spread functions are filters that distort both the visual and seismic realms. The seismic example is a segment of inline 25, Blake Ridge 3D seismic survey, available from the Open Seismic Repository (OSR).Observations in optics and seismology alike are only models of the physical system, models that are constrained by the filters. We don't care about the filters per se, but they do get in the way of the underlying system. Luckily, the behaviour of any observation can be expressed as a combination of filters. In this way, knowing the nature of reality literally means quantifying the filters that cause distortion. Change the filter, change the view. Describe the filter, describe the system. 

The seismic experiment yields a filtered earth; a smeared reality. Seismic data processing is the analysis and subsequent removal of the filters that distort geological vision. 

This image was made using the custom filter manipulation tool in FIJI. The seismic data is available from OpendTect's Open Seismic Repository.

5 ways to kickstart an interpretation project

Last Friday, teams around the world started receiving external hard drives containing this year's datasets for the AAPG's Imperial Barrel Award (IBA for short). I competed in the IBA in 2008 when I was a graduate student at the University of Alberta. We were coached by the awesome Dr Murray Gingras (@MurrayGingras), we won the Canadian division, and we placed 4th in the global finals. I was the only geophysical specialist on the team alongside four geology graduate students.

Five things to do

Whether you are a staff geoscientist, a contractor, or competitor, it can help to do these things first:

  1. Make a data availability map (preferably in QGIS or ArcGIS). A graphic and geospatial representation of what you have been given.
  2. Make well scorecards: as a means to demonstrate not only that you have wells, but what information you have within the wells.
  3. Make tables, diagrams, maps of data quality and confidence. Indicate if you have doubts about data origins, data quality, interpretability, etc.
  4. Background search: The key word is search, not research. Use Mendeley to organize, tag, and search through the array of literature
  5. Use Time-Scale Creator to make your own stratigraphic column. You can manipulate the vector graphic, and make it your own. Much better than copying an old published figure. But use it for reference.

All of these things can be done before assigning roles, before saying who needs to do what. All of this needs to be done before the geoscience and the prospecting can happen. To skirt around it is missing the real work, and being complacent. Instead of being a hammer looking for a nail, lay out your materials, get a sense of what you can build. This will enable educated conversations about how you can spend your geoscientific manpower, division of labour, resources, time, etc.

Read more, then go apply it 

In addition to these tips for launching out of the blocks, I have also selected and categorized blog posts that I think might be most relevant and useful. We hope they are helpful to all geoscientists, but especially for students. Visit the Agile blog highlights list on SubSurfWiki.

I wish a happy and exciting IBA competition to all participants, and their supporting university departments. If you are competing, say hi in the comments and tell us where you hail from. 

Great geophysicists #7: Leonhard Euler

Leonhard Euler (pronounced 'oiler') was born on 15 April 1707 in Basel, Switzerland, but spent most of his life in Berlin and St Petersburg, where he died on 18 September 1783. Has was blind from the age of 50, but took this handicap stoically—when he lost sight in his right eye at 28 he said, "Now I will have less distraction".

It's hard to list Euler's contributions to the toolbox we call seismic geophysics—he worked on so many problems in maths and physics. For example, much of the notation we use today was invented or at least popularized by him: (x), e, i, π. He reconciled Newton's and Liebnitz's versions of calculus, making huge advances in solving difficult real-world equations. But he made some particularly relevant advances that resonate still:

  • Leonardo and Galileo both worked on mechanical stress distribution in beams, but didn't have the luxuries of calculus or Hooke's law. Daniel Bernoulli and Euler developed an isotropic elastic beam theory, and eventually convinced people you could actually build things using their insights. 
  • Euler's equations of fluid dynamics pre-date the more complicated (i.e. realistic) Navier–Stokes equations. Nonetheless, this work continued into vibrating strings, getting Euler (and Bernoulli) close to a general solution of the wave equation. They missed the mark, however, leaving it to Jean-Baptiste le Rond d'Alembert
  • optics (also wave behaviour). Though many of Euler's ideas about dispersion and lenses turned out to be incorrect (e.g. Pedersen 2008, DOI 10.1162/posc.2008.16.4.392), Euler did at least progress the idea that light is a wave, helping scientists move away from Newton's corpuscular theory.

The moment of Euler's death was described by the Marquis de Condorcet in a eulogy:

He had full possession of his faculties and apparently all of his strength... after having enjoyed some calculations on his blackboard concerning the laws of ascending motion for aerostatic machines... [he] spoke of Herschel's planet and the mathematics concerning its orbit and a little while later he had his grandson come and play with him and took a few cups of tea, when all of a sudden the pipe that he was smoking slipped from his hand and he ceased to calculate and live.

"He ceased to calculate," I love that.

Blurry vision and refractive power

I'm getting LASIK eye surgery today, so I've been preparing myself by learning about the eye's optics, and the surgical procedure that enhances handicapped eyes like my own. Unsurprisingly, there are some noteworthy parallels with seismic.

The eye as a gather

The human eye is akin to a common-depth point (CDP) gather. Both are like cameras constructed to focus rays at an imaging point. The retina, in the case of the eye; the reflection boundary in the case of the gather. In the eye, there are exactly four refracting interfaces at which light rays bend towards the midline and ultimately converge on the retina. In the earth, there an unknown number of interfaces, surely more than four.

Myopia, or near-sightedness, is the condition where images are focused just in front of the retina. Hyperopia, or far-sightedness, is the condition where the eyeball is too short and images would be focused behined the retina. The structure and density of the tissues in the eye have to be aligned just so, for perfect vision. If any combination of them are out of whack, you get blurry vision. Really blurry, in my case.

Characterizing blurry vision can be thought of as a two step process of measurement and validation. First, measurements of the refractive power of the eye are made with an autorefractor; quantifying the amount of first order correction needed. The correction is applied, verified, and fine-tuned by a qualitative visual assessment test. The measurement gets you close to the perfect correction; any residual adjustments may be negligible or imperceptible. And the patient, a subjective observer, is the final judge of clarity and quality of vision.

Four corrections

There are at least four ways to correct for common vision problems. Each is a different way to force the ray geometry:

  • refract the light before it enters the eye (glasses),
  • refract the light just above the cornea (contact lenses), 
  • change the shape of the cornea using LASIK or PRK surgery, or 
  • change the shape or structure of the lens (cataract surgery or implants). 

If the earth were an eye

Seismic processing is the act of measuring the refractive structure of the earth, and correcting for it's natural blurryness. Static correction, is done first in an effort to align the rays into a plane wave before it enters the 'eye'. Seismic velocity analysis is carried out on the rays, as a crude measurement of the earth's 'refractive power'. Migration, is the process of forcing geometries, mathematically instead of surgically, in order to rearrange ray paths to improve focusing. Generally speaking it's the same two-step process: measurement and validation. As with the eye, the quality of the final image is a perceptual one, coming down to subjective visual assessment. But unlike the eye, fortunately, multiple observers can share the same image, talk about it even. Changing the entire discussion about what acuity really means.

The process of vision correction goes sequentially from low order to high order. In the next post I will talk about higher order anomalies within the eye, that, once corrected, can cause super-human vision. Measurements and maps of how the eye sees show surgeons how to correct optical images. In the same vein, measurements and maps of how the seismic experiment sees, show geophysicists how to correct images in the seismic realm.

Rocks, pores and fluids

At an SEG seismic rock physics conference in China several years ago, I clearly remember a catch phrase used by one of the presenters, "It's all about rocks, pores, and fluids." He used it several times throughout his talk as an invocation for geophysicists to translate their seismic measurements of the earth into terms that are more appealing to others. Nobody cares about the VP/VS ratio in a reservoir. Even though I found the repetition slightly off-putting, he succeeded—the phrase stuck. It's all about rock, pores, and fluids.

Fast forward to the SEG IQ Earth Forum a few months ago. The message reared its head again, but in a different form. After dinner one evening, I was speaking with Ran Bachrach about advances in seismic rock physics technology: the glamour and the promise of the state-of-the-art. It was a topic right up his alley, but suprisingly, he seemed ambivalent and under-enthused. Which was unusual for him. "More often than not," he said, "we can get all the information we need from the triple combo." 

What is the triple combo? 

I felt embarrased that I had never heard of the term. Like I had been missing something this whole time. The triple combo is the standard set of measurements used in formation evaluation and wireline logging: gamma-ray, porosity, and resistivity. Simply put, the triple combo tells us about rocks, pores, and fluids. 

I find it curious that the very things we are interested in are impossible to measure directly. For example:

  • A gamma-ray log measures naturally occuring radioactive minerals. We use this to make inferences about lithology.
  • A neutron log measures Compton scattering in proportion to the number of hydrogen atoms. This is a proxy for pores.
  • A resistivity log measures the conductivity of electrical current. We use this to tell us about fluid type and saturation.

Subsurface geotechnology isn't only about recording the earth's constituents in isolation. Some measurements, the sonic log for instance, are useful because of the fact that they are an aggregate of all three.

The well log is a section of the Thebaud_E-74 well available from the offshore Nova Scotia Play Fairway Analysis.

Must-read geophysics blogs

Tuesday's must-read list was all about traditional publishing channels. Today, it's all about new media.

If you're anything like me before Agile, you don't read a lot of blogs. At least, not ones about geophysics. But they do exist! Get these in your browser favourites, or use a reader like Google Reader (anywhere) or Flipboard (on iPad).

Seismos

Chris Liner, a geophysics professor at the University of Arkansas, recently moved from the University of Houston. He's been writing Seismos, a parallel universe to his occasional Leading Edge column, since 2008.

MyCarta

Matteo Niccoli (@My_Carta on Twitter) is an exploration geoscientist in Stavanger, Norway, and he recently moved from Calgary, Canada. He's had MyCarta: Geophysics, visualization, image processing and planetary science, since 2011. This blog is a must-read for MATLAB hackers and image processing nuts. Matteo was one of our 52 Things authors.

GeoMika

Mika McKinnon (@mikamckinnon), a geophysicist in British Columbia, Canada, has been writing GeoMika: Fluid dynamics, diasters, geophysics, and fieldwork since 2008. She's also into education outreach and the maker-hacker scene.

The Way of the Geophysicist

Jesper Dramsch (@JesperDramsch), a geophysicist in Hamburg, Germany has written the wonderfully personal and philosophical The Way of The Geophysicist since 2011. His tales of internships at Fugro and Schlumberger provide great insights for students.

VatulBlog

Maitri Erwin (@maitri), an exploration geoscientist in Texas, USA. She has been blogging since 2001 (surely some kind of record), and both she and her unique VatulBlog: From Kuwait to Katrina and beyond defy categorization. Maitri was also one of our 52 Things authors. 

There are other blogs on topics around seismology and exploration geophysics — shout outs go to Hypocentre in the UK, the Laboratoire d'imagerie et acquisition des mesures géophysiques in Quebec, occasional seismicky posts from sedimentologists like @zzsylvester, and the panoply of bloggery at the AGU. Stick those in your reader!

Must-read geophysics

If you had to choose your three favourite, most revisited, best remembered papers in all of exploration geophysics, what would you choose? Are they short? Long? Full of math? Well illustrated? 

Keep it honest

Barnes, A (2007). Redundant and useless seismic attributes. Geophysics 72 (3). DOI:10.1190/1.2716717
Rarely do we see engaging papers, but they do crop up occasionally. I love Art Barnes's Redundant and useless seismic attributes paper. In this business, I sometimes feel like our opinions — at least our public ones — have been worn down by secrecy and marketing. So Barnes's directness is doubly refreshing:

There are too many duplicate attributes, too many attributes with obscure meaning, and too many unstable and unreliable attributes. This surfeit breeds confusion and makes it hard to apply seismic attributes effectively. You do not need them all.

And keep it honest

Blau, L (1936). Black magic in geophysical prospecting. Geophysics 1 (1). DOI:10.1190/1.1437076
I can't resist Ludwig Blau's wonderful Black magic geophysics, published 77 years ago this month in the very first issue of Geophysics. The language is a little dated, and the technology mostly sounds rather creaky, but the point, like Blau's wit, is as fresh as ever. You might not learn a lot of geophysics from this paper, but it's an enlightening history lesson, and a study in engaging writing the likes of which we rarely see in Geophysics today...

And also keep it honest

Bond, C, A Gibbs, Z Shipton, and S Jones (2007), What do you think this is? "Conceptual uncertainty" in geoscience interpretation. GSA Today 17 (11), DOI: 10.1130/GSAT01711A.1
I like to remind myself that interpreters are subjective and biased. I think we have to recognize this to get better at it. There was a wonderful reaction on Twitter yesterday to a recent photo from Mars Curiosity (right) — a volcanologist thought it looked like a basalt, while a generalist thought it more like a sandstone. This terrific paper by Clare Bond and others will help you remember your biases!

My full list is right here. I hope you think there's something missing... please edit the wiki, or put your personal favourites in the comments. 

The attribute figure is adapted from from Barnes (2007) is copyright of SEG. It may only be used in accordance with their Permissions guidelines. The Mars Curiosity figure is public domain. 

Ten ways to spot pseudogeophysics

Geophysicists often try to predict rock properties using seismic attributes — an inverse problem. It is difficult and can be complicated. It can seem like black magic, or at least a black box. They can pull the wool over their own eyes in the process, so don’t be surprised if it seems like they are trying to pull the wool over yours. Instead, ask a lot of questions.

Questions to ask

  1. What is the reliability of the logs that are inputs to the prediction? Ask about hole quality and log editing.
  2. What about the the seismic data? Ask about signal:noise, multiples, bandwidth, resolution limits, polarity, maximum offset angle (for AVO studies), and processing flow (e.g. Emsley, 2012).
  3. What is the quality of the well ties? Is the correlation good enough for the proposed application?
  4. Is there any physical reason why the seismic attribute should predict the proposed rock property? Was this explained to you? Were you convinced?
  5. Is the proposed attribute redundant (sensu Barnes, 2007)? Does it really give better results than a less sexy approach? I’ve seen 5-minute trace integration outperform month-long AVO inversions (Hall et al. 2006).
  6. What are the caveats and uncertainties in the analysis? Is there a quantitative, preferably Bayesian, treatment of the reliability of the predictions being made? Ask about the probability of a prediction being wrong.
  7. Is there a convincing relationship between the rock property (shear impedance, say) and some geologically interesting characteristic that you actually make decisions with, e.g. frackability.
  8. Is there a convincing relationship between the rock property and the seismic attribute at the wells? In other words, does the attribute actually correlate with the property where we have data?
  9. What does the low-frequency model look like? How was it made? Its maximum frequency should be about the same as the seismic data's minimum, no more.
  10. Does the geophysicist compute errors from the training error or the validation error? Training errors are not helpful because they beg the question by comparing the input training data to the result you get when you use those very data in the model. Funnily enough, most geophysicists like to show the training error (right), but if the model is over-fit then of course it will predict very nicely at the well! But it's the reliability away from the wells we are interested in, so we should examine the error we get when we pretend the well isn't there. I prefer this to witholding 'blind' wells from the modeling — you should use all the data. 

Lastly, it might seem harsh but we could also ask if the geophysicist has a direct financial interest in convincing you that their attribute is sound, as well as the normal direct professional interest. It’s not a problem if they do, but be on your guard — people who are selling things are especially prone to bias. It's unavoidable.

What do you think? Are you bamboozled by the way geophysicists describe their predictions?

References
Barnes, A (2007). Redundant and useless seismic attributes. Geophysics 72 (3), p P33–P38. DOI: 10.1190/1.2370420.
Emsley, D. Know your processing flow. In: Hall & Bianco, eds, 52 Things You Should Know About Geophysics. Agile Libre, 2012. 
Hall, M, B Roy, and P Anno (2006). Assessing the success of pre-stack inversion in a heavy oil reservoir: Lower Cretaceous McMurray Formation at Surmont. Canadian Society of Exploration Geophysicists National Convention, Calgary, Canada, May 2006. 

The image of the training error plot — showing predicted logs in red against input logs — is from Hampson–Russell's excellent EMERGE software. I'm claiming the use of the copyrighted image is fair use.