Visual explanations of mathematics

It is thought that Euclid wrote Elements in about 300 BC, but Oliver Byrne turned it into one of the true gems of visualization — and made it about 100 times more readable. By seamlessly combining typeset text (Caslon, if you’re interested) with minimalist geometric drawings in primary colours, he didn’t just reproduce the text; he explained it in a new way.

annotated_byrne_euclid.png

If you like the look of it, it’s even cooler in Nicholas Rougeur’s beautiful interactive version.

This is a classic example of what Edward Tufte, the modern saint of visualization, calls a visual explanation (he wrote a whole book about the subject). We’ve written about the subject before (for example, see Evan’s 2014 post, Graphics that repay careful study). Figures and charts should do more than merely illustrate, they should elucidate.

Too often, equations — for example the myriad equations in any volume of GEOPHYSICS — do not elucidate. Indeed, they barely even illustrate. In some cases, it’s worse: they obfuscate. You might think mathematics is too dry, or too steeped in convention, for it to be any other way. Equations just are. But Byrne showed us that we can do better.

A few years ago, in an attempt to broaden my geophysical knowledge, I bought a copy of Daniel Fleisch’s book on Maxwell’s equations. It’s excellent, and the others in the series are good too. I especially liked the annotated equations; I’ve lightened the annotations in this version, to put them on a separate visual ‘layer’:

annotated_maxwell_by_fleisch.jpeg

In 2010, Randall Munroe of xkcd applied a similar strategy to label The Flake Equation, his parody of the Drake equation:

annotated_flake_equation.png

There are still other examples out there.

Later, I came across some lovely colourized equations by Stuart Riffle, a game developer. There was a bit of buzz about them on social media. Most people loved them, but a few pointed out that they suffer from the ‘legend lookup’ problem, and the colours he chose might not be great for colourblind people. Still, I like the concept — here’s the Fourier transform:

annotated_Fourier_Transform.png

Direct annotation, something Tufte always advocates, avoids the legend lookup problem. In his 2016 Geophysics Tutorial on finite volume methods, Rowan Cockett showed that colour and labels can work together:

annotated_equation_by_rowan_cockett.jpeg

And in his Observable post on the predator–prey interaction, modern visualization legend Mike Bostock avoids the problem entirely with the use of pictograms: direct representation of what the symbols represent:

annotated_predator_prey.png

Observable is interesting because the documents are runnable code. And this reminds us that mathematics — equations, data structures, and so on — has another expression: code. While symbolic representation speaks directly to some people, code speaks to others, probably more. Look at Randall Munroe’s annotation of a Wolfram Alpha equation (similar to an Excel formula) from his (wonderful) book, What If:

annotated_golf_xkcd.png

What I love about this is the direct path to exploring the function yourself. It would take me an hour to implement Fleisch’s electric field integral in code, even with the annotations. Typing in this — admittedly less useful — rocket golf equation will take me two minutes. Expressing mathematics in code is the ultimate explicit and practical expression of an idea.

We have lots of tools to write better mathematics: LaTeX, markdown, Jupyter Notebooks, and so on. But it feels like nothing has really converged yet. Technology that seamlessly mixes symbolic equations, illustrative-and-explicative annotation, and runnable code is, I am sure, not far off. Until then, we do the best we can with the tools we have.


Have you seen nice examples of annotated equations? I’d love to hear about them; let me know in the comments!


Don’t miss the follow-up post from 2021: Illuminated equations.


The work by Byrne is out of copyright. Those by Munroe and Cockett are openly licensed under Creative Commons. The work of Fleisch and Bostock are used in accordance with Fair Use doctrine.

The right writing tools

Scientists write, it's part of the job. If writing feels laborious, it might be because you haven't found the right tools yet. 

The wrong tools <cough>Word</cough> feel like a lot of work. You spend a lot of time fiddling with font sizes and not being sure whether to use italic or bold. You're constantly renumbering sections after edits. Everything moves around when you resize a figure. Tables are a headache. Table of contents? LOL.

If this sounds familiar, check out the following tools — arranged more or less in order of complexity.

Markdown

If you've never experienced writing with a markup language, you're in for a treat. At first it might feel clunky, but it quickly gets out of the way, leaving you to focus on the writing. Markdown was invented by John Gruber in about 2004; it is now almost ubiquitous in tools for developers. It's very lightweight, but compatible with HTML and LaTeX math, so it has plenty of features. Styling is absent from the document itself, being applied enitrely in post-production, as it were. With help from pandoc, you can compile Markdown documents to almost any format (e.g. PDF or Word). As a result, Markdown is sufficient for at least 70% of my writing projects. Here's a sampling of Markdown markup, rendered on the right with no styling:

Markdown_raw.png
Markdown_render.png

Jupyter Notebook

If you've been following along with our X Lines of Python series, or any of our other code-centric content, you'll have come across Jupyter Notebooks. These documents combine Markdown with code (in more or less any language you can think of) and the outputs of code — data, charts, images, etc. More than containing code, a so-called kernel can also run the code: Notebooks are fully computable documents. Not only could you write a paper or book in a Notebook, many people use them to give presentations with fully interactive, live code blocks and widgets.

Notebook_example.png
latex_folder___by_missyobo-d3azzbh.png

LaTeX

I discovered LaTeX in about 1993 and it was love at first sight. I've always been a bit of a typography nerd, and LaTeX — like TeX, around which LaTeX is wrapped — really cares about typography. So you get ligatures, hyphenation, sentence spacing, and kerning for free. It also cares about mathematics, cross-references, bibliographies, page numbering, tables of contents, and everything else you need for publication-ready documents.

You can install LaTeX locally, but there are several ways to use LaTeX online, without installing anything — and you get the best of both worlds: markup with WYSIWYG editing. OverleafShareLaTex (which is merging with Overleaf), Authorea, and Papeeria are all worth a look, especially if you write scientific papers.

When WYSISYG works

Sometimes you just want a couple of headings and some text, or you need to share a document with others. I often go for WYSISYG in those situations too — Google Docs is the best WYSIWYG editor I've used. When it supports Markdown too, which is surely only a matter of time, it will be perfect.

What about you, do you have a favourite writing tool? Share it in the comments.

The abstract lead-time problem

On Tuesday I wrote about the generally low quality of abstracts submitted to conferences. In particular, their vagueness and consequent uninterestingness. Three academics pointed out to me that there's an obvious reason.

Brian Romans (Virginia Tech) —

One issue, among many, with conference abstracts is the lead time between abstract submission and presentation (if accepted). AAPG is particularly bad at this and it is, frankly, ridiculous. The conference is >6 months from now! A couple years ago, when it was in Calgary in June, abstracts were due ~9 months prior. This is absurd. It can lead to what you are calling vague abstracts because researchers are attempting to anticipate some of what they will do. People want to present their latest and greatest, and not just recycle the same-old, which leads to some of this anticipatory language.

Chris Jackson (Imperial College London) and Zane Jobe (Colorado School of Mines) both responded on Twitter —

What's the problem?

As I explained last time, most abstracts aren't fun to read. And people seem to be saying that this overlong lead time is to blame. I think they're probably right. So much of my advice was useless: you can't be precise about non-existent science.

In this light, another problem occurs to me. Writing abstracts months in advance seems to me to potentially fuel confirmation bias, as we encourage people to set out their hypothetical stalls before they've done the work. (I know people tend to do this anyway, but let's not throw more flammable material at it.)

So now I'm worried that we don't just have boring abstracts, we may be doing bad science too.

Why is it this way?

I think the scholarly societies' official line might be, "Propose talks on completed work." But let's face it, that's not going to happen, and thank goodness because it would lead to even more boring conferences. Like PowerPoint-only presentations, committees powered by Robert's Rules, and terrible coffee, year-old research is no longer good enough.

What can we do about it?

If we can't trust abstracts, how can we select who gets to present at a conference? I can't think of a way that doesn't introduce all sorts of bias or other unfairness, or is horribly prone to gaming.

So maybe the problem isn't abstracts, it's talks.

Maybe we don't need to select anything. We just need to let the research community take over the process of telling people about their work, in whatever way they want.

In this alternate reality, the role of the technical society is not to maintain a bunch of clunky processes to 'manage' (but not manage) the community. Instead, their role is to create the conditions for members of the community to dynamically share and progress their work. Research don't need 6 months' lead time, or giant spreadsheets full of abstracts, or broken websites (yes, I'm looking at you, Scholar One). They need an awesome space, whiteboards, Wi-Fi, AV equipment, and good coffee.

In short, maybe this is one of the nudges we need to start talking seriously about unconferences.

Abstract horror

This isn't really a horror story, more of a Grimm fairy tale. Still, I thought it worthy of a Hallowe'eny title.

I've been reviewing abstracts for the 2018 AAPG annual convention. It's fun, because you get to read about new research months ahead of the rest of the world. But it's also not fun because... well, most abstracts aren't that great. I have no idea what proportion of abstracts the conference accepts, but I hope it's not too far above about 50%. (There was some speculation at SEG that there are so many talks now — 18 parallel sessions! — because giving a talk is the only way for many people to get permission to travel to it. I hope this isn't true.)

Some of the abstracts were great; at least 1 in 4 was better than 'good'. So  what's wrong with the others? Here are the three main issues I saw: 

  1. Lots of abstracts were uninteresting.
  2. Even more of them were vague.
  3. Almost all of them were about unreproducible research.

Let's look at each of these in turn and ask what we can do about it.

Uninteresting

Let's face it, not all research is interesting research. That's OK — it might still be useful or otherwise important. I think you can still write an interesting abstract about it. Here are some tips:

  • Don't be vague! Details are interesting. See the next section.
  • Break things up a bit. Use at least 2 paragraphs, maybe 3 or 4. Maybe a list or two. 
  • Use natural, everyday language. Try reading your abstract aloud. 
  • In the first sentence, tell me why I should come to your talk or visit your poster. 

Vague

I scribbled 'Vague' on nearly every abstract. In almost every case, either the method or the results, and usually both, were described in woolly language. For example (this is not a direct quote, but paraphrased):

Machine learning was used to predict the reservoir quality in most of the wells in the area, using millions of training examples and getting good results. The inputs were wireline log data from nearby wells.

This is useless information — which algorithm? How did you optimize it? How much training data did you have, and how many data instances did you validate against? How many features did you use? What kind of validation did you do, and what scores did you achieve? Which competing methods did you compare with? Use numbers, be specific:

We used a 9-dimensional support vector machine, implemented in scikit-learn, to model the permeability. With over 3 million training examples from logs in 150 nearby wells in the training set, and 1 million in cross-validation, we achieved an F1 score of 0.75 or more in 18 of the 20 wells.

A roughly 50% increase in the number of words, but an ∞% increase in the information content.

Unreproducible

Maybe I'm being unfair on this one, because I can't really tell if something is going to be reproducible or not from an abstract... or can I?

I'd venture to say that, if the formations are called A, B, C, and D, and the wells are called 1, 2, 3, and 4, then I'm pretty sure I'm not going to find out much about your research. (I had a long debate with someone in Houston recently about whether this sort of thing even qualifies as science.)

So what can you do to make a more useful abstract? 

  • Name your methods and algorithms. Where did they come from? Which other work did you build on?
  • Name the dataset and tell me where it came from. Don't obfuscate the details — they're what make you interesting! Share as much of the data as you can.
  • Name the software you're using. If it's open source, it's the least you can do. If it's not open source, it's not reproducible, but I'd still like to know how you're doing what you do.

I realize not everyone is in a position to do 100% reproducible research, but you can aim for something over 50%. If your work really is top secret (<50% reproducible), then you might think twice about sharing your work at conferences, since no-one can really learn anything from you. Ask yourself if your paper is really just an advertisement.

So what does a good abstract look like?

Well, I do like this one-word abstract from Gardner & Knopoff (1974), from the Bulletin of the Seismological Society of America:

Is the sequence of earthquakes in Southern California, with aftershocks removed, Poissonian?

Yes.

A classic, but I'm not sure it would get your paper accepted at a conference. I don't collect awesome abstracts — maybe I should — but here are some papers with great abstracts that caught my interest recently:

  • Dean, T (2017). The seismic signature of rain. Geophysics 82 (5). The title is great too; what curious person could resist this paper? 
  • Durkin, P et al. (2017) on their beautiful McMurry Fm interpretation in JSR 27 (10). It could arguably be improved by a snappier first sentence that gives punchline of the paper.
  • Doughty-Jones, G, et al (2017) in AAPG Bulletin 101 (11). There's maybe a bit of an assumption that the reader cares about intraslope minibasins, but the abstract has meat.

Becoming a better abstracter

The number one thing to improve as a writer is probably asking other people — friendly but critical ones — for honest feedback. So start there.

As I mentioned in my post More on brevity way back in March 2011, you should probably read Landes (1966) once every couple of years:

Landes, K (1966). A scrutiny of the abstract II. AAPG Bulletin 50 (9). Available online. (An update to his original 1951 piece, A scrutiny of the abstract, AAPG Bulletin 35, no 7.)

There's also this plea from geophysicist Paul Lowman, to stop turning abstracts into introductions:

Lowman, Paul (1988). The abstract rescrutinized. Geology 16 (12). Available online.

Give those a read — they are very short — and maybe pay extra attention to the next dozen or so abstracts you read. Do they tell you what you need to know? Are they either useful or interesting? Do they paint a vivid picture? Or are they too... abstract?

EarthArXiv wants your preprints

eartharxiv.png

If you're into science, and especially physics, you've heard of arXiv, which has revolutionized how research in physics is shared. BioarXiv, SocArXiv and PaleorXiv followed, among others*.

Well get excited, because today, at last, there is an open preprint server especially for earth science — EarthArXiv has landed! 

I could write a long essay about how great this news is, but the best way to get the full story is to listen to two of the founders — Chris Jackson (Imperial College London and fellow University of Manchester alum) and Tom Narock (University of Maryland, Baltimore) — on Undersampled Radio this morning:

Congratulations to Chris and Tom, and everyone involved in EarthArXiv!

  • Friedrich Hawemann, ETH Zurich, Switzerland
  • Daniel Ibarra, Earth System Science, Standford University, USA
  • Sabine Lengger, University of Plymouth, UK
  • Andelo Pio Rossi, Jacobs University Bremen, Germany
  • Divyesh Varade, Indian Institute of Technology Kanpur, India
  • Chris Waigl, University of Alaska Fairbanks, USA
  • Sara Bosshart, International Water Association, UK
  • Alodie Bubeck, University of Leicester, UK
  • Allison Enright, Rutgers - Newark, USA
  • Jamie Farquharson, Université de Strasbourg, France
  • Alfonso Fernandez, Universidad de Concepcion, Chile
  • Stéphane Girardclos, University of Geneva, Switzerland
  • Surabhi Gupta, UGC, India

Don't underestimate how important this is for earth science. Indeed, there's another new preprint server coming to the earth sciences in 2018, as the AGU — with Wiley! — prepare to launch ESSOAr. Not as a competitor for EarthArXiv (I hope), but as another piece in the rich open-access ecosystem of reproducible geoscience that's developing. (By the way, AAPG, SEG, SPE: you need to support these initiatives. They want to make your content more relevant and accessible!)

It's very, very exciting to see this new piece of infrastructure for open access publishing. I urge you to join in! You can submit all your published work to EarthArXiv — as long as the journal's policy allows it — so you should make sure your research gets into the hands of the people who need it.

I hope every conference from now on has an EarthArXiv Your Papers party. 


* Including snarXiv, don't miss that one!

Isn't everything on the internet free?

A couple of weeks ago I wrote about a new publication from Elsevier. The book seems to contain quite a bit of unlicensed copyrighted material, collected without proper permission from public and private groups on LinkedIn, SPE papers, and various websites. I had hoped to have an update for you today, but the company is still "looking into" the matter.

The comments on that post, and on Twitter, raised some interesting views. Like most views, these views usually come in pairs. There is a segment of the community that feels quite enraged by the use of (fully attributed) LinkedIn comments in a book; but many people hold the opposing view, that everything on the Internet is fair game.

I sympathise with this permissive view, to an extent. If you put stuff on the web, people are (one hopes) going to see it, interpret it, and perhaps want to re-use it. If they do re-use it, they may do so in ways you did not expect, or perhaps even disagree with. This is okay — this is how ideas develop. 

I mean, if I can't use a properly attributed LinkedIn post as the basis for a discussion, or a YouTube video to illustrate a point, then what's really the point of those platforms? It would undermine the idea of the web as a place for interaction and collaboration, for cultural or scientific evolution. 

Freely accessible but not free

Not to labour the point, but I think we all understand that what we put on the Internet is 'out there'. Indeed, some security researchers suggest you should assume that every email you type will be in the local newspaper tomorrow morning. This isn't just 'a feeling', it's built into how the web works. most websites are exclusively composed of strictly copyrighted content, but most websites also have conspicuous buttons to share that copyrighted content — Tweet this, Pin that, or whatever. The signals are confusing... do you want me to share this or not? 

One can definitely get carried away with the idea that everything should be free. There's a spectrum of infractions. On the 'everyday abuse' end of things, we have the point of view that grabbing randoms images from the web and putting the URL at the bottom is 'good enough'. Based on papers at conferences, I suspect that most people think this and, as I explained before, it's definitely not true: you usually need permission. 

At the other end of the scale, you end up with Sci-Hub (which sounds like it's under pressure to close at the moment) and various book-sharing sites, both of which I think are retrograde and anti-open-access (as well as illegal). I believe we should respect the copyright of others — even that of supposedly evil academic publishers — if we want others to respect ours.

So what's the problem with a bookful of LinkedIn posts and other dubious content? Leaving aside for now the possibility of more serious plagiarism, I think the main problem is simply that the author went too far — it is a wholesale rip-off of 350 people's work, not especially well done, with no added value, and sold for a hefty sum.

Best practice for re-using stuff on the web

So how do we know what is too far? Is it just a value judgment? How do you re-use stuff on the web properly? My advice:

  • Stop it. Resist the temptation to Google around, grabbing whatever catches your eye.
  • Re-use sparingly, only using one or two of the real gems. Do you really need that picture of a casino on your slide entitled "Risk and reward"? (No, you definitely don't.)
  • Make your own. Ideas are not copyrightable, so it might be easier to copy the idea and make the thing you want yourself (giving credit where it's due, of course).
  • Ask for permission from the creator if you do use someone's stuff. Like I said before, this is only fair and right.
  • Go open! Preferentially share things by people who seem to be into sharing their stuff.
  • Respect the work. Make other people's stuff look awesome. You might even...
  • ...improve the work if you can — redraw a diagram, fix a typo — then share it back to them and the community.
  • Add value. Add real insight, combine things in new ways, surprise and delight the original creators.
  • And finally, if you're not doing any of these things, you better not be trying to profit from it. 

Everything on the Internet is not free. My bet is that you'll be glad of this fact when you start putting your own stuff out there. We can all do our homework and model good practice. This is especially important for those people in influential positions in academia, because their behaviours rub off on so many impressionable people. 


We talked to Fernando Enrique Ziegler on the Undersampled Radio podcast last week. He was embroiled in the 'bad book' furore too, in fact he brought it to many people's attention. So this topic came up in the show, as well as a lot of stuff about pore pressure and hurricanes. Check it out...

Attribution is not permission

Onajite_cover.png

This morning a friend of mine, Fernando Enrique Ziegler, a pore pressure researcher and practitioner in Houston, let me know about an "interesting" new book from Elsevier: Practical Solutions to Integrated Oil and Gas Reservoir Analysis, by Enwenode Onajite, a geophysicist in Nigeria... And about 350 other people.

What's interesting about the book is that the majority of the content was not written by Onajite, but was copy-and-pasted from discussions on LinkedIn. A novel way to produce a book, certainly, but is it... legal?

Who owns the content?

Before you read on, you might want to take a quick look at the way the book presents the LinkedIn material. Check it out, then come back here. By the way, if LinkedIn wasn't so damn difficult to search, or if the book included a link or some kind of proper citation of the discussion, I'd show you a conversation in LinkedIn too. But everything is completely untraceable, so I'll leave it as an exercise to the reader.

LinkedIn's User Agreement is crystal clear about the ownership of content its users post there:

[...] you own the content and information that you submit or post to the Services and you are only granting LinkedIn and our affiliates the following non-exclusive license: A worldwide, transferable and sublicensable right to use, copy, modify, distribute, publish, and process, information and content that you provide through our Services [...]

This is a good user agreement [Edit: see UPDATE, below]. It means everything you write on LinkedIn is © You — unless you choose to license it to others, e.g. under the terms of Creative Commons (please do!).

Fernando — whose material was used in the book — tells me that none of the several other authors he has asked gave, or were even asked for, permission to re-use their work. So I think we can say that this book represents a comprehensive infringement of copyright of the respective authors of the discussions on LinkedIn.

Roles and reponsibilities

Given the scale of this infringement, I think there's a clear lack of due diligence here on the part of the publisher and the editors. Having said that, while publishers are quick to establish their copyright on the material they publish, I would say that this lack of diligence is fairly normal. Publishers tend to leave this sort of thing to the author, hence the standard "Every effort has been made..." disclaimer you often find in non-fiction books... though not, apparently, in this book (perhaps because zero effort has been made!).

But this defence doesn't wash: Elsevier is the copyright holder here (Onajite signed it over to them, as most authors do), so I think the buck stops with them. Indeed, you can be sure that the company will make most of the money from the sale of this book — the author will be lucky to get 5% of gross sales, so the buck is both figurative and literal.

Incidentally, in Agile's publishing house, Agile Libre, authors retain copyright, but we take on the responsibility (and cost!) of seeking permissions for re-use. We do this because I consider it to be our reputation at stake, as much as the author's.

OK, so we should blame Elsevier for this book. Could Elsevier argue that it's really no different from quoting from a published research paper, say? Few researchers ask publishers or authors if they can do this — especially in the classroom, "for educational purposes", as if it is somehow exempt from copyright rules (it isn't). It's just part of the culture — an extension of the uneducated (uninterested?) attitude towards copyright that prevails in academia and industry. Until someone infringes your copyright, at least.

Seek permission not forgiveness

I notice that in the Acknowledgments section of the book, Onajite does what many people do — he gives acknowledgement ("for their contributions", he doesn't say they were unwitting) to some the authors of the content. Asking for forgiveness, as it were (but not really). He lists the rest at the back. It's normal to see this sort of casual hat tip in presentations at conferences — someone shows an unlicensed image they got from Google Images, slaps "Courtesy of A Scientist" or a URL at the bottom, and calls it a day. It isn't good enough: attribution is not permission. The word "courtesy" implies that you had some.

Indeed, most of the figures in Onajite's book seem to have been procured from elsewhere, with "Courtesy ExxonMobil" or whatever passing as a pseudolicense. If I was a gambler, I would bet that the large majority were used without permission.

OK, you're thinking, where's this going? Is it just a rant? Here's the bottom line:

The only courteous, professional and, yes, legal way to re-use copyrighted material — which is "anything someone created", more or less — is to seek written permission. It's that simple.

A bit of a hassle? Indeed it is. Time-consuming? Yep. The good news is that you'll usually get a "Sure! Thanks for asking". I can count on one hand the number of times I've been refused.

The only exceptions to the rule are when:

  • The copyrighted material already carries a license for re-use (as Agile does — read the footer on this page).
  • The copyright owner explicitly allows re-use in their terms and conditions (for example, allowing the re-publication of single figures, as some journals do).
  • The law allows for some kind of fair use, e.g. for the purposes of criticism.

In these cases, you do not need to ask, just be sure to attribute everything diligently.

A new low in scientific publishing?

What now? I believe Elsevier should retract this potentially useful book and begin the long process of asking the 350 authors for permission to re-use the content. But I'm not holding my breath.

By a very rough count of the preview of this $130 volume in Google Books, it looks like the ratio of LinkedIn chat to original text is about 2:1. Whatever the copyright situation, the book is definitely an uninspiring turn for scientific publishing. I hope we don't see more like it, but let's face it: if a massive publishing conglomerate can make $87 from comments on LinkedIn, it's gonna happen.

What do you think about all this? Does it matter? Should Elsevier do something about it? Let us know in the comments.


UPDATE Friday 1 September

Since this is a rather delicate issue, and events are still unfolding, I thought I'd post some updates from Twitter and the comments on this post:

  • Elsevier is aware of these questions and is looking into it.
  • Re-read the user agreement quote carefully. As Ronald points out below, I was too hasty — it's really not a good user agreement, LinkedIn have a lot of scope to re-use what you post there. 
  • It turns out that some people were asked for permission, though it seems it was unclear what they were agreeing to. So the author knew that seeking permission was a good idea.
  • It also turns out that at least one SPE paper was reproduced in the book, in a rather inconspicuous way. I don't know if SPE granted rights for this, but the author at least was not identified.
  • Some people are throwing the word 'plagiarism' around, which is rather a serious word. I'm personally willing to ascribe it to 'normal industry practices' and sloppy editing and reviewing (the book was apparently reviewed by no fewer than 5 people!). And, at least in the case of the LinkedIn content, proper attribution was made. For me, this is more about honesty, quality, and value in scientific publishing than about misconduct per se.
  • It's worth reading the comments on this post. People are raising good points.

Part of the thumbnail image was created by Jannoon028 — Freepik.com — and licensed CC-BY.

Hooke's oolite

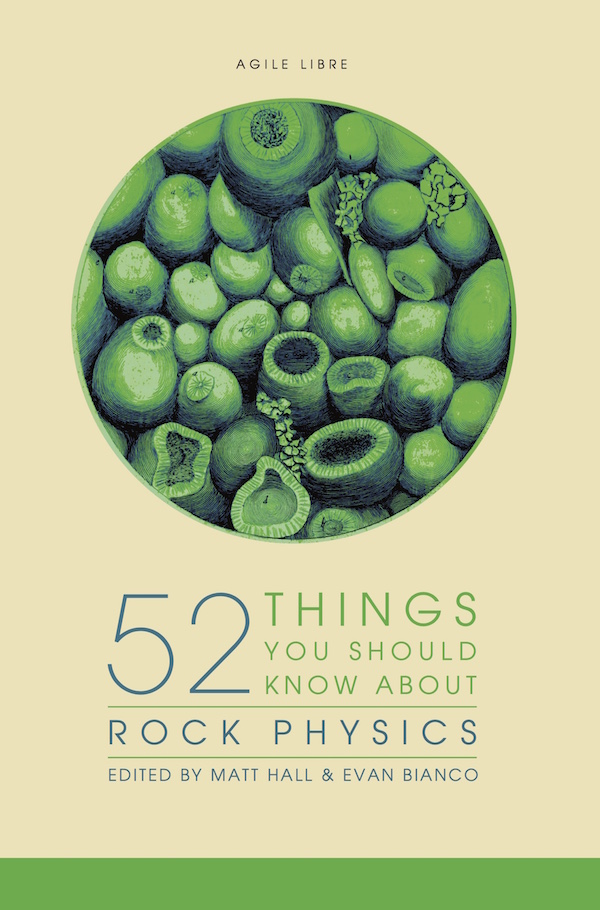
52 Things You Should Know About Rock Physics came out last week. For the first, and possibly the last, time a Fellow of the Royal Society — the most exclusive science club in the UK — drew the picture on the cover. The 353-year-old drawing was made by none other than Robert Hooke

The title page from Micrographia, and part of the dedication to Charles II. You can browse the entire book at archive.org.

The title page from Micrographia, and part of the dedication to Charles II. You can browse the entire book at archive.org.

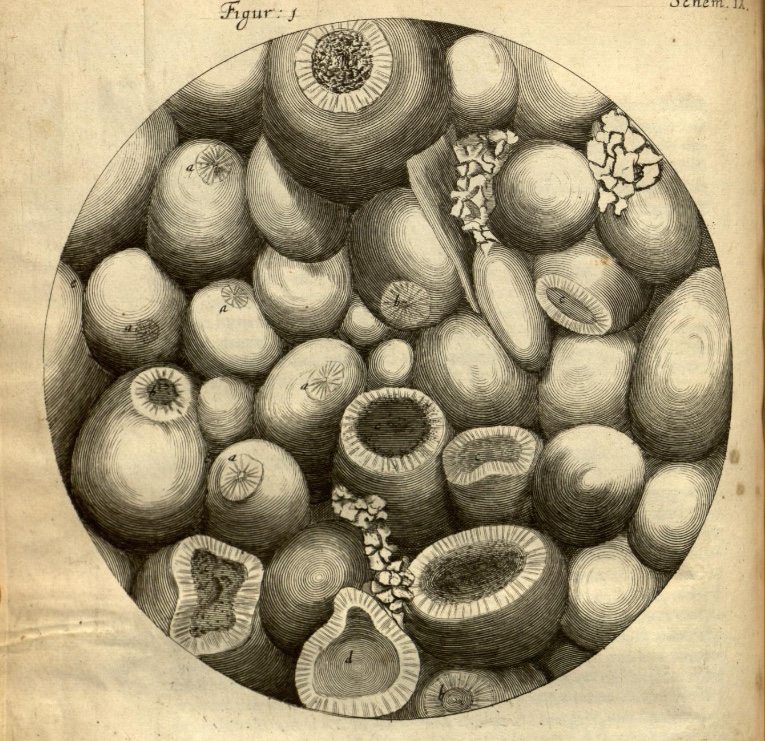
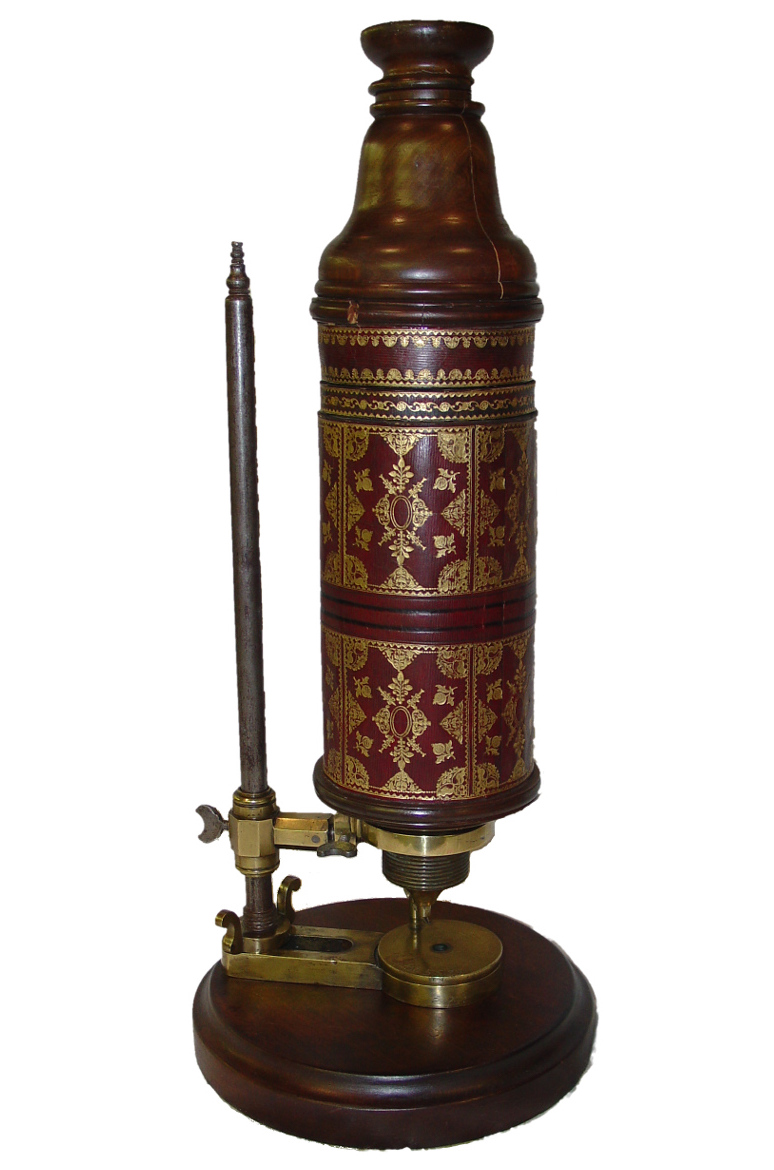
The drawing, or rather the engraving that was made from it, appears on page 92 of Micrographia, Hooke's groundbreaking 1665 work on microscopy. In between discovering and publishing his eponymous law of elasticity (which Evan wrote about in connection with Lamé's \(\lambda\)), he drew and wrote about his observations of a huge range of natural specimens under the microscope. It was the first time anyone had recorded such things, and it was years before its accuracy and detail were surpassed. The book established the science of microscopy, and also coined the word cell, in its biological context.

Sadly, the original drawing, along with every other drawing but one from the volume, was lost in the Great Fire of London, 350 years ago almost to the day. 

Ketton stone

The drawing on the cover of the new book is of the fractured surface of Ketton stone, a Middle Jurassic oolite from central England. Hooke's own description of the rock, which he mistakenly called Kettering Stone, is rather wonderful:

I wonder if anyone else has ever described oolite as looking like the ovary of a herring?

These thoughtful descriptions, revealing a profundly learned scientist, hint at why Hooke has been called 'England's Leonardo'. It seems likely that he came by the stone via his interest in architecture, and especially through his friendsip with Christopher Wren. By 1663, when it's likely Hooke made his observations, Wren had used the stone in the façades of several Cambridge colleges, including the chapels of Pembroke and Emmanuel, and the Wren Library at Trinity (shown here). Masons call porous, isotropic rock like Ketton stone 'freestone', because they can carve it freely to make ornate designs. Rock physics in action!

You can read more about Hooke's oolite, and the geological significance of his observations, in an excellent short paper by material scientist Derek Hull (1997). It includes these images of Ketton stone, for comparison with Hooke's drawing:

Reflected light photomicrograph (left) and backscatter scanning electron microscope image (right) of Ketton Stone. Adapted from figures 2 and 3 of Hull (1997). Images are © Royal Society and used in accordance with their terms.

Reflected light photomicrograph (left) and backscatter scanning electron microscope image (right) of Ketton Stone. Adapted from figures 2 and 3 of Hull (1997). Images are © Royal Society and used in accordance with their terms.

I love that this book, which is mostly about the elastic behaviour of rocks, bears an illustration by the man that first described elasticity. Better still, the illustration is of a fractured rock — making it the perfect preface. 


References

Hall, M & E Bianco (eds.) (2016). 52 Things You Should Know About Rock Physics. Nova Scotia: Agile Libre, 134 pp.

Hooke, R (1665). Micrographia: or some Physiological Descriptions of Minute Bodies made by Magnifying Glasses, pp. 93–100. The Royal Society, London, 1665.

Hull, D (1997). Robert Hooke: A fractographic study of Kettering-stone. Notes and Records of the Royal Society of London 51, p 45-55. DOI: 10.1098/rsnr.1997.0005.

52 Things... Rock Physics

There's a new book in the 52 Things family! 

52 Things You Should Know About Rock Physics is out today, and available for purchase at Amazon.com. It will appear in their European stores in the next day or two, and in Canada... well, soon. If you can't wait for that, you can buy the book immediately direct from the printer by following this link.

The book mines the same vein as the previous volumes. In some ways, it's a volume 2 of the original 52 Things... Geophysics book, just a little bit more quantitative. It features a few of the same authors — Sven Treitel, Brian Russell, Rachel Newrick, Per Avseth, and Rob Simm — but most of the 46 authors are new to the project. Here are some of the first-timers' essays:

  • Ludmilla Adam, Why echoes fade.
  • Arthur Cheng, How to catch a shear wave.
  • Peter Duncan, Mapping fractures.
  • Paul Johnson, The astonishing case of non-linear elasticity.
  • Chris Liner, Negative Q.
  • Chris Skelt, Five questions to ask the petrophysicist.

It's our best collection of essays yet. We're very proud of the authors and the collection they've created. It stretches from childhood stories to linear algebra, and from the microscope to seismic data. There's no technical book like it. 

Supporting Geoscientists Without Borders

Purchasing the book will not only bring you profund insights into rock physics — there's more! Every sale sends $2 to Geoscientists Without Borders, the SEG charity that supports the humanitarian application of geoscience in places that need it. Read more about their important work.

It's been an extra big effort to get this book out. The project was completely derailed in 2015, as we — like everyone else — struggled with some existential questions. But we jumped back into it earlier this year, and Kara (the managing editor, and my wife) worked her magic. She loves working with the authors on proofs and so on, but she doesn't want to see any more equations for a while.

If you choose to buy the book, I hope you enjoy it. If you enjoy it, I hope you share it. If you want to share it with a lot of people, get in touch — we can help. Like the other books, the content is open access — so you are free to share and re-use it as you wish. 

The 5%

We recently published our 500th post on this blog. I made the first post on 11 November 2010, a week after quitting my job in Calgary (yes, there was a time when people used to quit jobs). So, 500 posts in a little over 2000 days — about a post every 4 days. About 300,000 words (still only about half of War and Peace). And I probably shouldn't think about this, but let's call it at least 1000 hours (it's probably double that). 

To celebrate the milestone, however arbitrary, I thought I'd spend an evening rounding up some of our favourite and most popular posts. If nothing else, it might serve as place to start for any new readers.

Geoscience

Uncertainty (broadly speaking)

Tech and coding

Our culture

I did say this post was about the top 5%, so strictly I owe you one more post. If you'll indugle me, I'll hark right back to the start — this post on The integration gap from 5 January 2011 was one of my early favourites. It was one of those ideas I'd been carrying around for a while. Not profound or interesting enough for a talk or an article. Just a little idea. I doubt it's even original. I just thought it was interesting. It's exactly what blogs were made for.

It only remains to say Thank You for the support and attention over the years. We appreciate it hugely, and look forward to crafting the next 500 posts for lining the bottom of your digital cat litter box.