To free, or not to free?
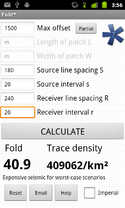
Yesterday, Evan and I published our fourth mobile app for geoscientists. It's called AVO*, it does reflectivity modeling, and it costs $2. 

Two bucks?? What's the point? Why isn't it free? Well, it went something like this...

- So, this new app: is it free?
- Well, all our apps are free. I guess it's free.
- Yeah, we don't want to stop it from spreading. If it wants to spread, that is...
- But does free look... worthless? I mean, 'you get what you pay for', right? Look at all the awesome stuff we pay for: Amazon web services, Squarespace web hosting, Hover domain hosting, awesome computers,...
- So what would we charge?
- What do other people charge? 
- There are no 'other people'... But there are technical apps for oil and gas out there. Most of them cost $1.99, some are $4.99, one or two are $9.99. Who knows how many downloads they get? 
- I bet the total revenue is constant: if you charge $1 and get 1000 downloads, then you'll get 100 at $10. But that's an experiment you can never do—once you've charged some amount, you can't really go up. Or down.
- How do other people decide what to charge?
- I guess traditionally you might use a cost-plus model: the cost of production, plus a profit margin.
- What's our cost of production?
- Well, a few days of time... let's call it $5000. If we wanted to make $10 000, and only expect 500 people to even be in the market... It doesn't work. No-one will pay $20 for a cell phone widget.
- Won't they just expense it?
- Maybe... I don't think the industry is quite there yet.
- Hmm... I downloaded an app for $20 once [a seismograph]. And another for $10 [a banjo tuner]. I don't even think about paying $1 or $2. That amount is basically free. $1 is free.
- But a buck... isn't it just a pain to even get your credit card out?
- Well, once you're set up in Google Checkout, or iTunes or whatever, it's essentially one click. And then we get a sense of the real user base. The hard core!
- Yeah... right now about 50% of people who install an app nuke it a few days later.
- At least if it's under $5 we probably won't have to deal with refunds and other nonsense.
- Arrgghhhh... why is this so hard? 
- Let's make it $2. 
- Let's make it free.
- But this app is awesome. Awesome shouldn't be free. Awesome is never free. Awesome costs. 
- But isn't this really just a thing that says "Agile is awesome, check us out, hire us"? It's marketing.
- Maybe... but it's useful too. It works. It does something. It has Science Inside™. People will get $1-worth out of it every time they use it. If this was a <insert energy software empire> app it would cost $10 000.
- Can we ask people to pay what they want? Like what Radiohead did with In Rainbows?
- No because they're already huge. They invoke mass hysteria in grown men. We don't invoke mass hysteria. Among anyboy.
- Damn. OK. Let's make it nearly free. As-good-as-free. Free-ish. Pseudo-free. Free*.
- $2?
- $2.

So the app costs a toonie, and we promise you won't regret it for a second. If you can't afford it, email us and we'll send you a free one. If you really hate it, email us and we'll send you $3.

What is AVO?

I used to be a geologist (but I'm OK now). When I first met seismic data, I took the reflections and geometries quite literally. The reflections come from geology, so it seems reasonable to interpret them as geology. But the reflections are waves, and waves are slippery things: they have to travel through kilometres of imperfectly known geology; they can interfere and diffract; they emanate spherically from the source and get much weaker quickly. This section from the Rockall Basin in the east Atlantic shows this attenuation nicely, as well as spectacular echo reflections from the ocean floor called multiples:

Rockall seismicData from the Virtual Seismic Atlas, contributed by the British Geological Survey.

Impedance is the product of density and velocity. Despite the complexity of seismic reflections, all is not lost. Even geologists interpreting seismic know that the strength of seismic reflections can have real, quantitative, geological meaning. For example, amplitude is related to changes in acoustic impedance Z, which is equal to the product of bulk density ρ and P-wave velocity V, itself related to lithology, fluid, and porosity.

Flawed cartoon of a marine seismic survey. OU, CC-BY-SA-NC.

But when the amplitude versus offset (AVO) behaviour of seismic reflections gets mentioned, most non-geophysicists switch off. If that's your reaction too, don't be put off by the jargon, it's really not that complicated.

The idea that we collect data from different angles is not complicated or scary. Remember the classic cartoon of a seismic survey (right). It's clear that some of the ray paths bounce off the geological strata at relatively small incidence angles, closer to straight down-and-up. Others, arriving at receivers further away from the source, have greater angles of incidence. The distance between the source and an individual receiver is called offset, and is deducible from the seismic field data because the exact location of the source and receivers is always known.

The basic physics behind AVO analysis is that the strength of a reflection does not only depend on the acoustic impedance—it also depends on the angle of incidence. Only when this angle is 0 (a vertical, or zero-offset, ray) does the simple relationship above hold.

Total internal reflection underwater. Source: Mbz1 via Wikimedia Commons.Though it may be unintuitive at first, angle-dependent reflectivity is an idea we all know well. Imagine an ordinary glass window: you can see through it perfectly well when you look straight through it, but when you move to a wide angle it suddenly becomes very reflective (at the so-called critical angle). The interface between water and air is similarly reflective at wide angles, as in this underwater view.

Karl Bernhard Zoeppritz (German, 1881–1908) was the first seismologist to describe the relationship between reflectivity and angle of incidence. In this context, describe means write down the equations for. Not two or three equations, lots of equations.

The Zoeppritz equations are very good model for how seismic waves propagate in the earth. There are some unnatural assumptions about isotropy, total isolation of the interface, and other things, but they work well in many real situations. The problem is that the equations are unwieldy, especially if you are starting from seismic data and trying to extract rock properties—trying to solve the so-called inverse problem. Since we want to be able to do useful things quickly, and since seismic data are inherently approximate anyway, several geophysicists have devised much friendlier models of reflectivity with offset.Google Nexus S

I'll take a look at these more friendly models next time, because I want to tell a bit about how we've implemented them in our soon-to-be-released mobile app, AVO*. No equations, I promise! Well, one or two...

News of the week

This week has been fairly quiet for geoscience and technology news, so we're hijacking our own post to highlight a couple of Agile* changes you might have missed. The first one is this very feature—our News of the week post. More or less every Friday we round up some geoscience news with an oil & gas or technology angle. If you spot something you think we should include, please scribble a quick note to hello at agilegeoscience dot com!

Another new feature on our site is subscription by email. Every blog post comes right to your email inbox, so you won't miss any Agile* goodness. Go to the SUBSCRIBE box on the right (under the tag cloud), enter your email address and hit Subscribe. It's that easy! No password to remember, 100% spam free, and you can unsubscribe any time. Powered by Google.

If you're a regular reader then you know all about our new mobile apps. At the moment, for completely practical reasons, they are only available for Android™ devices. We just upgraded our first app, Volume*, a prospect volumetrics tool—now you can save and recall prospects! In the next couple of days we will launch our first über-app, AVO*. Visit the wiki for a sneak peak.

The wiki? Yes, last month we launched AgileWiki, an experiment in sharing knowledge about the subsurface. We know that much of what we know and do as industrial, applied scientists is proprietary—that's what in-house corporate wikis and knowledge bases are for. But some of it at least is basic, foundational, and generic in nature. And that's what AgileWiki is for. Join in, share what you know!

Agile's YouTube channelYou might have noticed we've started dabbling a bit with video, and have a nascent YouTube channel. Today, the focus is on our mobile apps, but we are planning features on seismic interpretation workflows and other fun things. And we're open to feedback and suggestions on this effort, please let us know what you think!

Agile Geoscience brochure imageWe work hard to be interesting and relevant, not self-promoting and commercial. But occasionally people ask us what we actually do. So we made a one-pager setting out our stall. If you need some help doing something weird and wonderful, or just tricky and time-consuming, keep us in mind! We love helping people.

This ends the public service announcement. Back to our regular news feature next week!

Pair picking

Even the Lone Ranger didn't work alone all of the timeImagine that you are totally entrained in what you are doing: focused, dedicated, and productive. If you've lost track of time, you are probably feeling flow. It's an awesome experience when one person gets it, imagine the power when teams get it. Because there are so many interruptions that can cause turbulence, it can be especially difficult to establish coherent flow for the subsurface team. But if you learn how to harness and hold onto it, it's totally worth it.

Seismic interpreters can seek out flow by partnering up and practising pair picking. Having a partner in the passenger seat is not only ideal for training, but it is a superior way to get real work done. In other industries, this has become routine because it works. Software developers sometimes code in pairs, and airline pilots share control of an aircraft. When one person is in charge of the controls, the other is monitoring, reviewing, and navigating. One person for tactical jobs, one for strategic surveillance.

Here are some reasons to try pair picking:

Solve problems efficiently — If you routinely have an affiliate, you will have someone to talk to when you run into a challenging problem. Mundane or sticky workarounds become less tenuous when you have a partner. You'll adopt more sensible solutions to your fit-for-purpose hacks.

Integrate smoothly — There's a time for hand-over, and there will be times when you must call upon other people's previous work to get your job done. 'No! Don't use Top_Cretaceous_candidate_final... use Evan_K_temp_DO-NOT-USE.' Pairing with the predecessors and successors of your role will get you better-aligned.

Minimize interruptionitis — if you have to run to a meeting, or the phone rings, your partner can keep plugging away. When you return you will quickly rejoin. It is best to get into a visualization room, or some other distraction-free room with a large screen, so as to keep your attention and minimize the effect of interruptions.

Mutual accountability — build allies based on science, technology, and critical thinking, not gossip or politics. Your team will have no one to blame, and you'll feel more connected around the office. Is knowledge hoarded and privileged or is it open and shared? If you pick in pairs, there is always someone who can vouch for your actions.

Mentoring and training — by pair picking, newcomers quickly get to watch the flow of work, not just a schematic flow-chart. Instead of just an end-product, they see the clicks, the indecision, the iteration, and the pace at which tasks unfold.

Practicing pair picking is not just about sharing tasks, it is about channeling our natural social energies in the pursuit of excellence. It may not be practical all of the time, and it may make you feel vulnerable, but pairing up for seismic interpretation might bring more flow to your workflow.

If you give it a try, please let us know how it goes!

Geophysical stamps 2: Sonic

Recently I bought some stamps on eBay. This isn't something I've done before, but when I saw these stamps I couldn't resist their pure geophysical goodness. They are East German stamps from 1980, and they are unusual because they aren't fanciful illustrations, but precise, technical drawings. Last week I described the gravimeter; today it's the turn of a borehole instrument, the sonic tool.

← The 25 pfennig stamp in the series of four shows a sonic tool, complete with the logged data on the left, and a cross-section on the right. Bohrlochmessung means well-logging; Wassererkundung translates as water exploration. The actual size of the stamp is 43 × 26 mm.

The tool has two components: a transmitter and a recevier. It is lowered to the bottom of the target interval and logs data while being pulled up the hole. In its simplest form, an ultrasound pulse (typically 20–40 kHz) is emitted from the transmitter, travels through the formation, and is recorded at the receiver. The interval transit time is recorded continuously, giving the trace shown on left hand side of the stamp. Transit time is measured in µs/m (or µs/ft if you're old-school), and is generally between 160 µs/m and 550 µs/m (or, in terms of velocity, 1800 m/s to 6250 m/s). Geophysicists often use the transit time to estimate seismic velocities; it's important to correct for the phenomenon called dispersion: lower-frequency seismic waves travel more slowly than the high-frequency waves measured by these tools.

Sonic logs are used for all sorts of other things, for example:

  • Predicting the seismic response (when combined with the bulk density log)
  • Predicting porosity, because of the large difference between velocity in fluids vs minerals
  • Predicting pore pressure, an important safety concern and reservoir property
  • Measuring anisotropy, especially due to oriented fractures (important for permeability)
  • Qualitatively predicting lithology, especially coals (slow), salt (4550 m/s), dolomite (fast)

Image credit: National Energy Technology Lab.Modern tools are not all that different from early sonic tools. They measure the same thing, but with better electronics for improved vertical resolution and noise attenuation. The biggest innovations are dipole sonic tools for accurate shear-wave velocities, multi-azimuth tools for measuring anisotropy, high resolution tools, and high-pressure, high-temperature (HPHT) tools.

Another relatively recent advance is reliable sonic-while-drilling tools such as Schlumberger's sonicVISION™ system, the receiver array of which is shown here (for the 6¾" tool).

The sonic tool may be the most diversely useful of all the borehole logging tools. In a totally contrived scenario where I could only run a single tool, it would have to be the sonic, especially if I had seismic data... What would you choose?

Next time I'll look at the 35 pfennig stamp, which shows a surface geophone. 

News of the week

As EAGE wraps up in Vienna, the spring geoscience convention season is now over for the big international petroleum geoscience societies (other recent conferences included AAPG, SPWLA, and Canada's GeoConvention).

Hammer, hand-lens, notebook, Twitter

A feature of this year's meetings has been the growth in Twitter as a news channel. The tweets are split about 50-50 between marketing broadcasts (mostly noise) and geoscientists' own highlights and thoughts (at least some signal). It would be splendid to see more people embrace Twitter as a way to share nuggets of information at big events. Give it a try: start an account and follow a few people. You'll get geoscience goodness from @allochthonous, @clasticdetritus, @rschott, and of course us, @kwinkunks and @EvanBianco.

Geophysics Rocks!

The International Association of Geophysical Contractors (@geophysicsrocks on Twitter) just launched an outreach website called Geophysics Rocks at the EAGE conference and trade show in Vienna this week. The new website was unveiled to thousands of attendees at the expo when more than 20 participating companies simultaneously played this two-minute video on their booth screens. Talk about a collaborative effort! After it was aired, the video URL was scanable via QR code at every booth that played it.

SEG builds e-Communities

The Society of Exploration Geophysicists (SEG) has rolled out an eCommunities page to add another dimension to their site. Members and visitors can now build and search online profiles to boost collaboration with other professionals. Is this just another late-to-the-party social network, with a new set of connections to link and maintain, or can it bring something new? It does have one thing going for it: it tugs at our primal urges for attribution and recognition among our peers. Stand out with outstanding content!

Rock Solid Images praised for rock physics atlas

Rock Solid Images (RSI) have compiled a 90-well Rock Physics & Seismic Response Atlas in support of a new licensing round in the Barents Sea. The report was announced in April and RSI has reported pre-orders of $600k ahead of its July release. The Atlas contains a catalog of forward modeled seismic responses with an emphasis on fluid substitution and saturation effects. The Atlas embodies a novel approach to setting standards of communication and knowledge across a basin. It will place RSI in a good position to sell advanced technologies to, and innovate for, their clients. Clever.

This regular news feature is for information only. We aren't connected with any of these organizations, and don't necessarily endorse their products or services.

More geophysics apps

Please welcome our latest app, Fold*, into the world. It is now available for free in the Android Market. This one is aimed at geophysicists planning land 3D seismic surveys. You provide some basic data about the geometry, and the tool computes fold in natural bins, and trace density per unit area. It also provides a qualitative description of what such a geometry might be good for (simple structure only, say, or high S:N or reflectivity areas). Read all about it in the wiki.

We have also put together a new page on this website, gathering news & info all our geoscience apps in one place. You will find it in the title bar above. Please share it with anyone you see using an Android™ phone or tablet!

 If you have a wish for an app, leave a comment or drop us a line!

Geophysical stamps

About a month ago I tweeted about some great 1980 East German stamps I'd seen on eBay. I impulsively bought them and they arrived a couple of weeks ago. I thought I'd write a bit about them and the science that inspired them. This week: Gravimeter.

East Germany in 1980 was the height of 'consumer socialism' under Chairman & General Secretary Eric Honecker. Part of this movement was a new appreciation for economic growth, and the role of science and technology in the progress of society. Putting the angsts and misdeeds of the Cold War to one side, perhaps these stamps reflect the hopes for modernity and prosperity.

← The 20 pfennig stamp from the set of four 1980 stamps from the German Democratic Republic (Deutsche Demokratische Republik). The illustration shows a relative gravimeter, the profile one might expect over a coal field (top), and a cross section through a coal deposit. Braunkohlenerkundung translates roughly as brown coal survey. Brown coal is lignite, a low-grade, low maturity coal.

There are two types of gravimeter: absolute and relative. Absolute gravimeters usually time the free-fall of a mass in a vacuum. The relative gravimeter is also a simple instrument. It must be level to measure the downward force, hence the adjustable legs. Inside the cylinder, a reference body called a proof mass is held by a spring and an electrostatic restoring force. If the gravitational force on the mass changes, the electrostatic force required to restore its position indicates the change in the gravitational field.

Fundamentally, all gravimeters measure acceleration due to gravity. Surprisingly, geophysicists do not generally use SI units, but the CGS system (centimetre–gram–second system). Thus the standard reporting units for gravimetry are not m/s2 but cm/s2, or gals (sometimes known as galileos, symbol Gal). In this system, the acceleration due to gravity at the earth's surface is approximately 980 Gal. Variations due to elevation and subsurface geology are measured in mGal or even µGal.

Image credit: David Monniaux, from commons.wikimedia.org, licensed under CC-BY-SA

Some uses for gravimeters:

  • Deep crustal structure (given the density of the crust)
  • Mineral exploration (for example, low gravity due to coal, as shown on the stamp)
  • Measuring peak ground acceleration due to natural or induced seismicity
  • Geodesic measurement, for example in defining the geoid and reference ellipsoid
  • Calibration and standards in metrology

Modern relative gravimeters use the same basic engineering, but of course has much better sensitivity, smaller errors, improved robustness, remote operation, and a more user-friendly digital interface. Vibrational noise suppression is also quite advanced, with physical isolation and cunning digital signal processing algorithms. The model shown here is the Autograv CG-5 from Scintrex in Concord, Ontario, Canada. It's designed for portability and ease of use.

Have you ever wielded a gravimeter? I've never met one face to face, but I love tinkering with precision instruments. I bet they pop up on eBay occasionally...

Next time I'll look at the the 25 pfennig stamp, which depicts a sonic borehole  tool.

News of the week

We've had a couple of weeks off in the newsroom, making way for the Canadian Geoconvention in Calgary last week. But this week we're back with geoscience and technology news that has caught our beady eyes recently.

Bids called for three oil blocks off Newfoundland

The Canada-Newfoundland and Labrador Offshore Petroleum Board (CNLOPB) called for nominations on three exploration parcels: one in the Gulf of St Lawrence, a second near the northern tip of Labrador, and a third in the Flemish Pass region north of the Jeanne d'Arc Basin. Producing projects in the latter area are delivering about 263 000 barrels per day. Interested parties have until 15 November to submit a bid.

Perceptive Pixel's 27" tablet

Perceptive Pixel has just announced a brand new 27-inch multi-touch desktop screen that could redefine the personal workstation and transform the way we work with computers. This new product isn't totally new technology, but it should be much more affordable and 'desktop ready' than their previous, highly customized, offerings. We can't wait to see seismic data on this thing! 

CEO Jeff Han originally introduced this technology at a TED conference in 2006. To read more about the technology and the company, which already lists Chevron among its clients, check out the press release

Open prestack seismic

The Open Seismic Repository, curated by dGB Earth Sciences, has just made available the prestack gathers for the Penobscot 3D seismic volume. This is especially exciting for Canadians: the Penobscot data are from Sable Island, Nova Scotia. This data set is over 100 GB and just might be the largest freely accessible seismic data on the web. It's an exciting addition to the collection, which already includes a small subset of gathers (below). We hope interpretations and reprocessings of these data get shared back into the community. Openness FTW!

In other news, dGB Earth Sciences and ARK CLS have launched an OpendTect connector plug-in for Schlumberger's Petrel, so that OpendTect's leading commercial plug-ins can accessed by the Petrel community. The plug-in is available in Schlumberger's OceanStore.

This regular news feature is for information only. We aren't connected with any of these organizations, and don't necessarily endorse their products or services. OpendTect is a mark of dGB Earth Sciences, and Petrel and Ocean are marks of Schlumberger.

Volumetrics on the back of a digital envelope

A few weeks ago we launched our first mobile app, Volume*, now available in the Android Market (you can jump right to it with the barcode on the right). If you have an Android phone or tablet, please check it out! Today, I thought I'd write a bit more about I built the app, show you some of the gory details, and tell you about the latest update.

Read More