
Code Show version 1.0
/
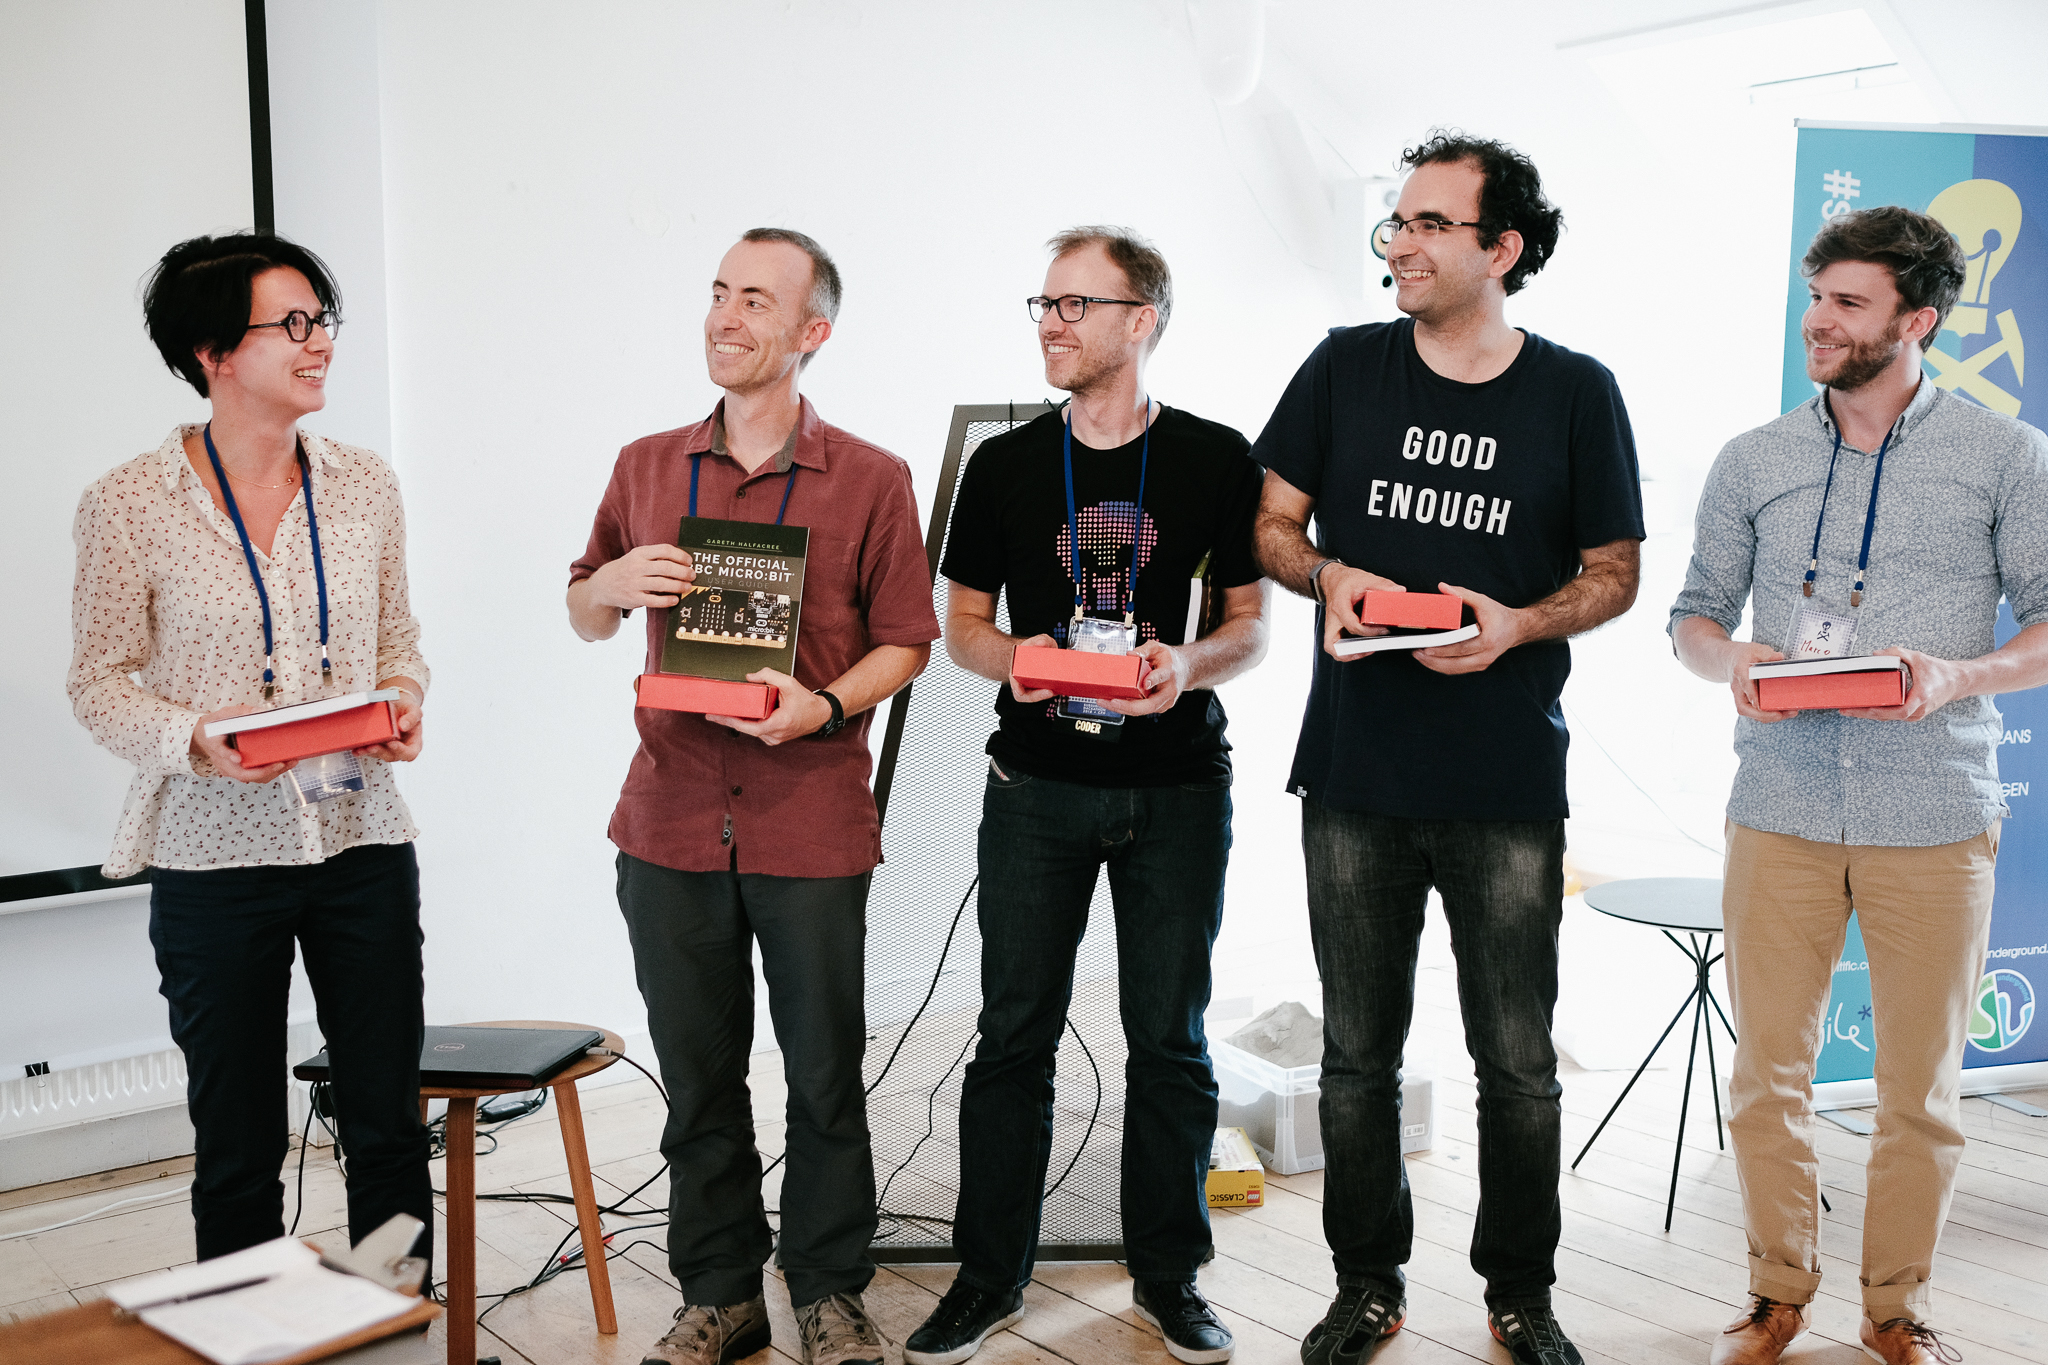
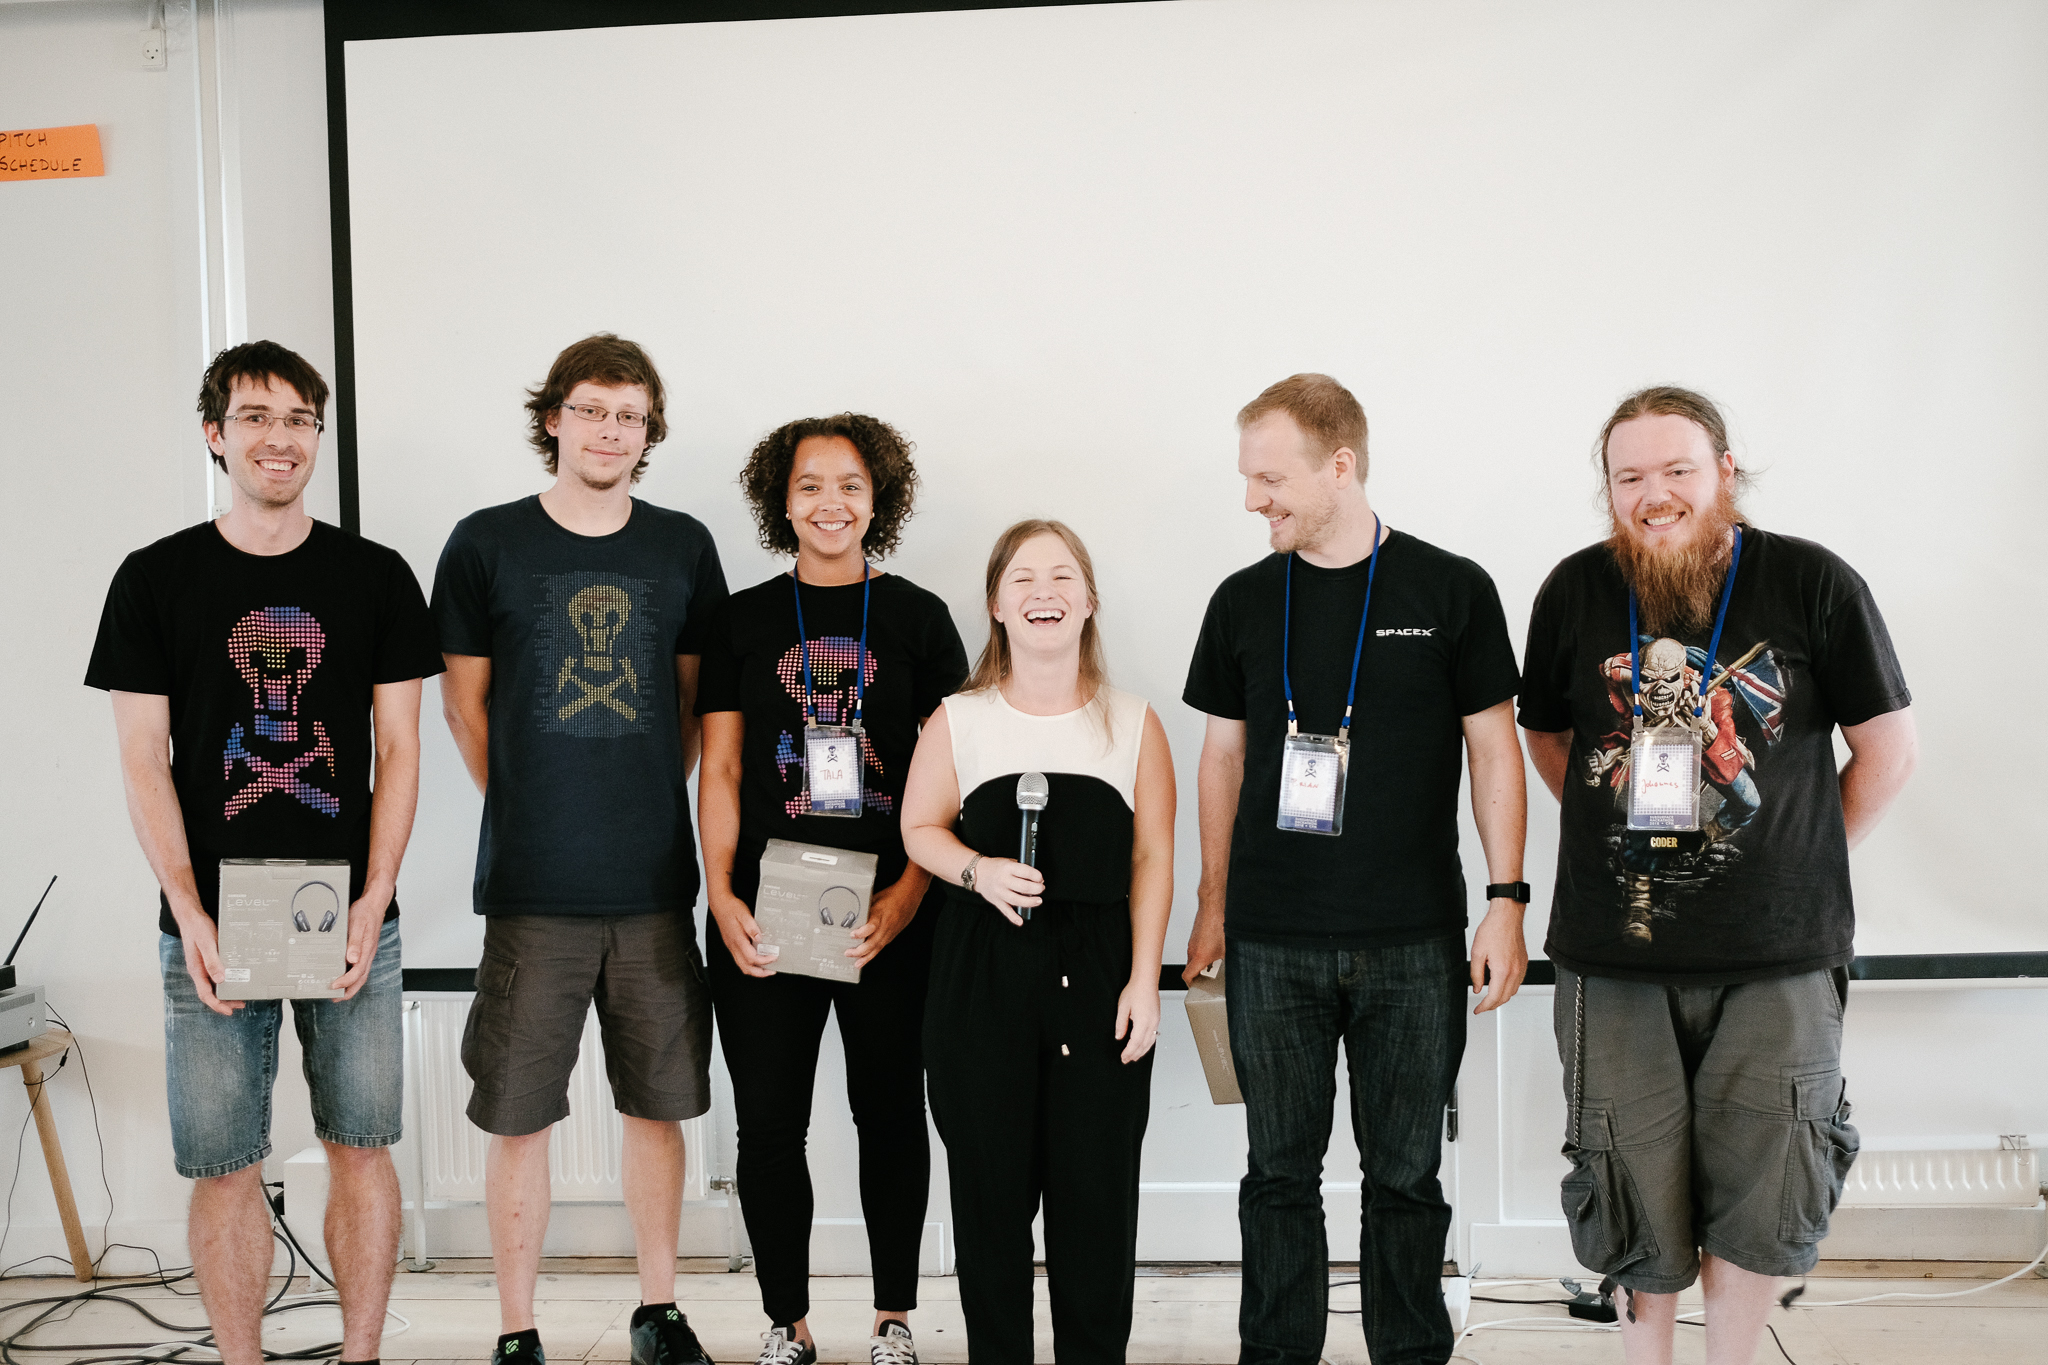
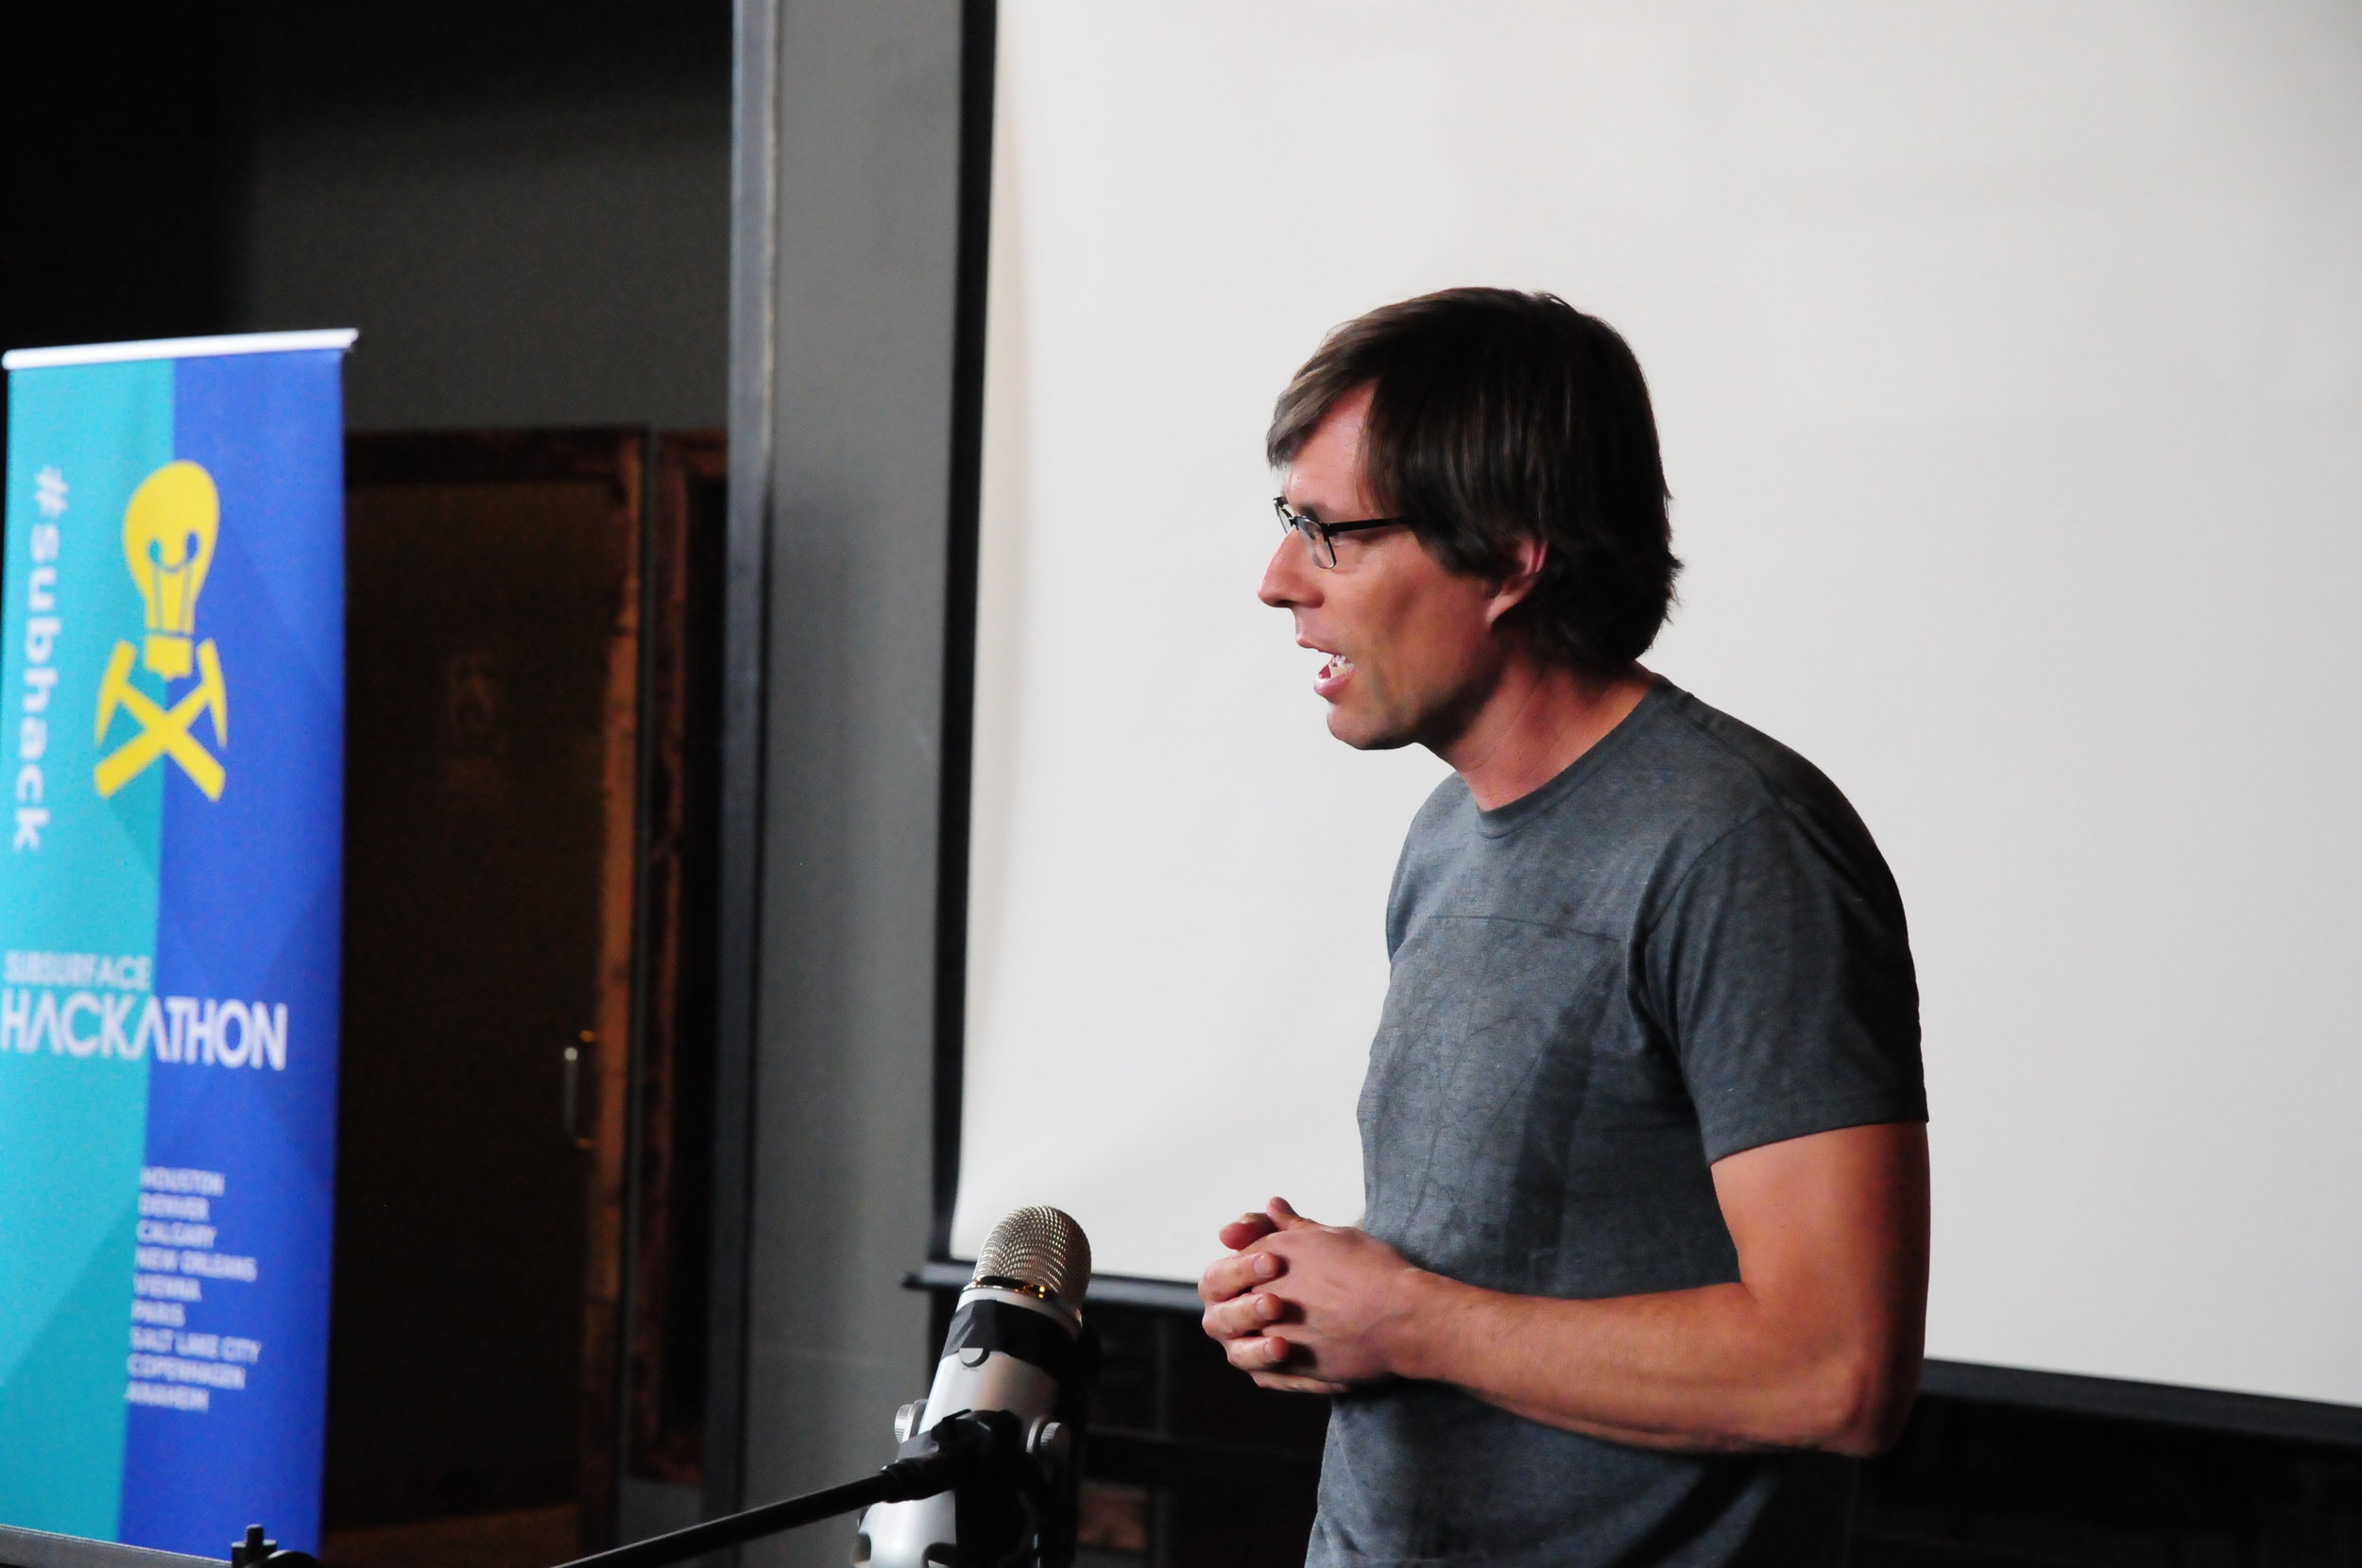
Last week we released Code Show version 1.0. In a new experiment, we teamed up with Total and the European Association of Geoscientists and Engineers at the EAGE Annual Conference and Exhibition in Copenhagen. Our goal was to bring a little of the hackathon to as many conference delegates as possible. We succeeded in reaching a few hundred people over the three days, making a lot of new friends in the process. See the action in this Twitter Moment.
What was on the menu?
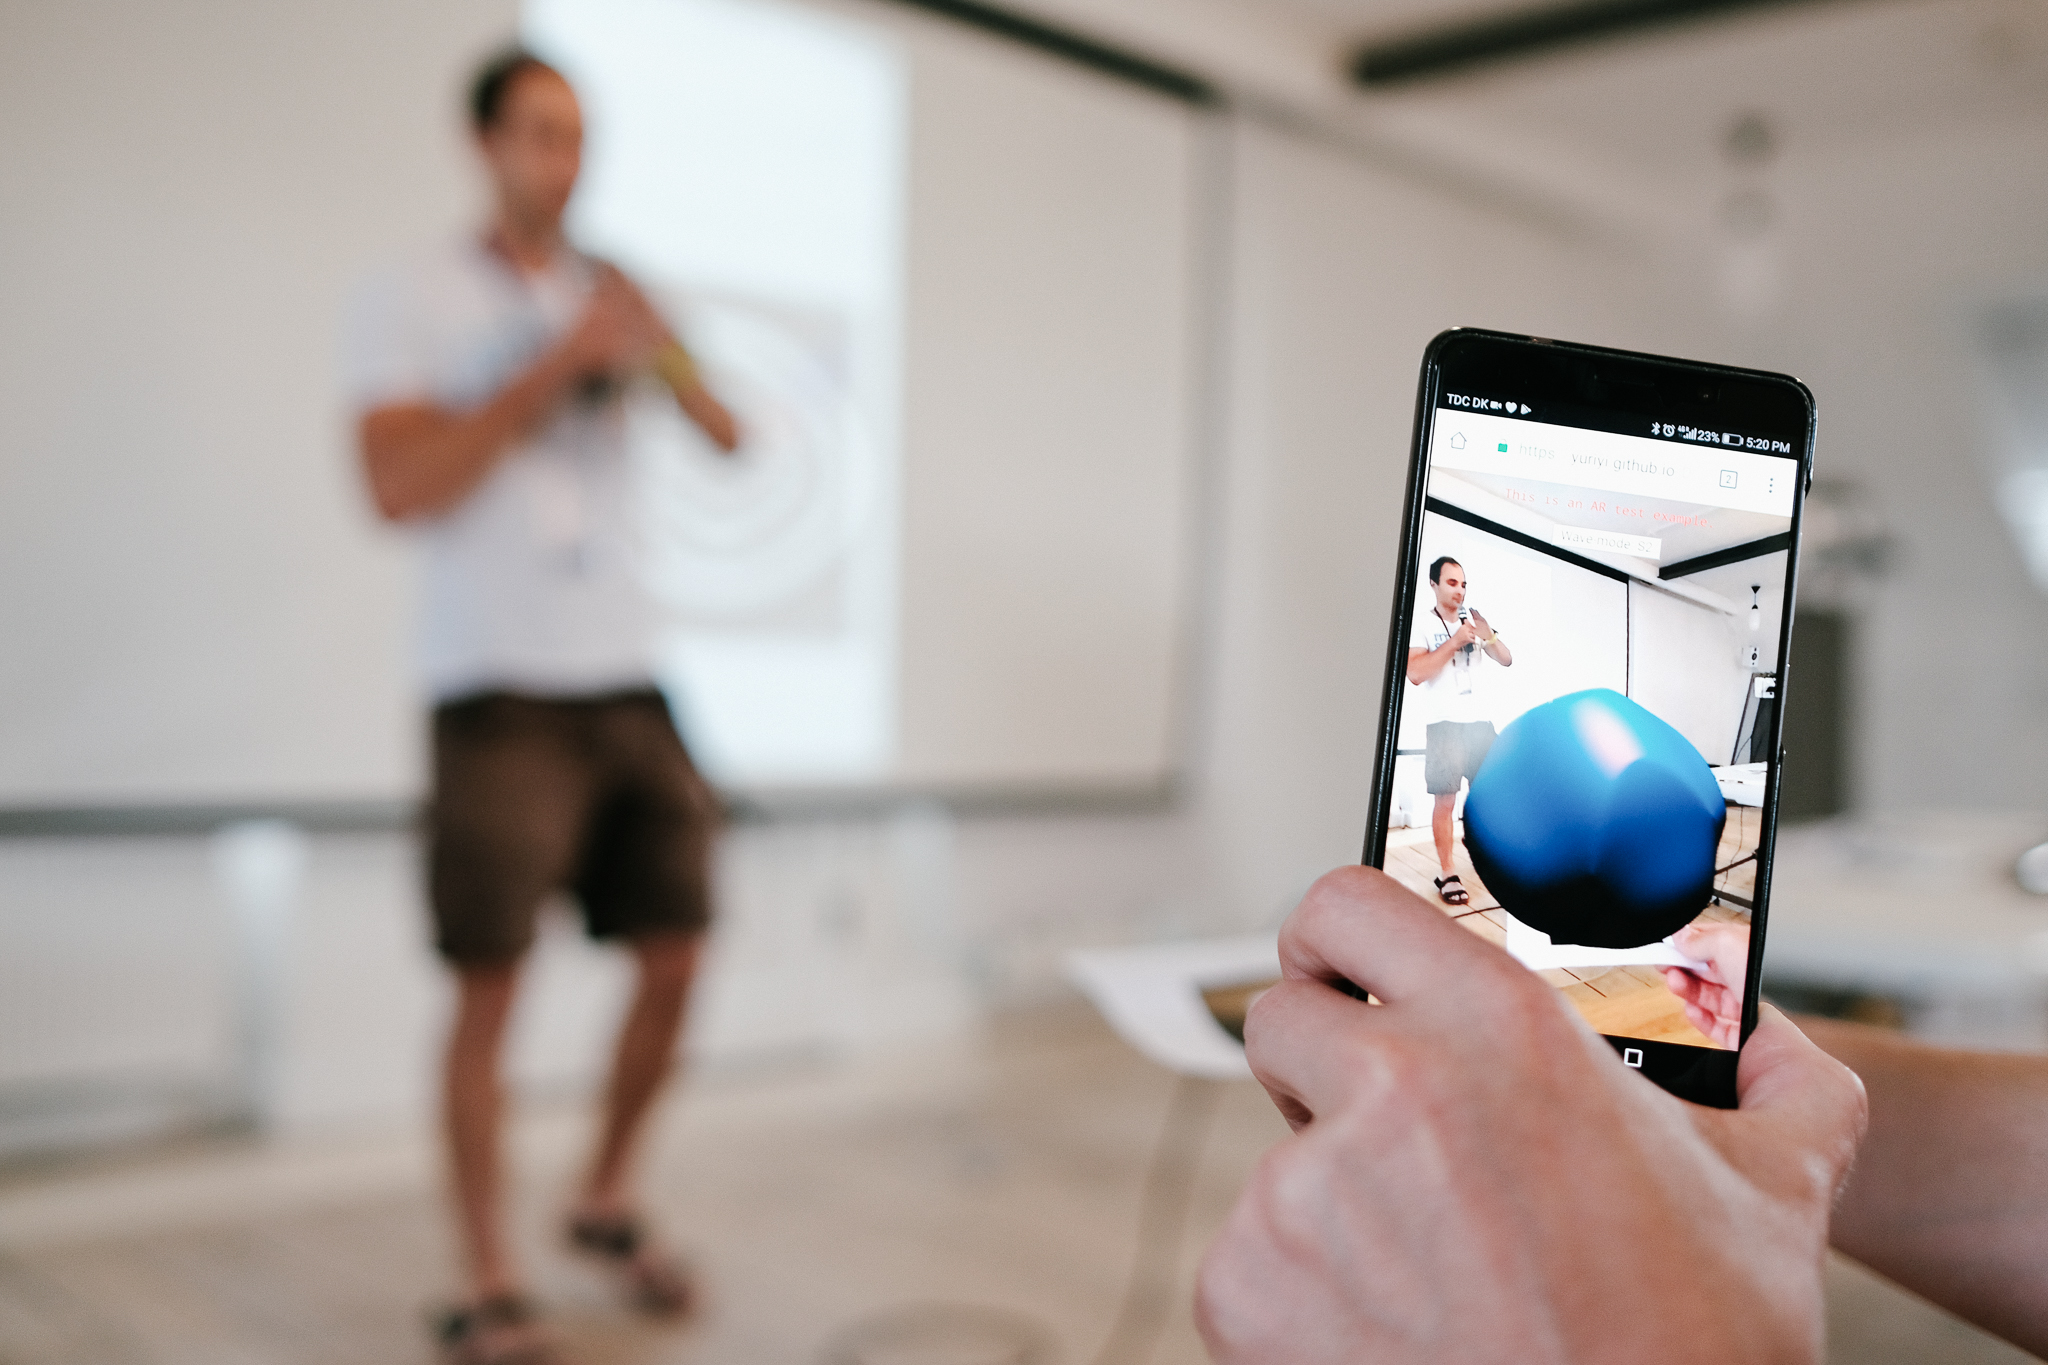
The augmented reality sandbox that Simon Virgo and his colleagues brought from the University of Aachen. The sandbox displayed both a geological map generated by the GemPy 3D implicit geological modeling tool, as well as a seismic wavefield animation generated by the Devito modeling and inversion project. Thanks to Yuriy Ivanov (NTNU) and others in his hackathon team for contributing the seismic modeling component.
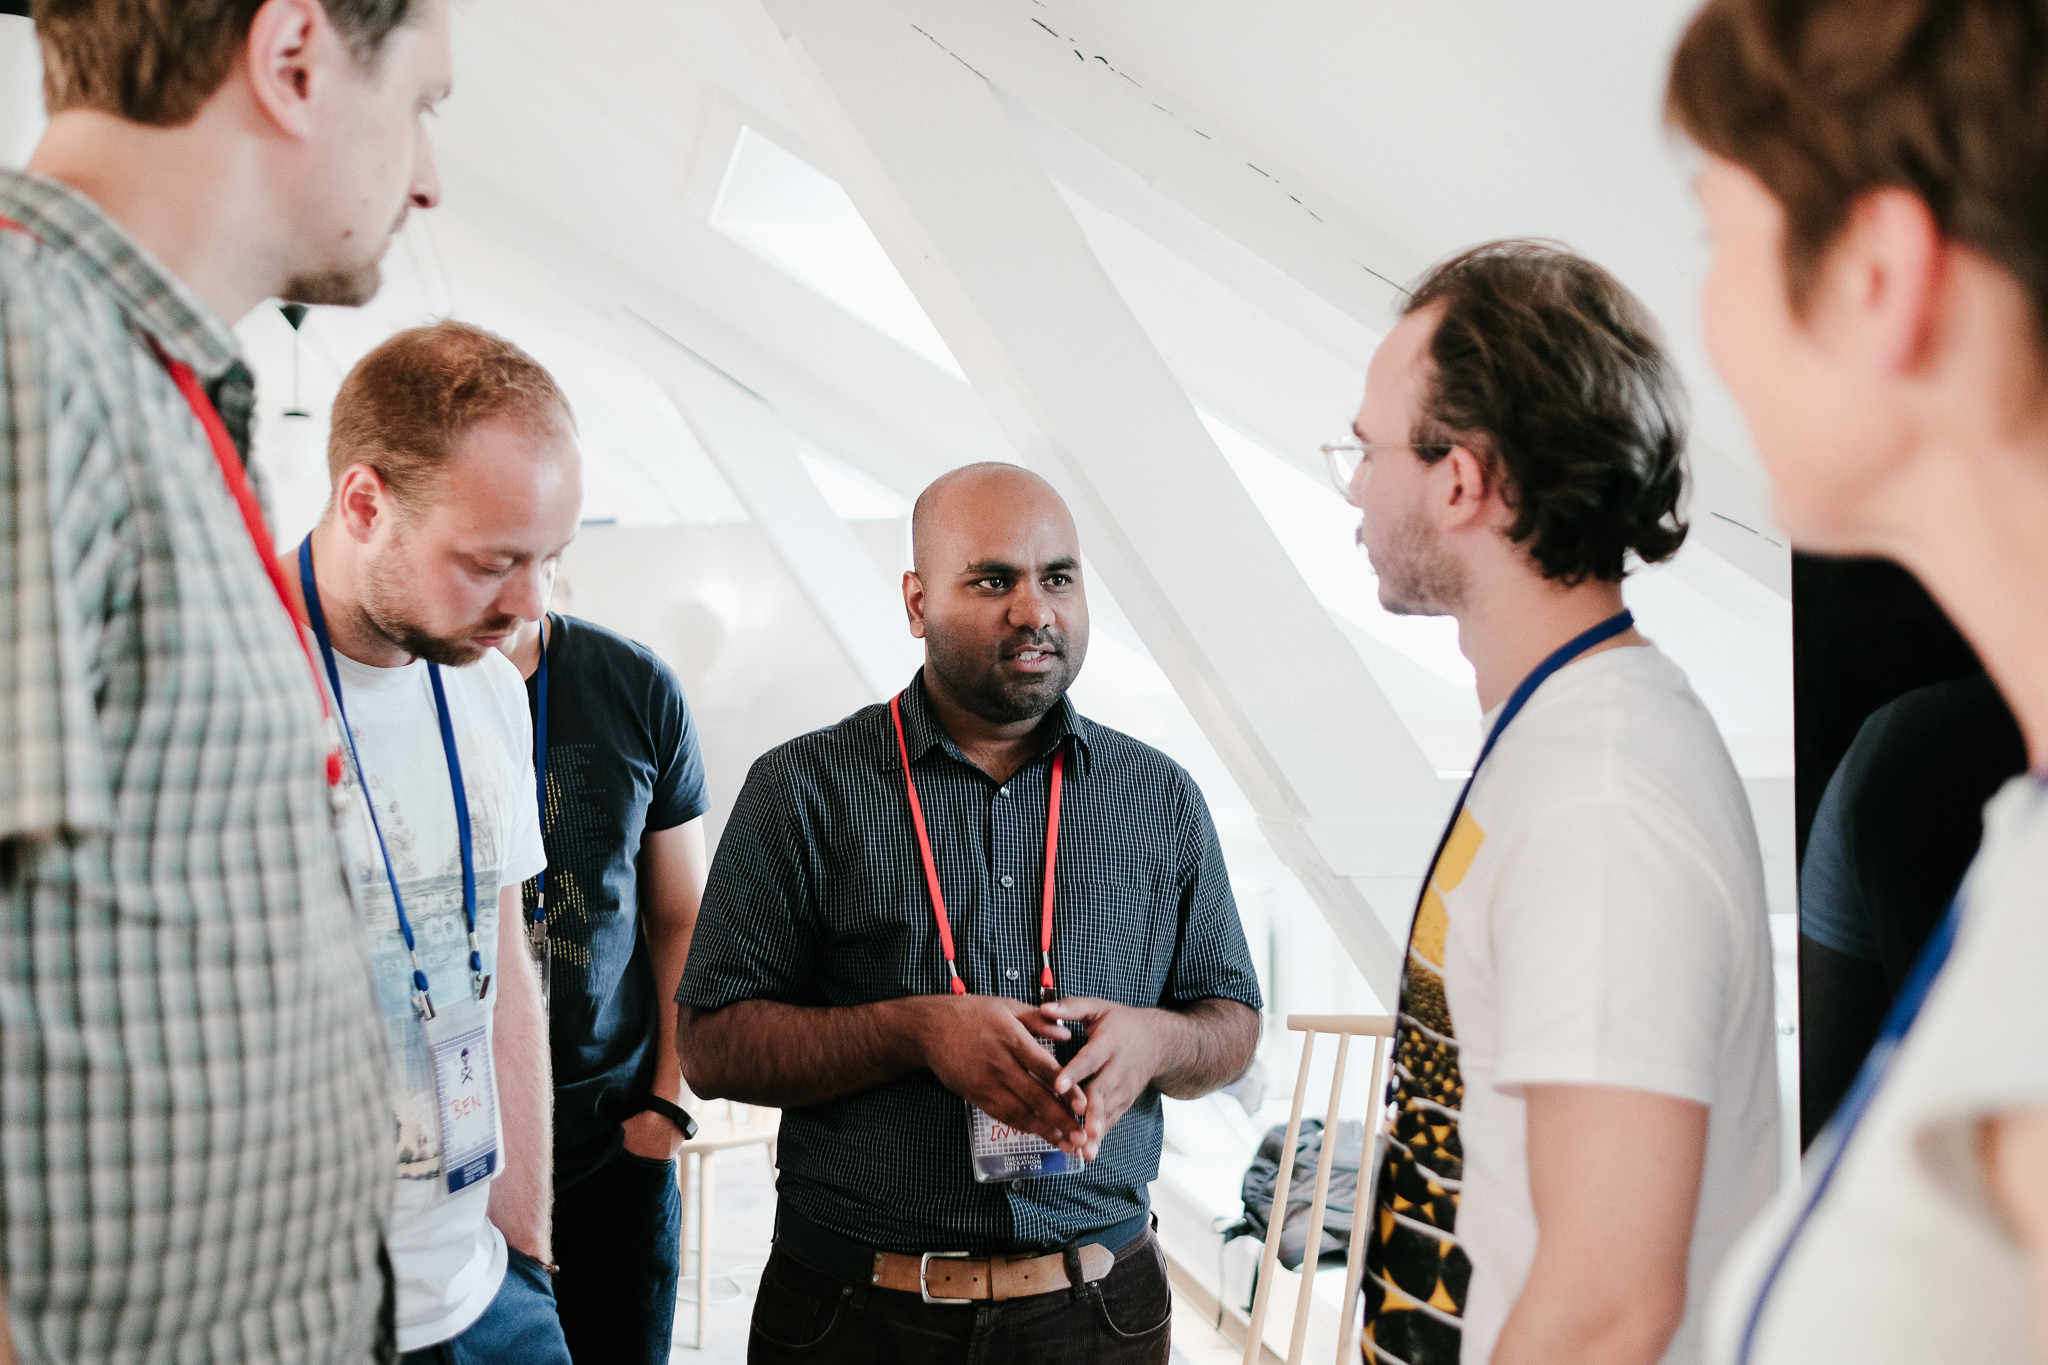
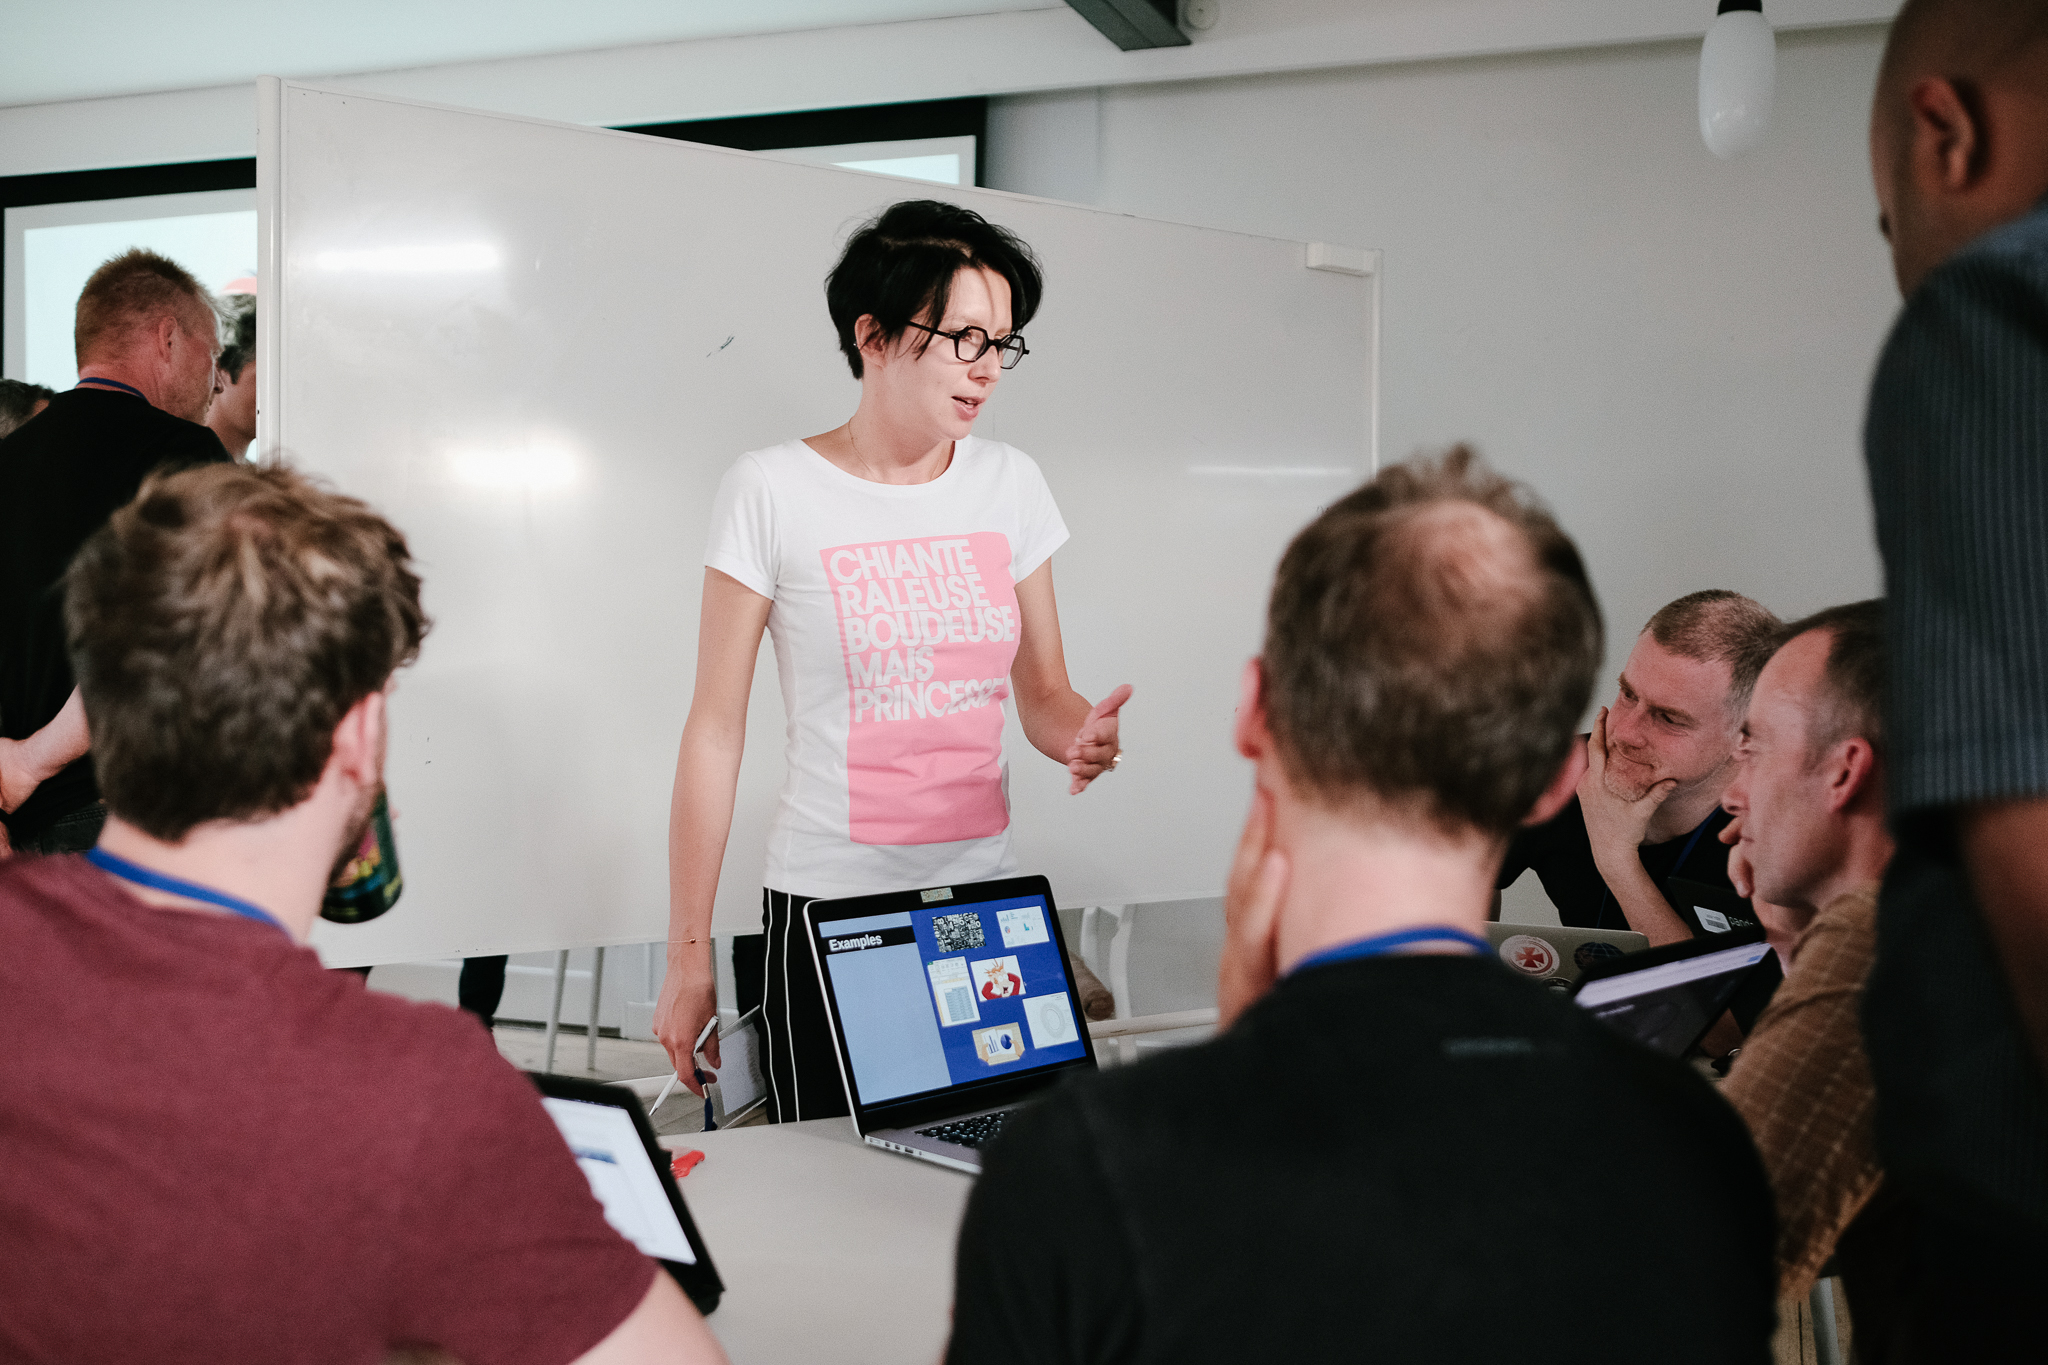
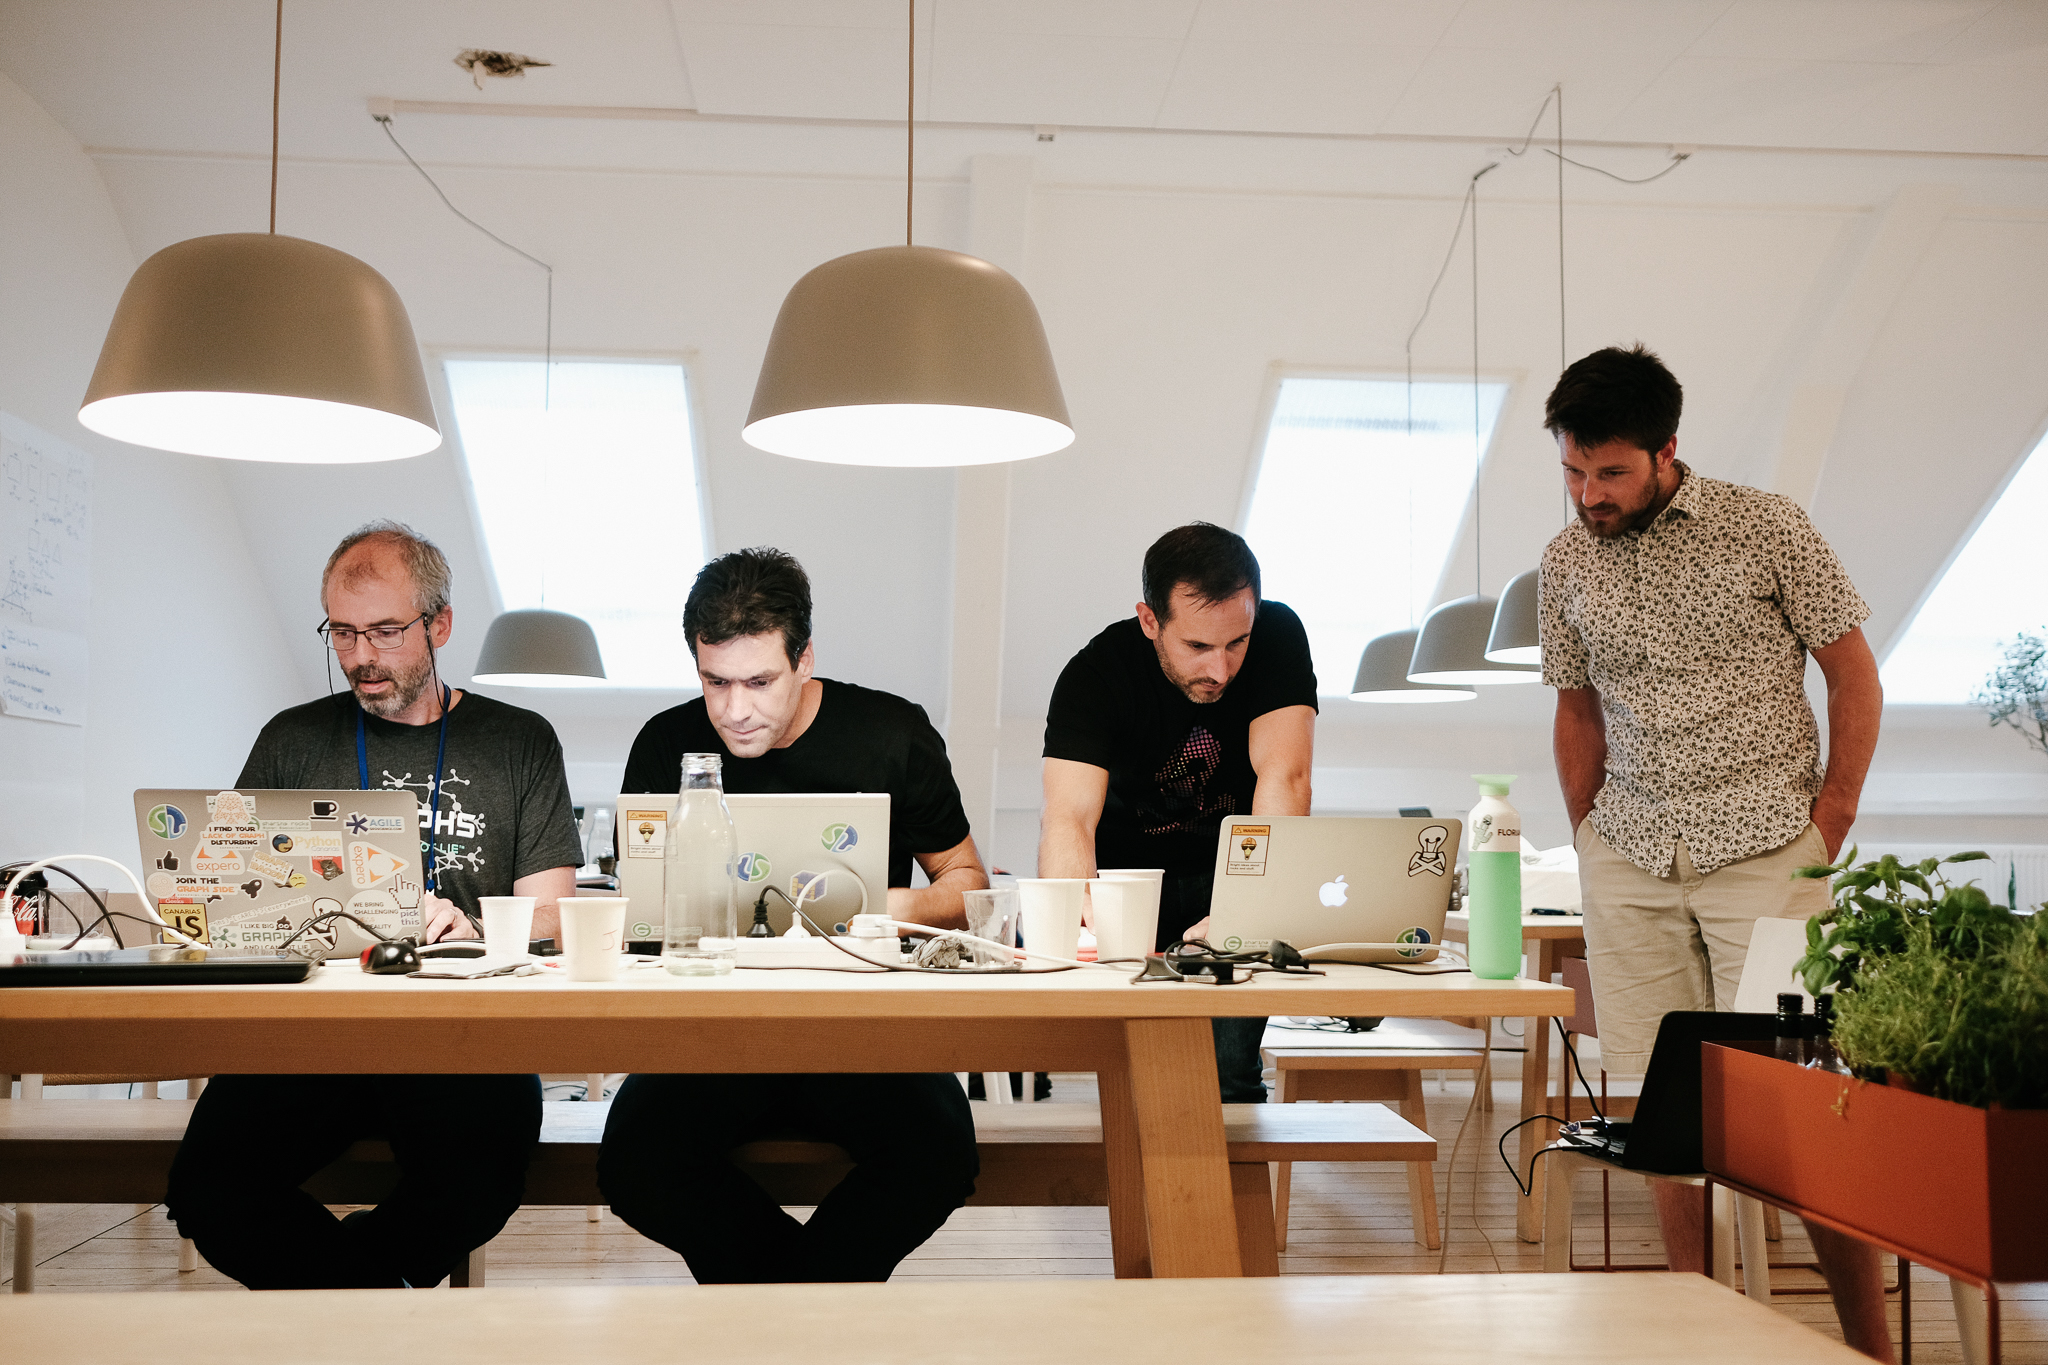
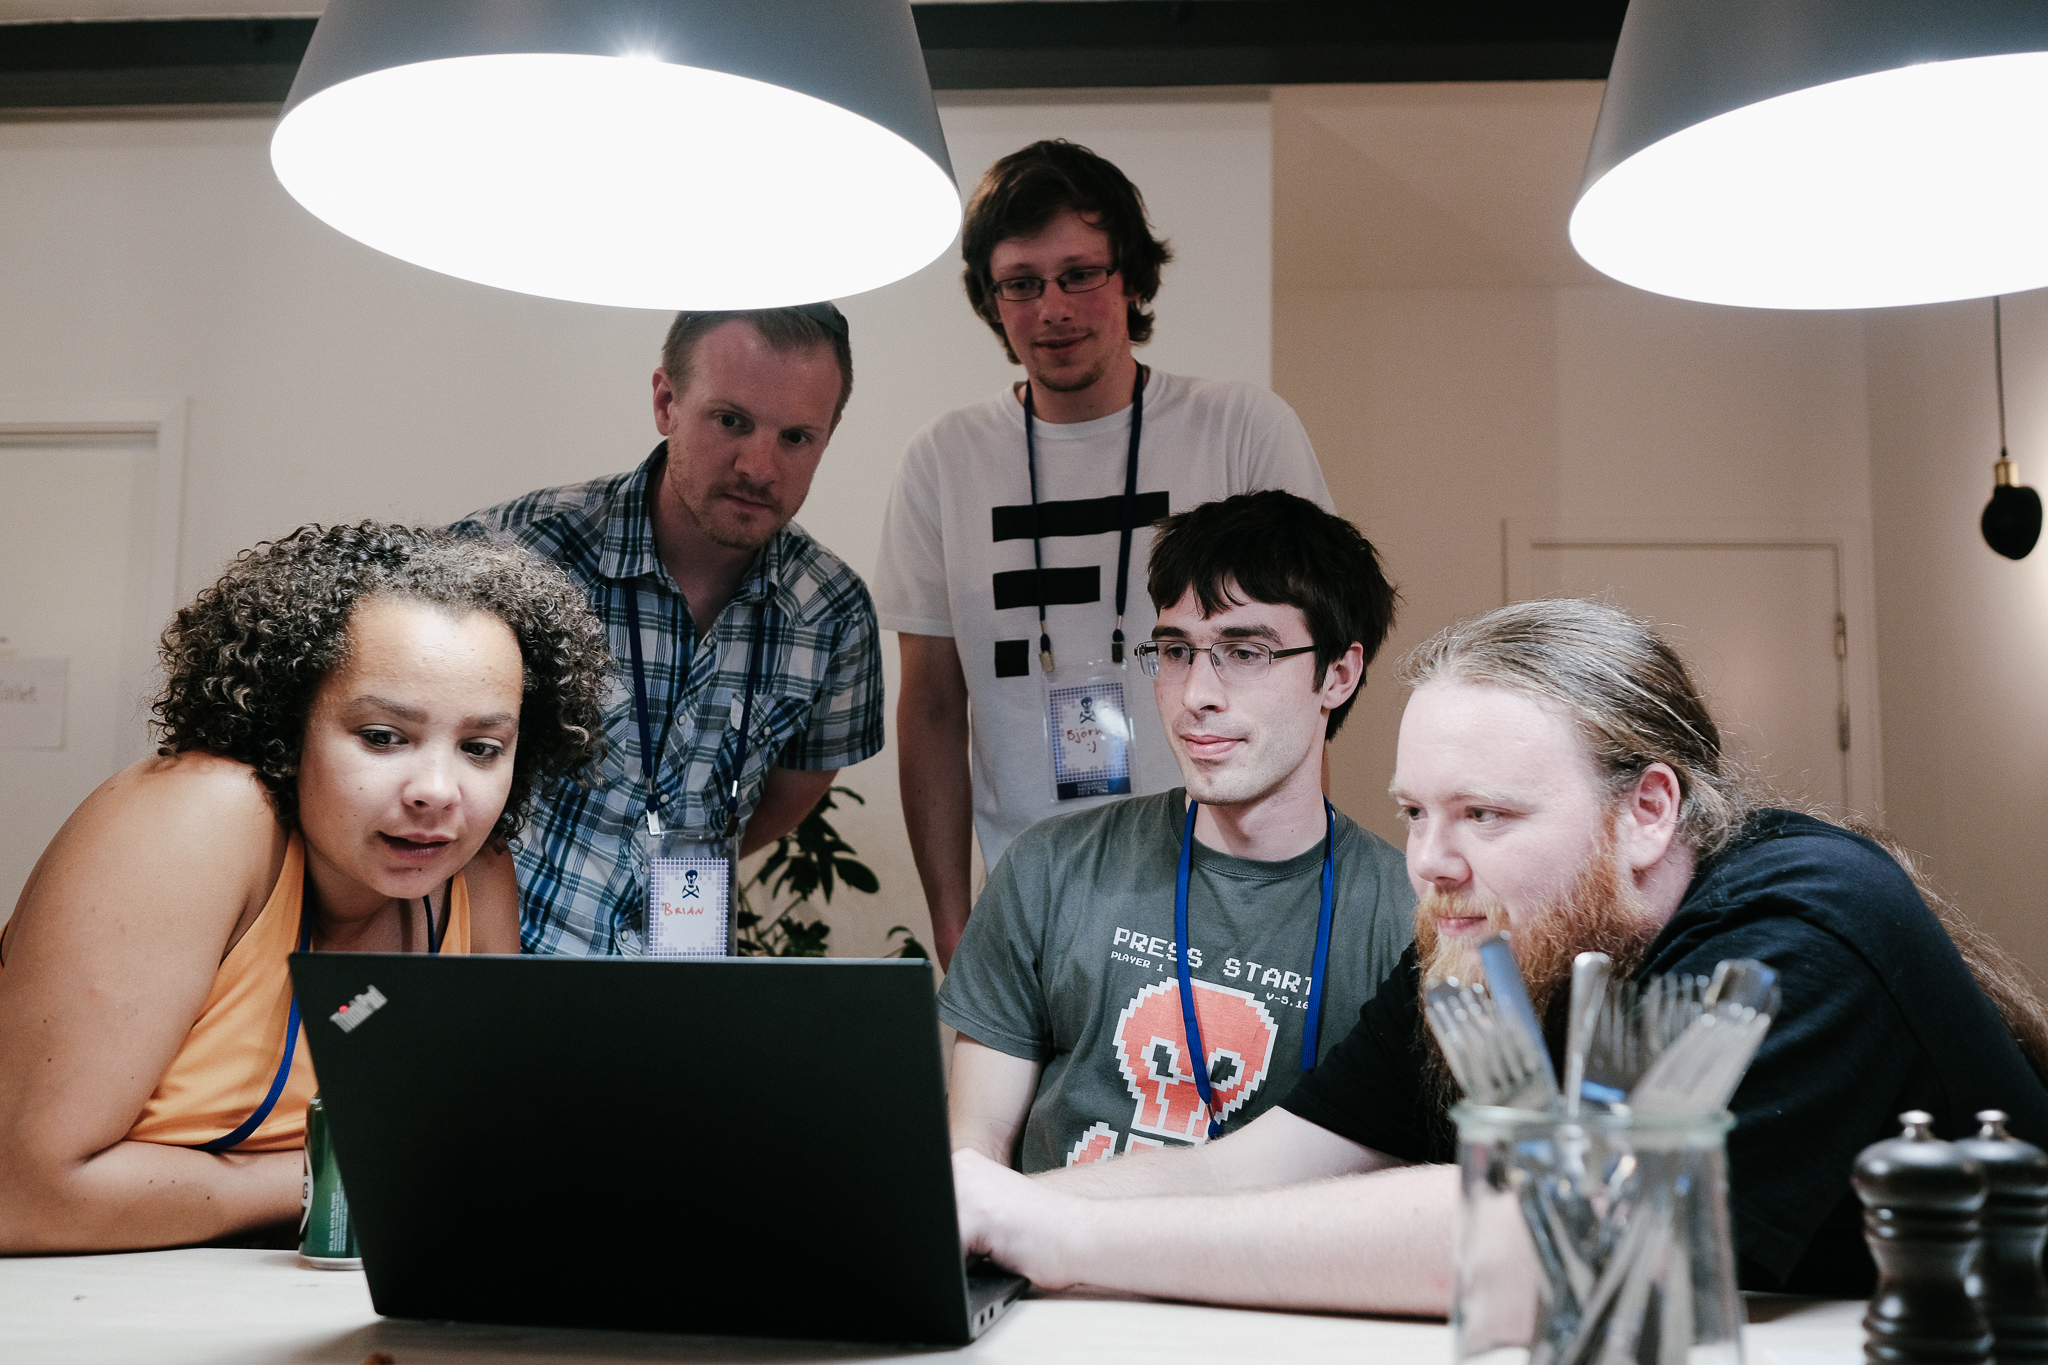
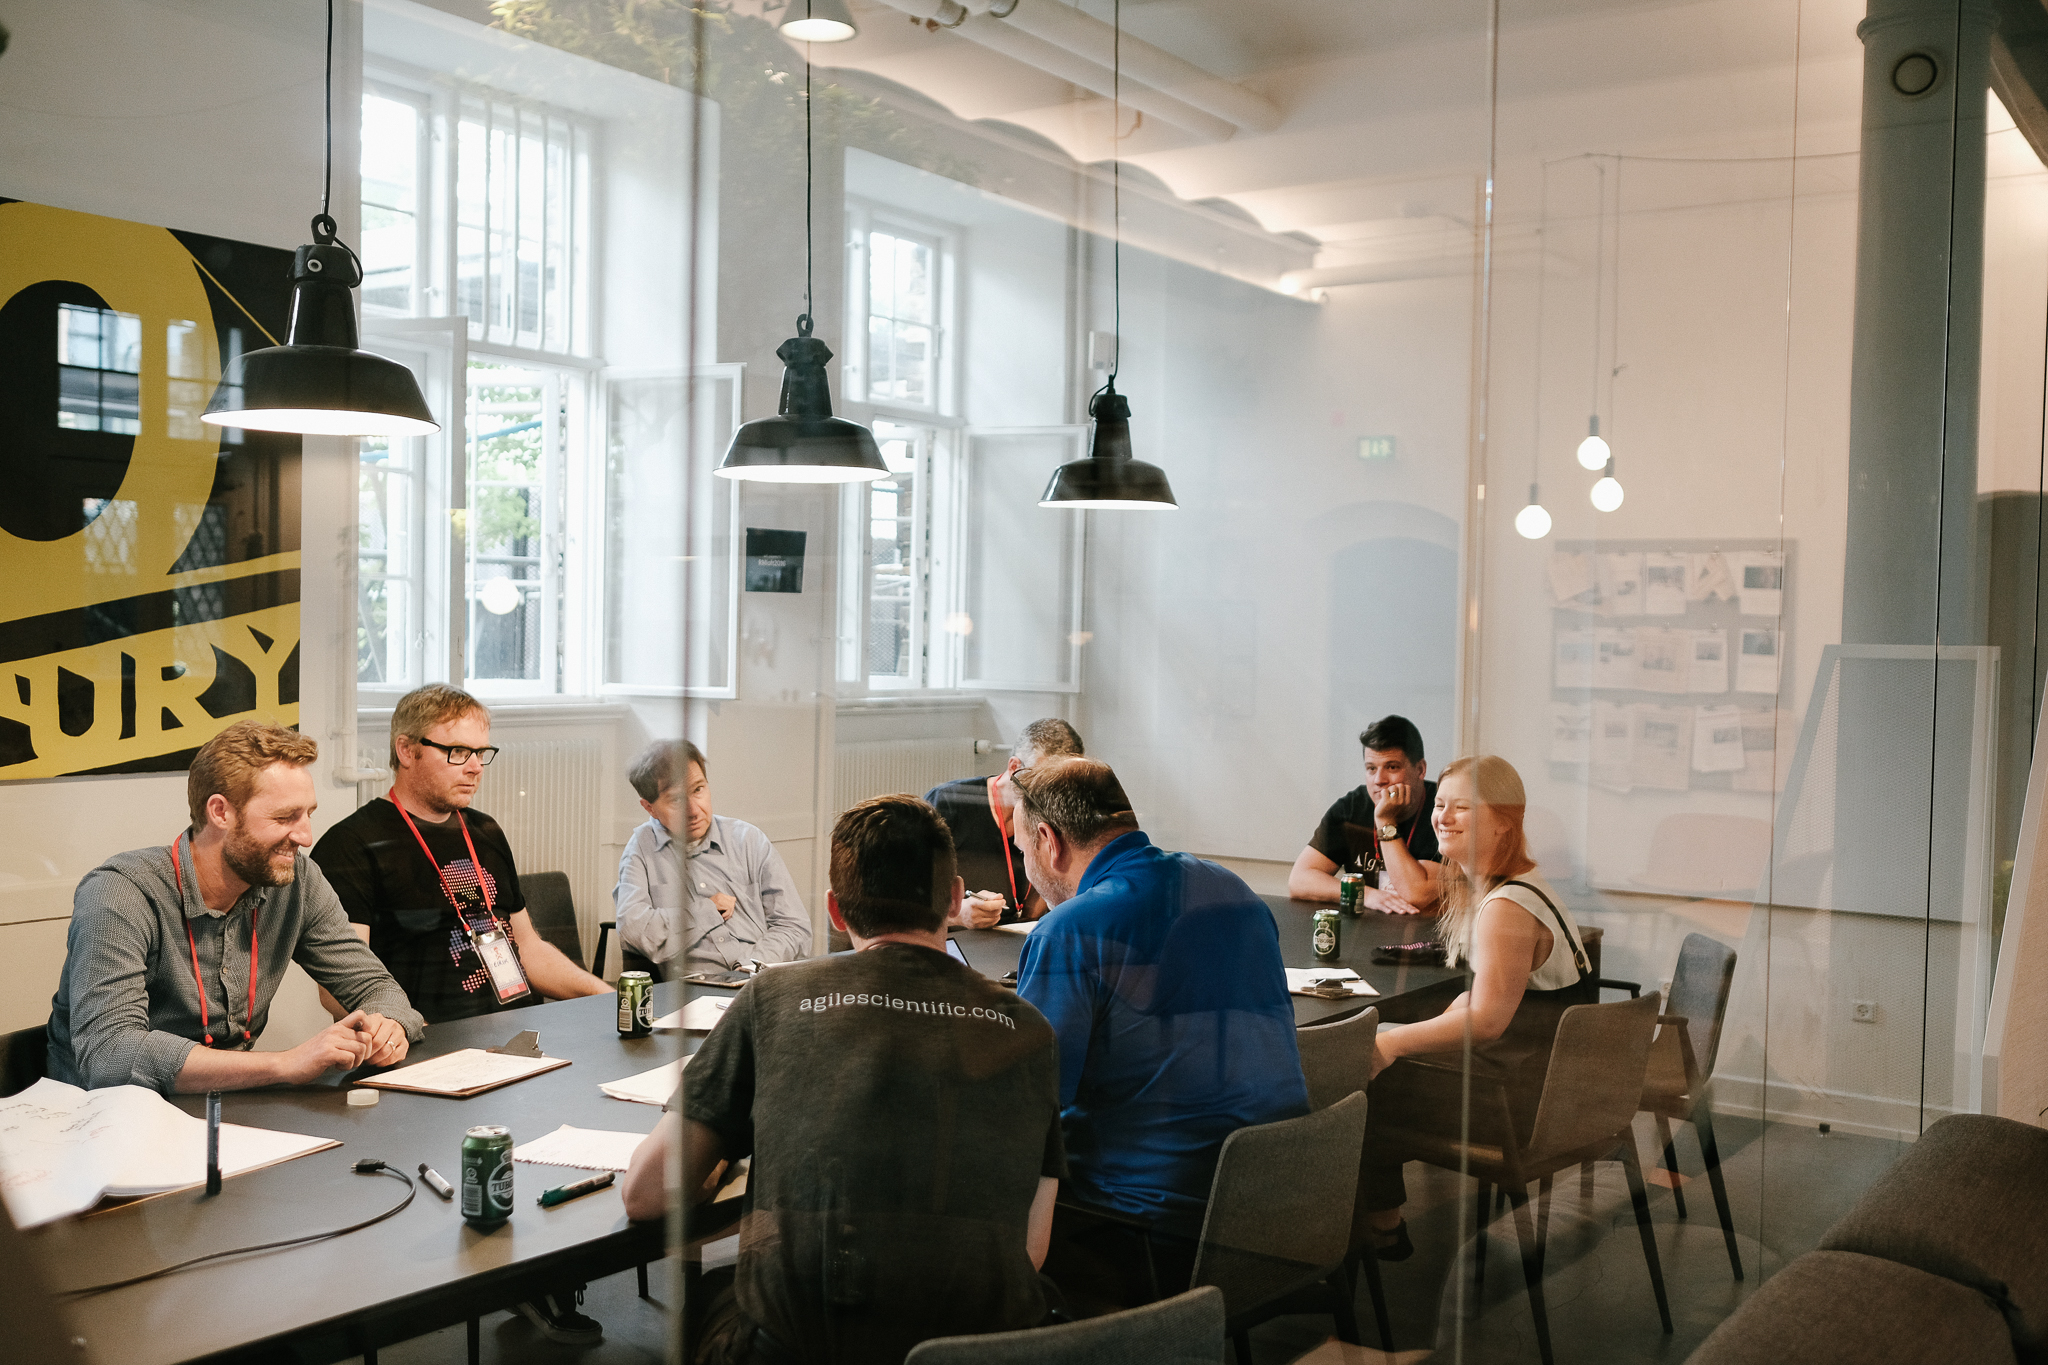
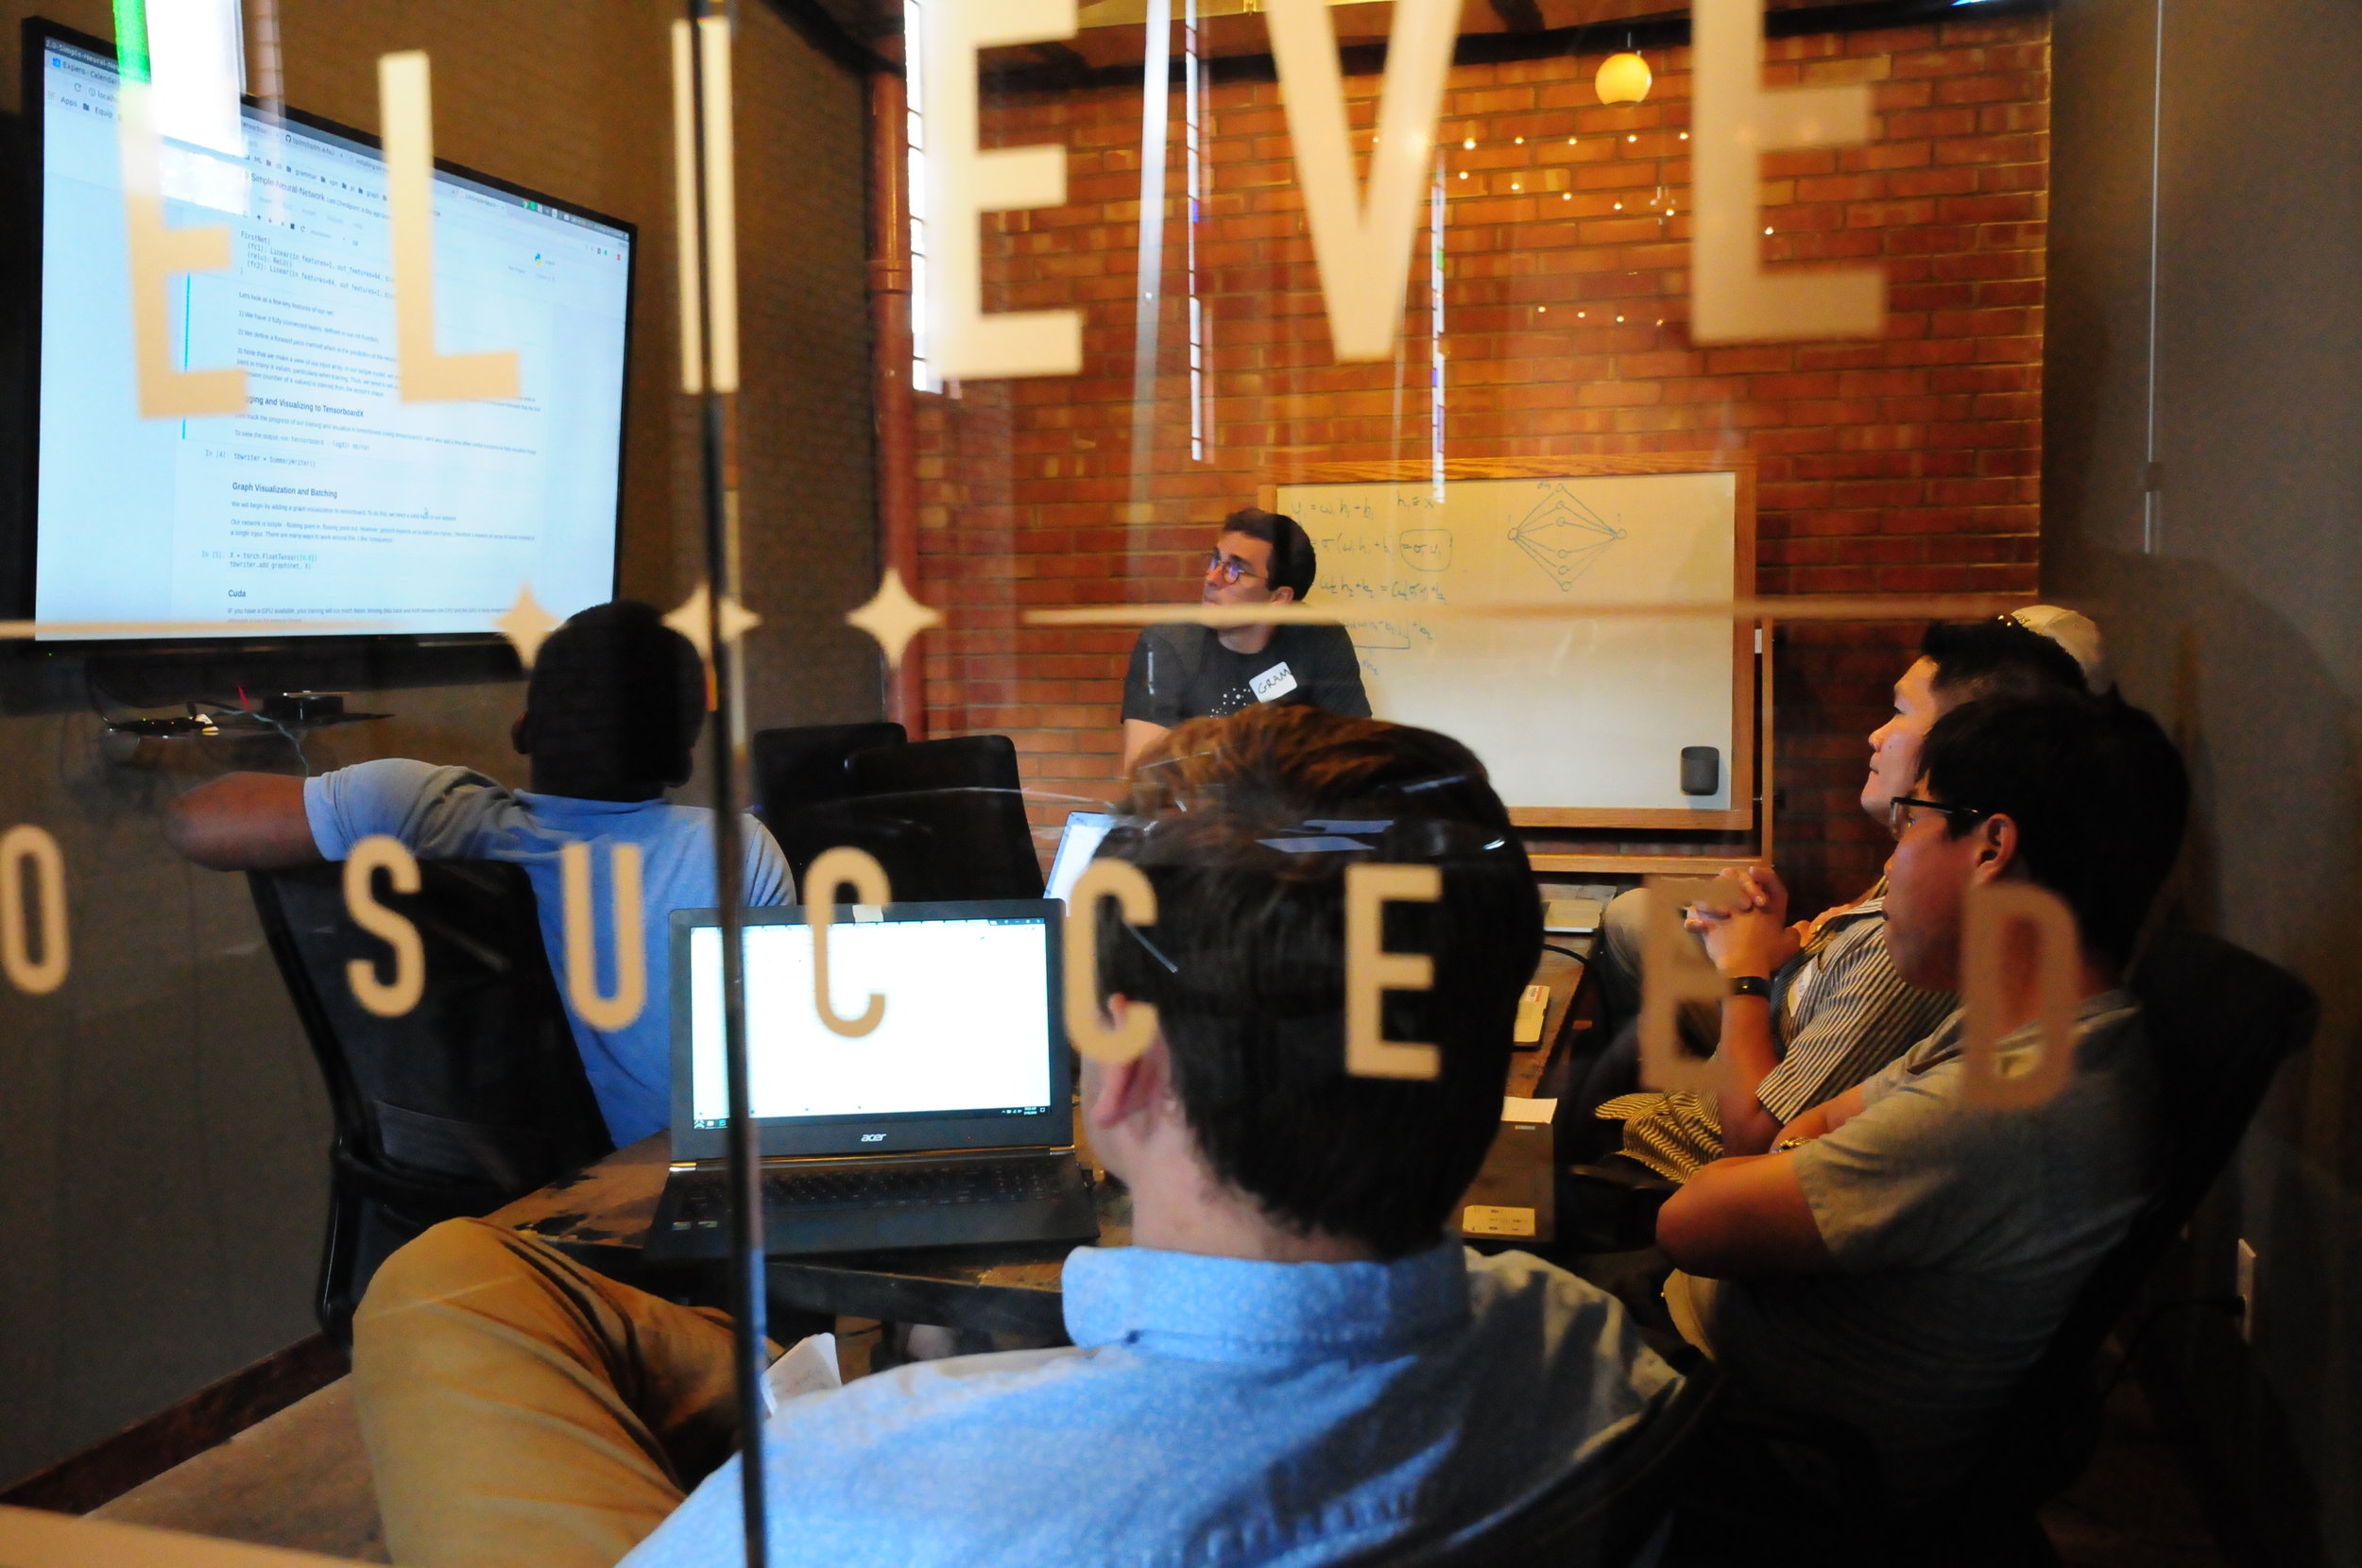
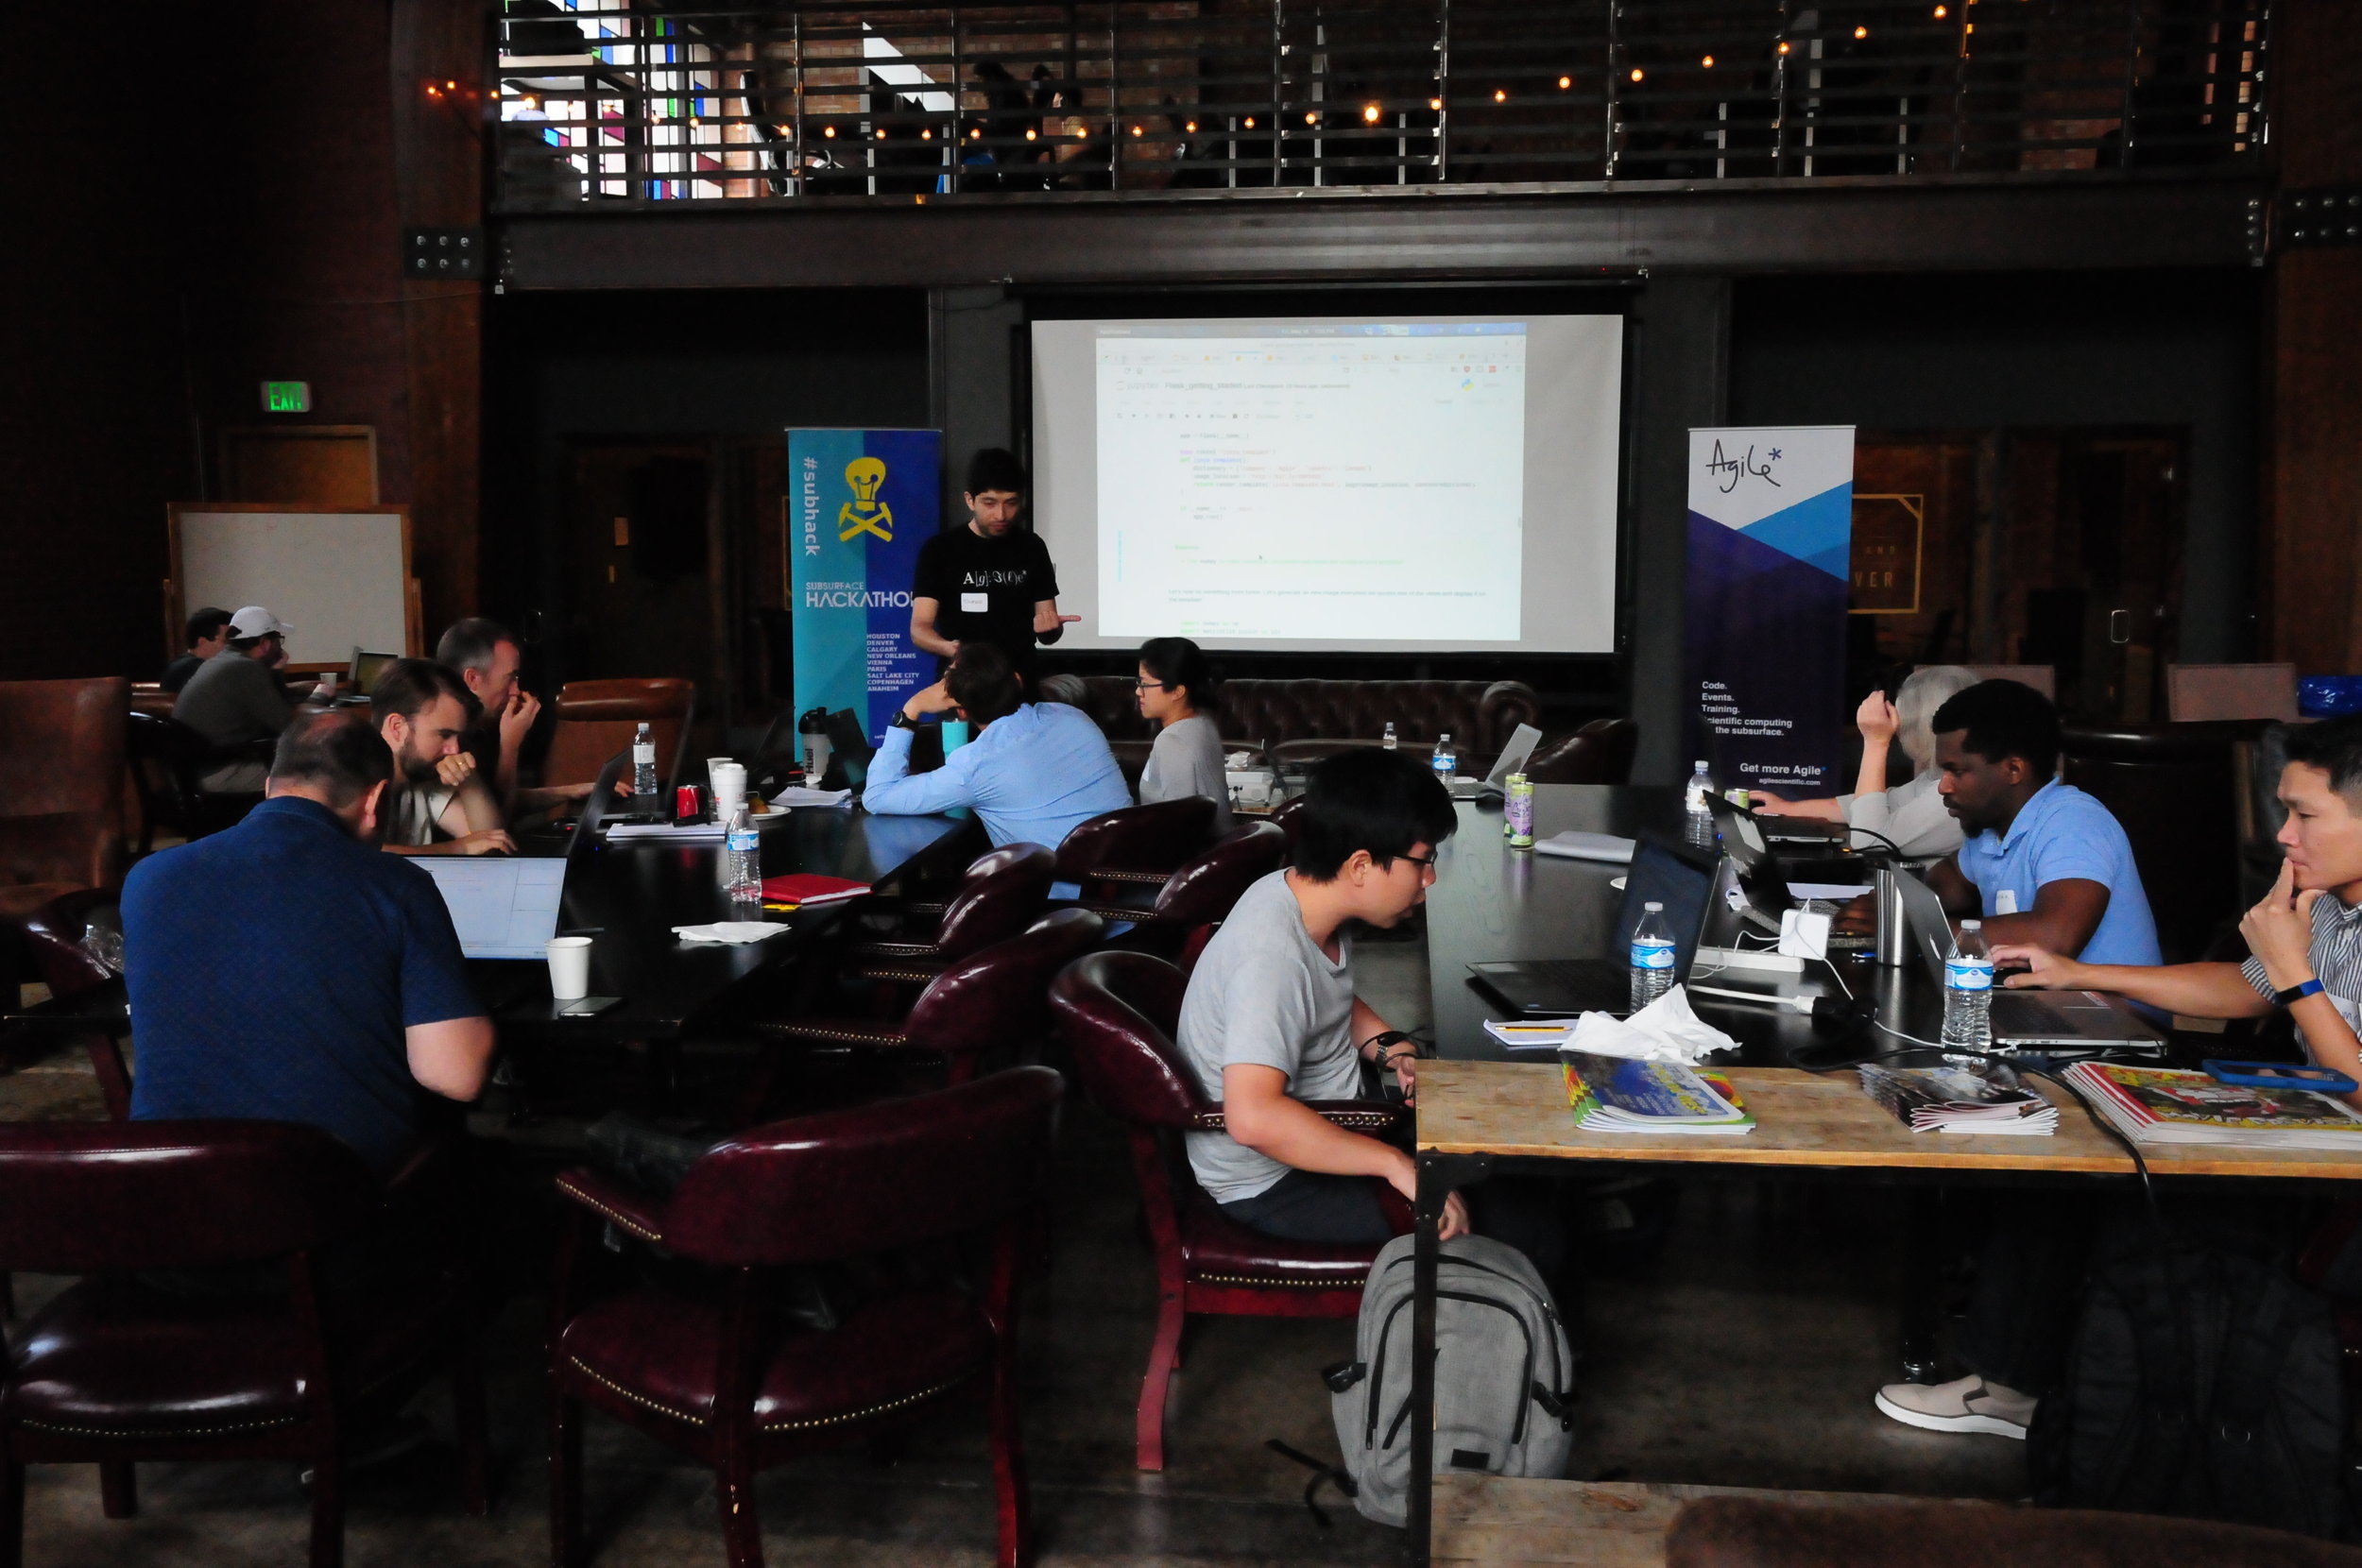
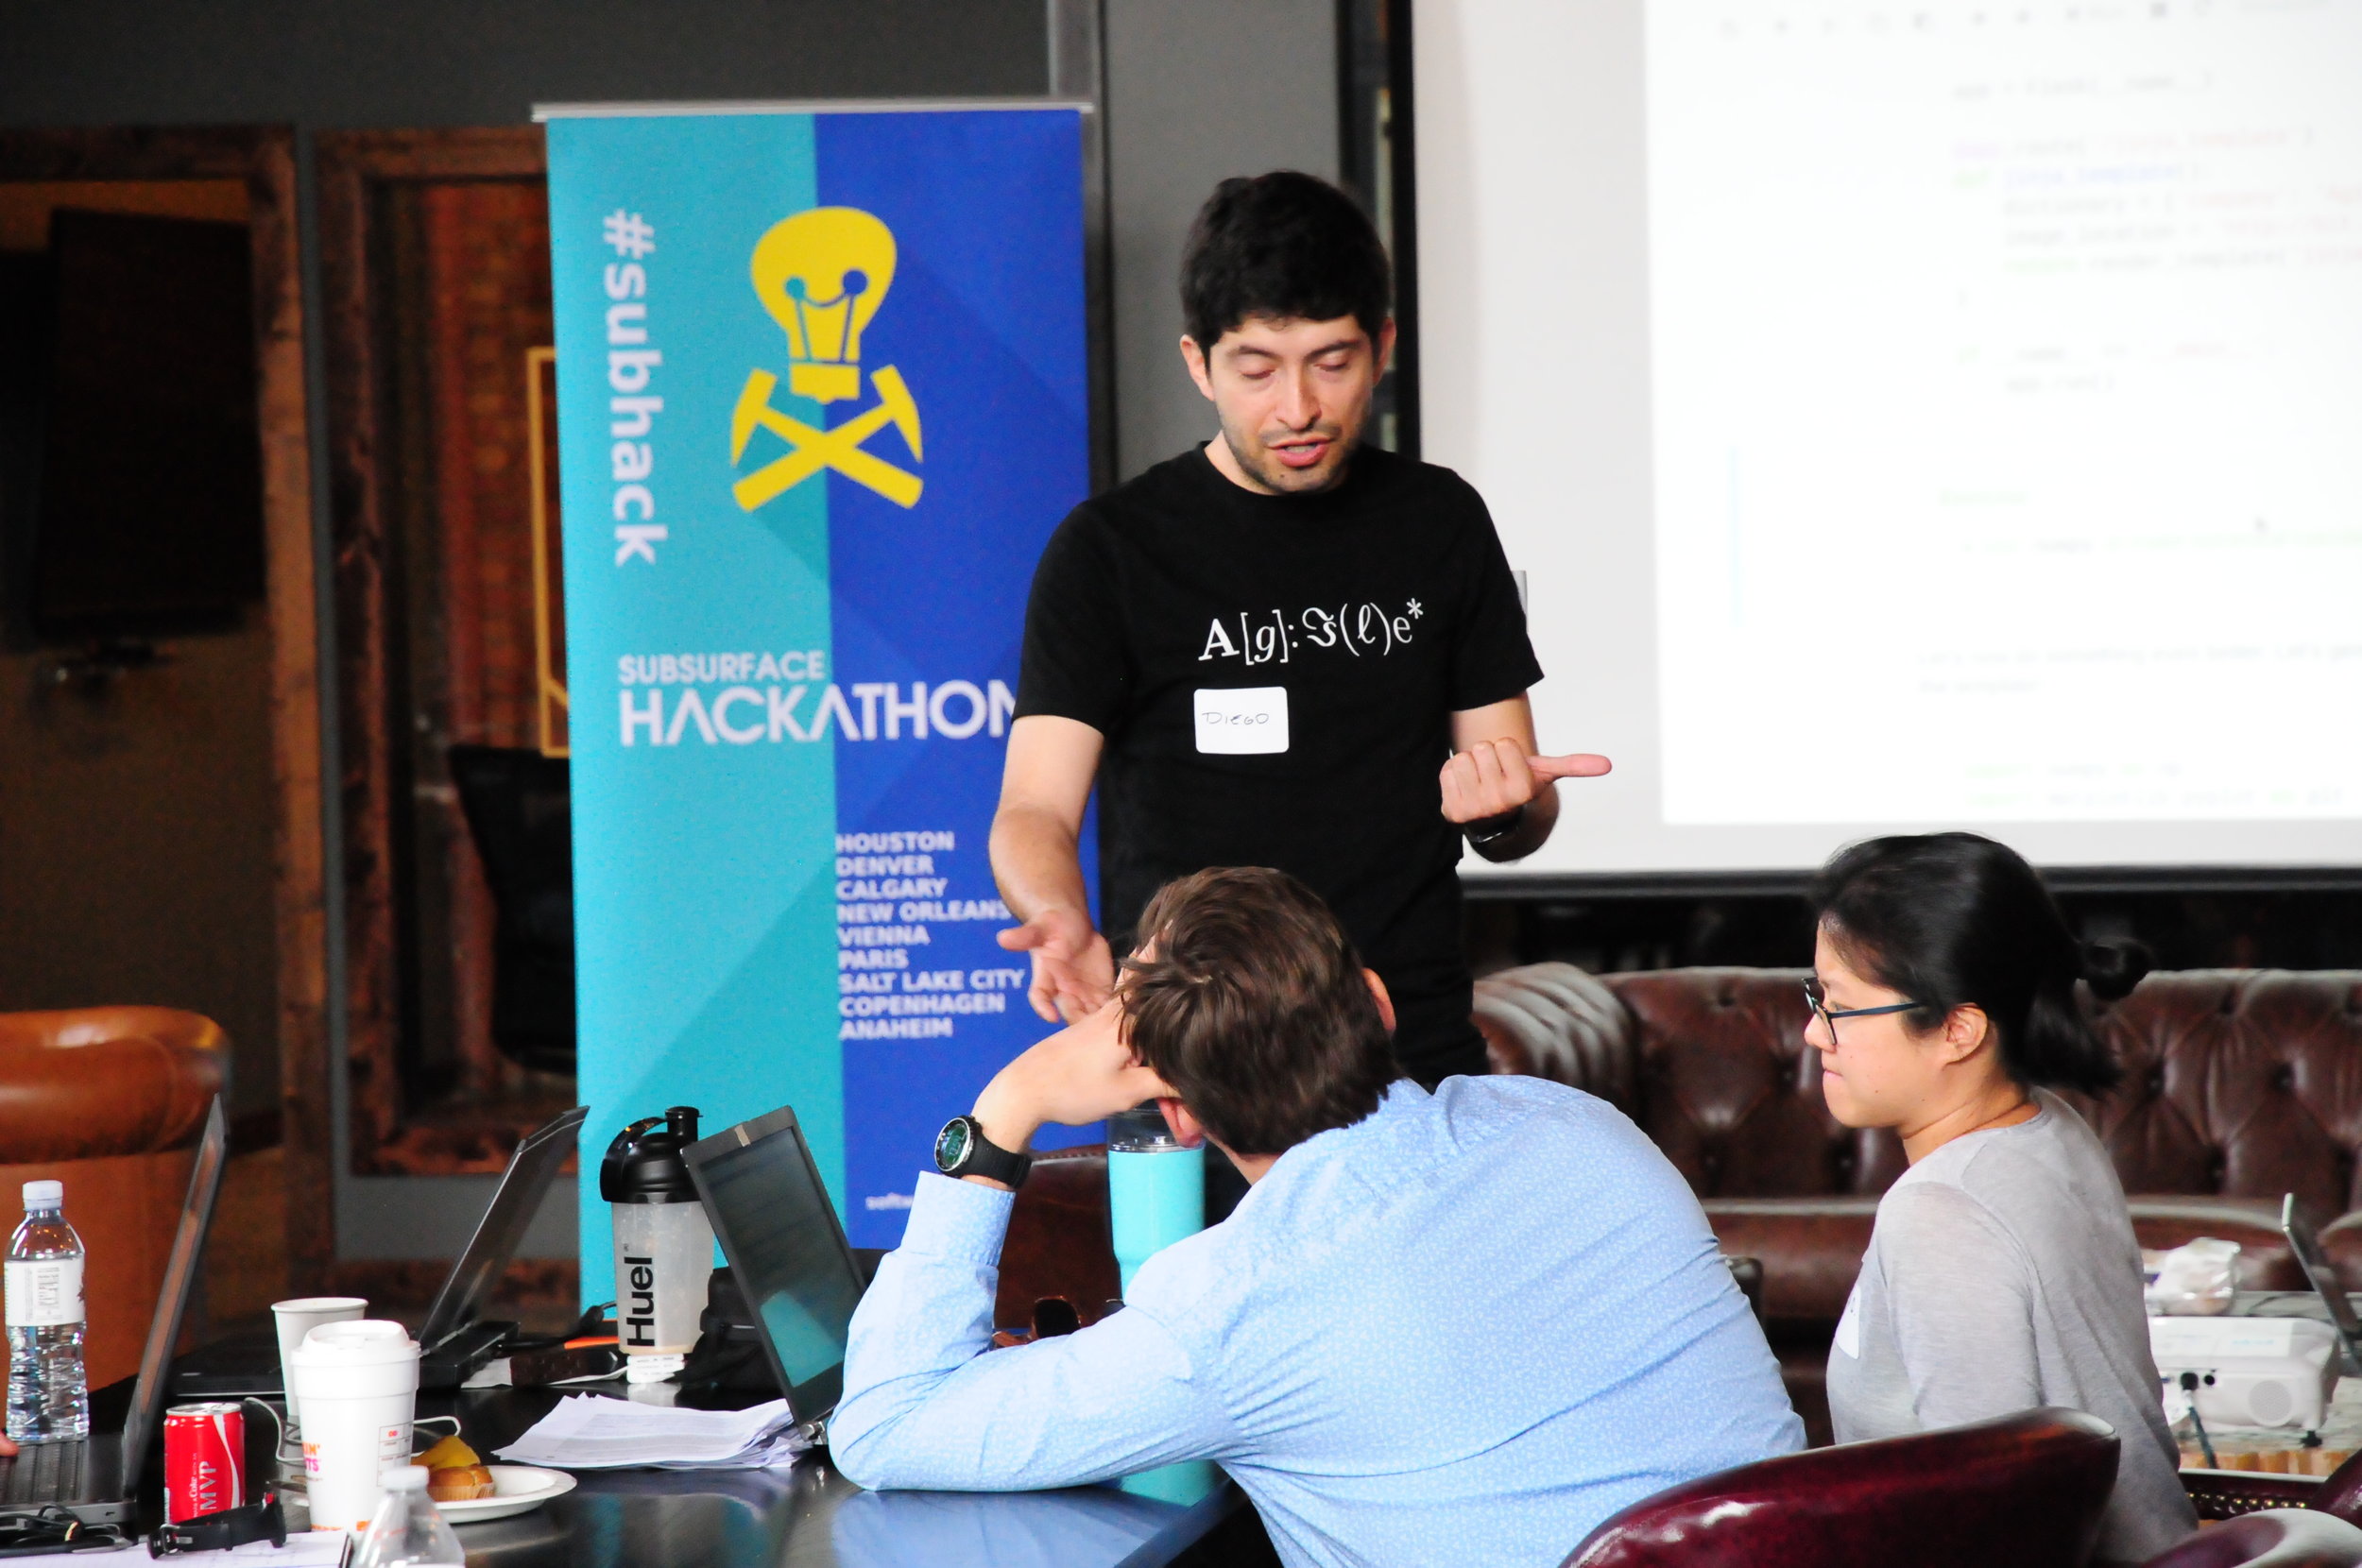
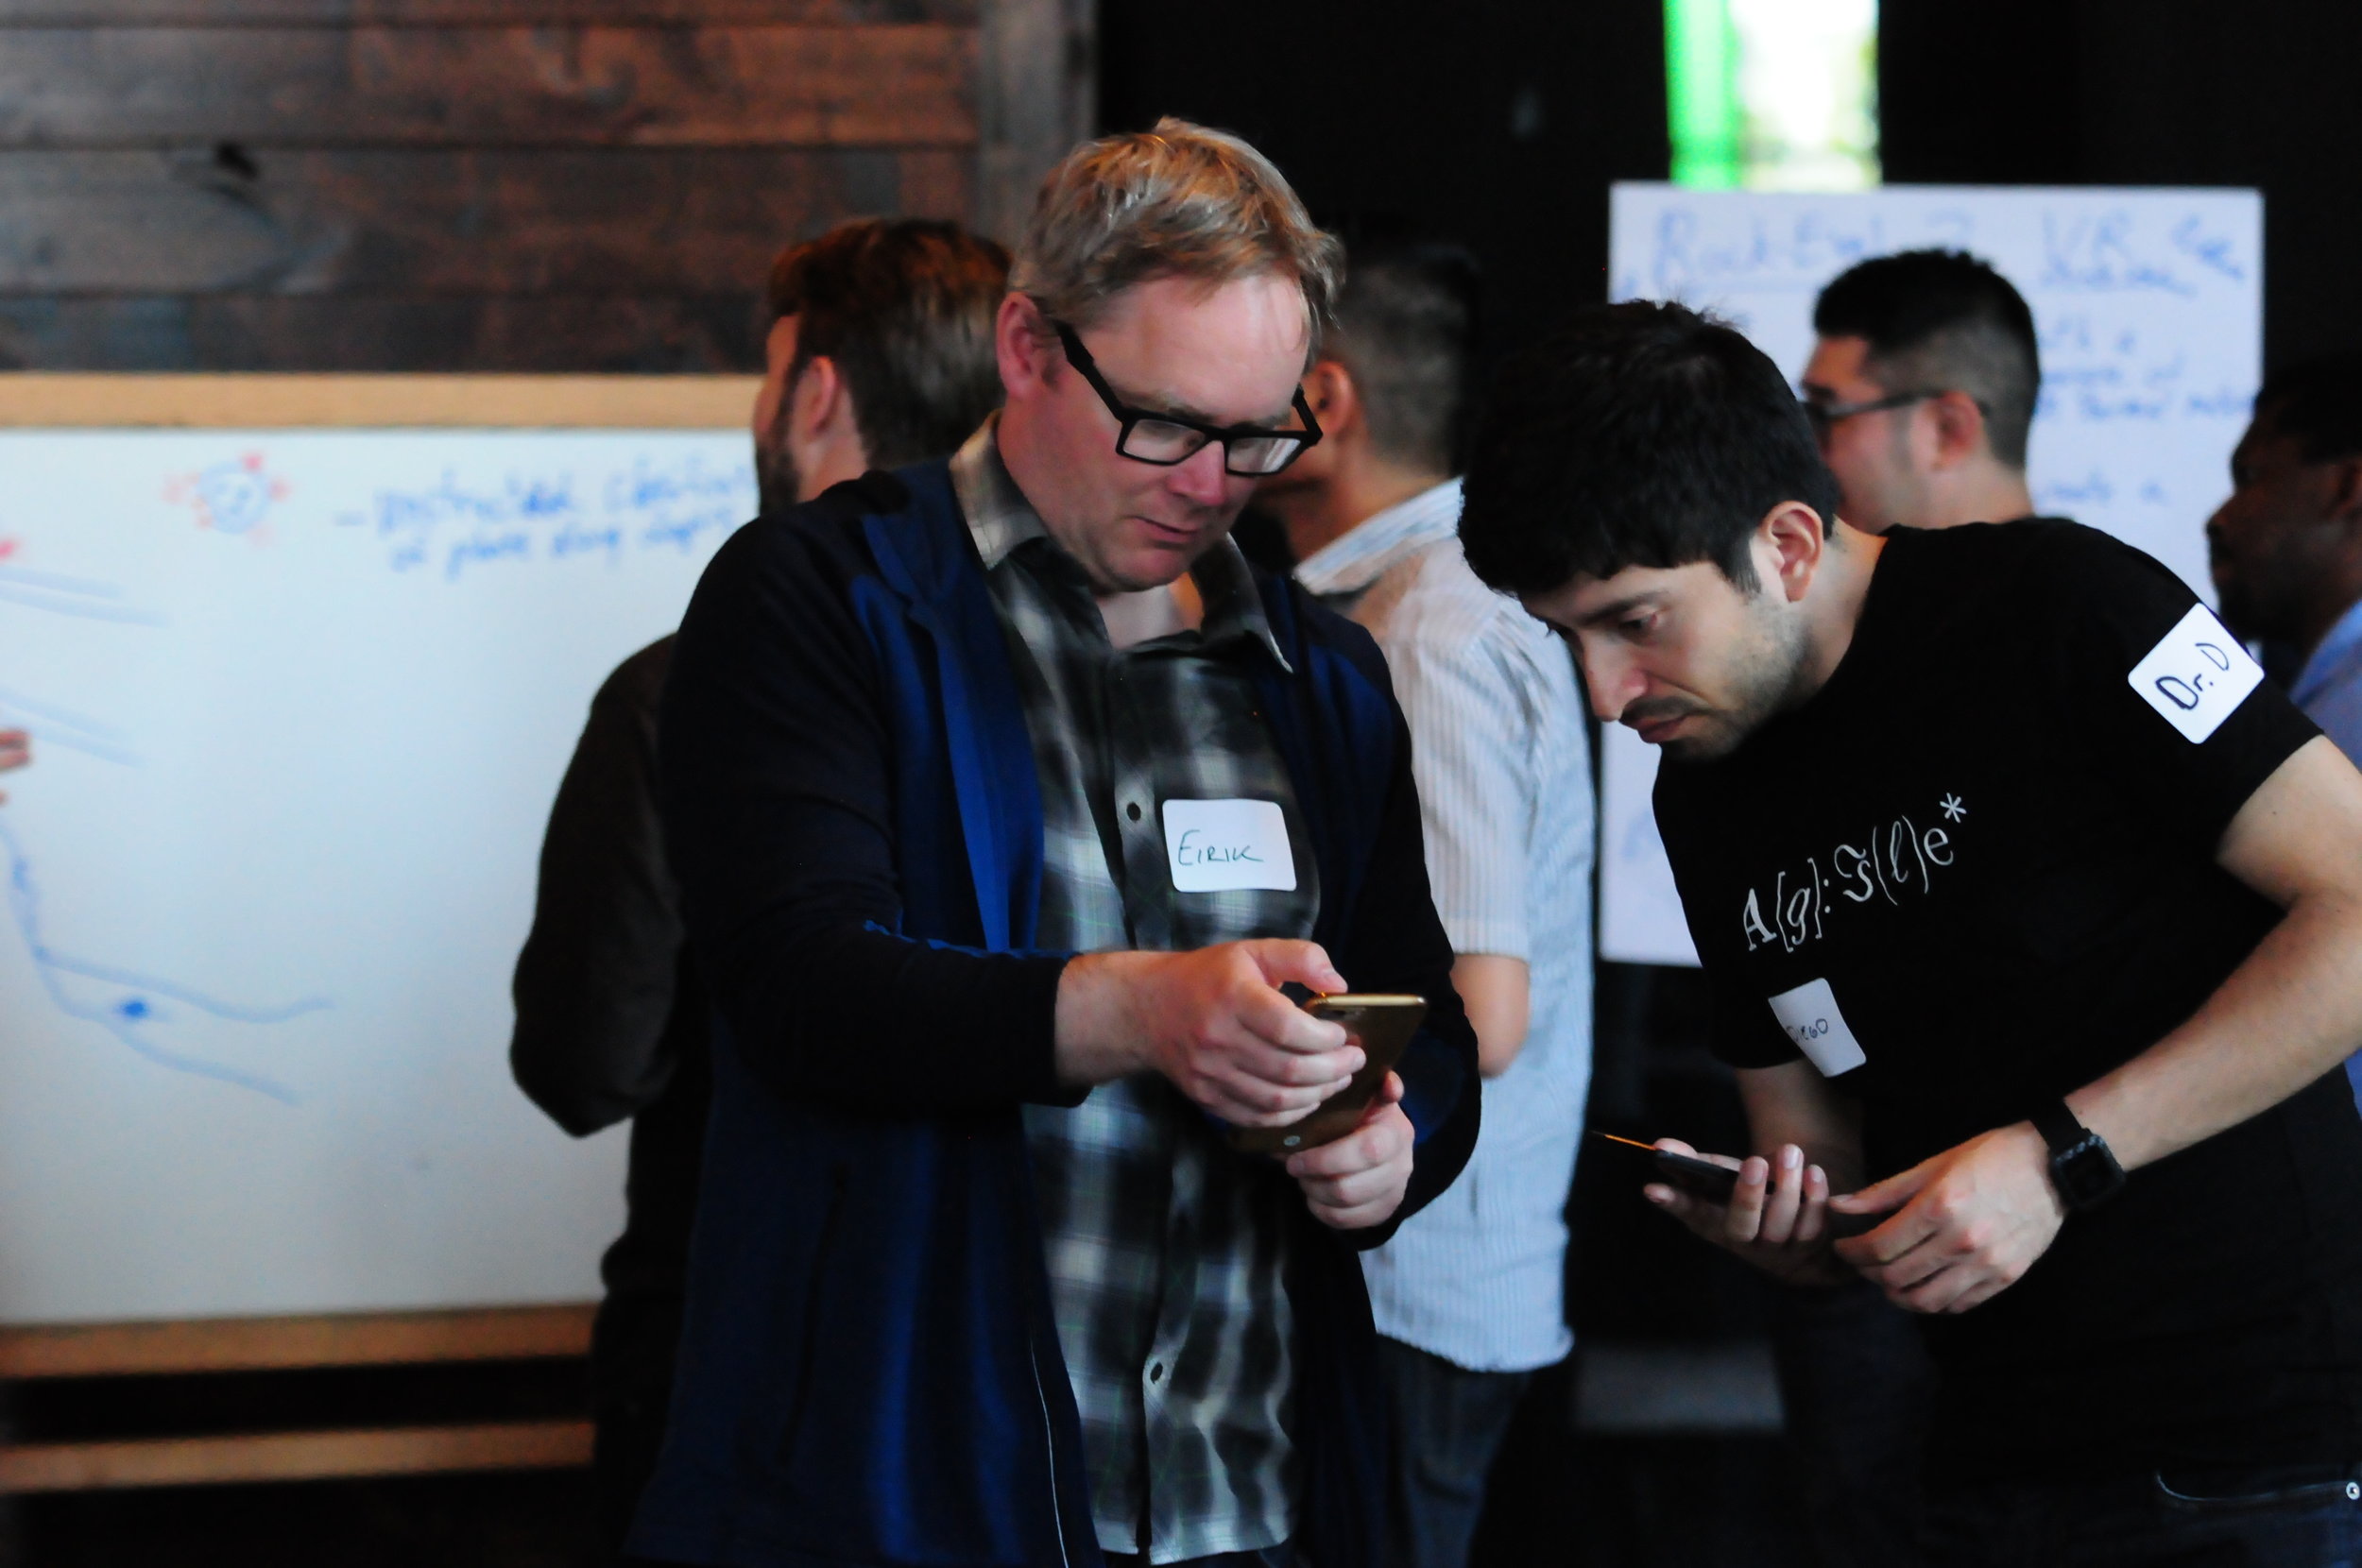
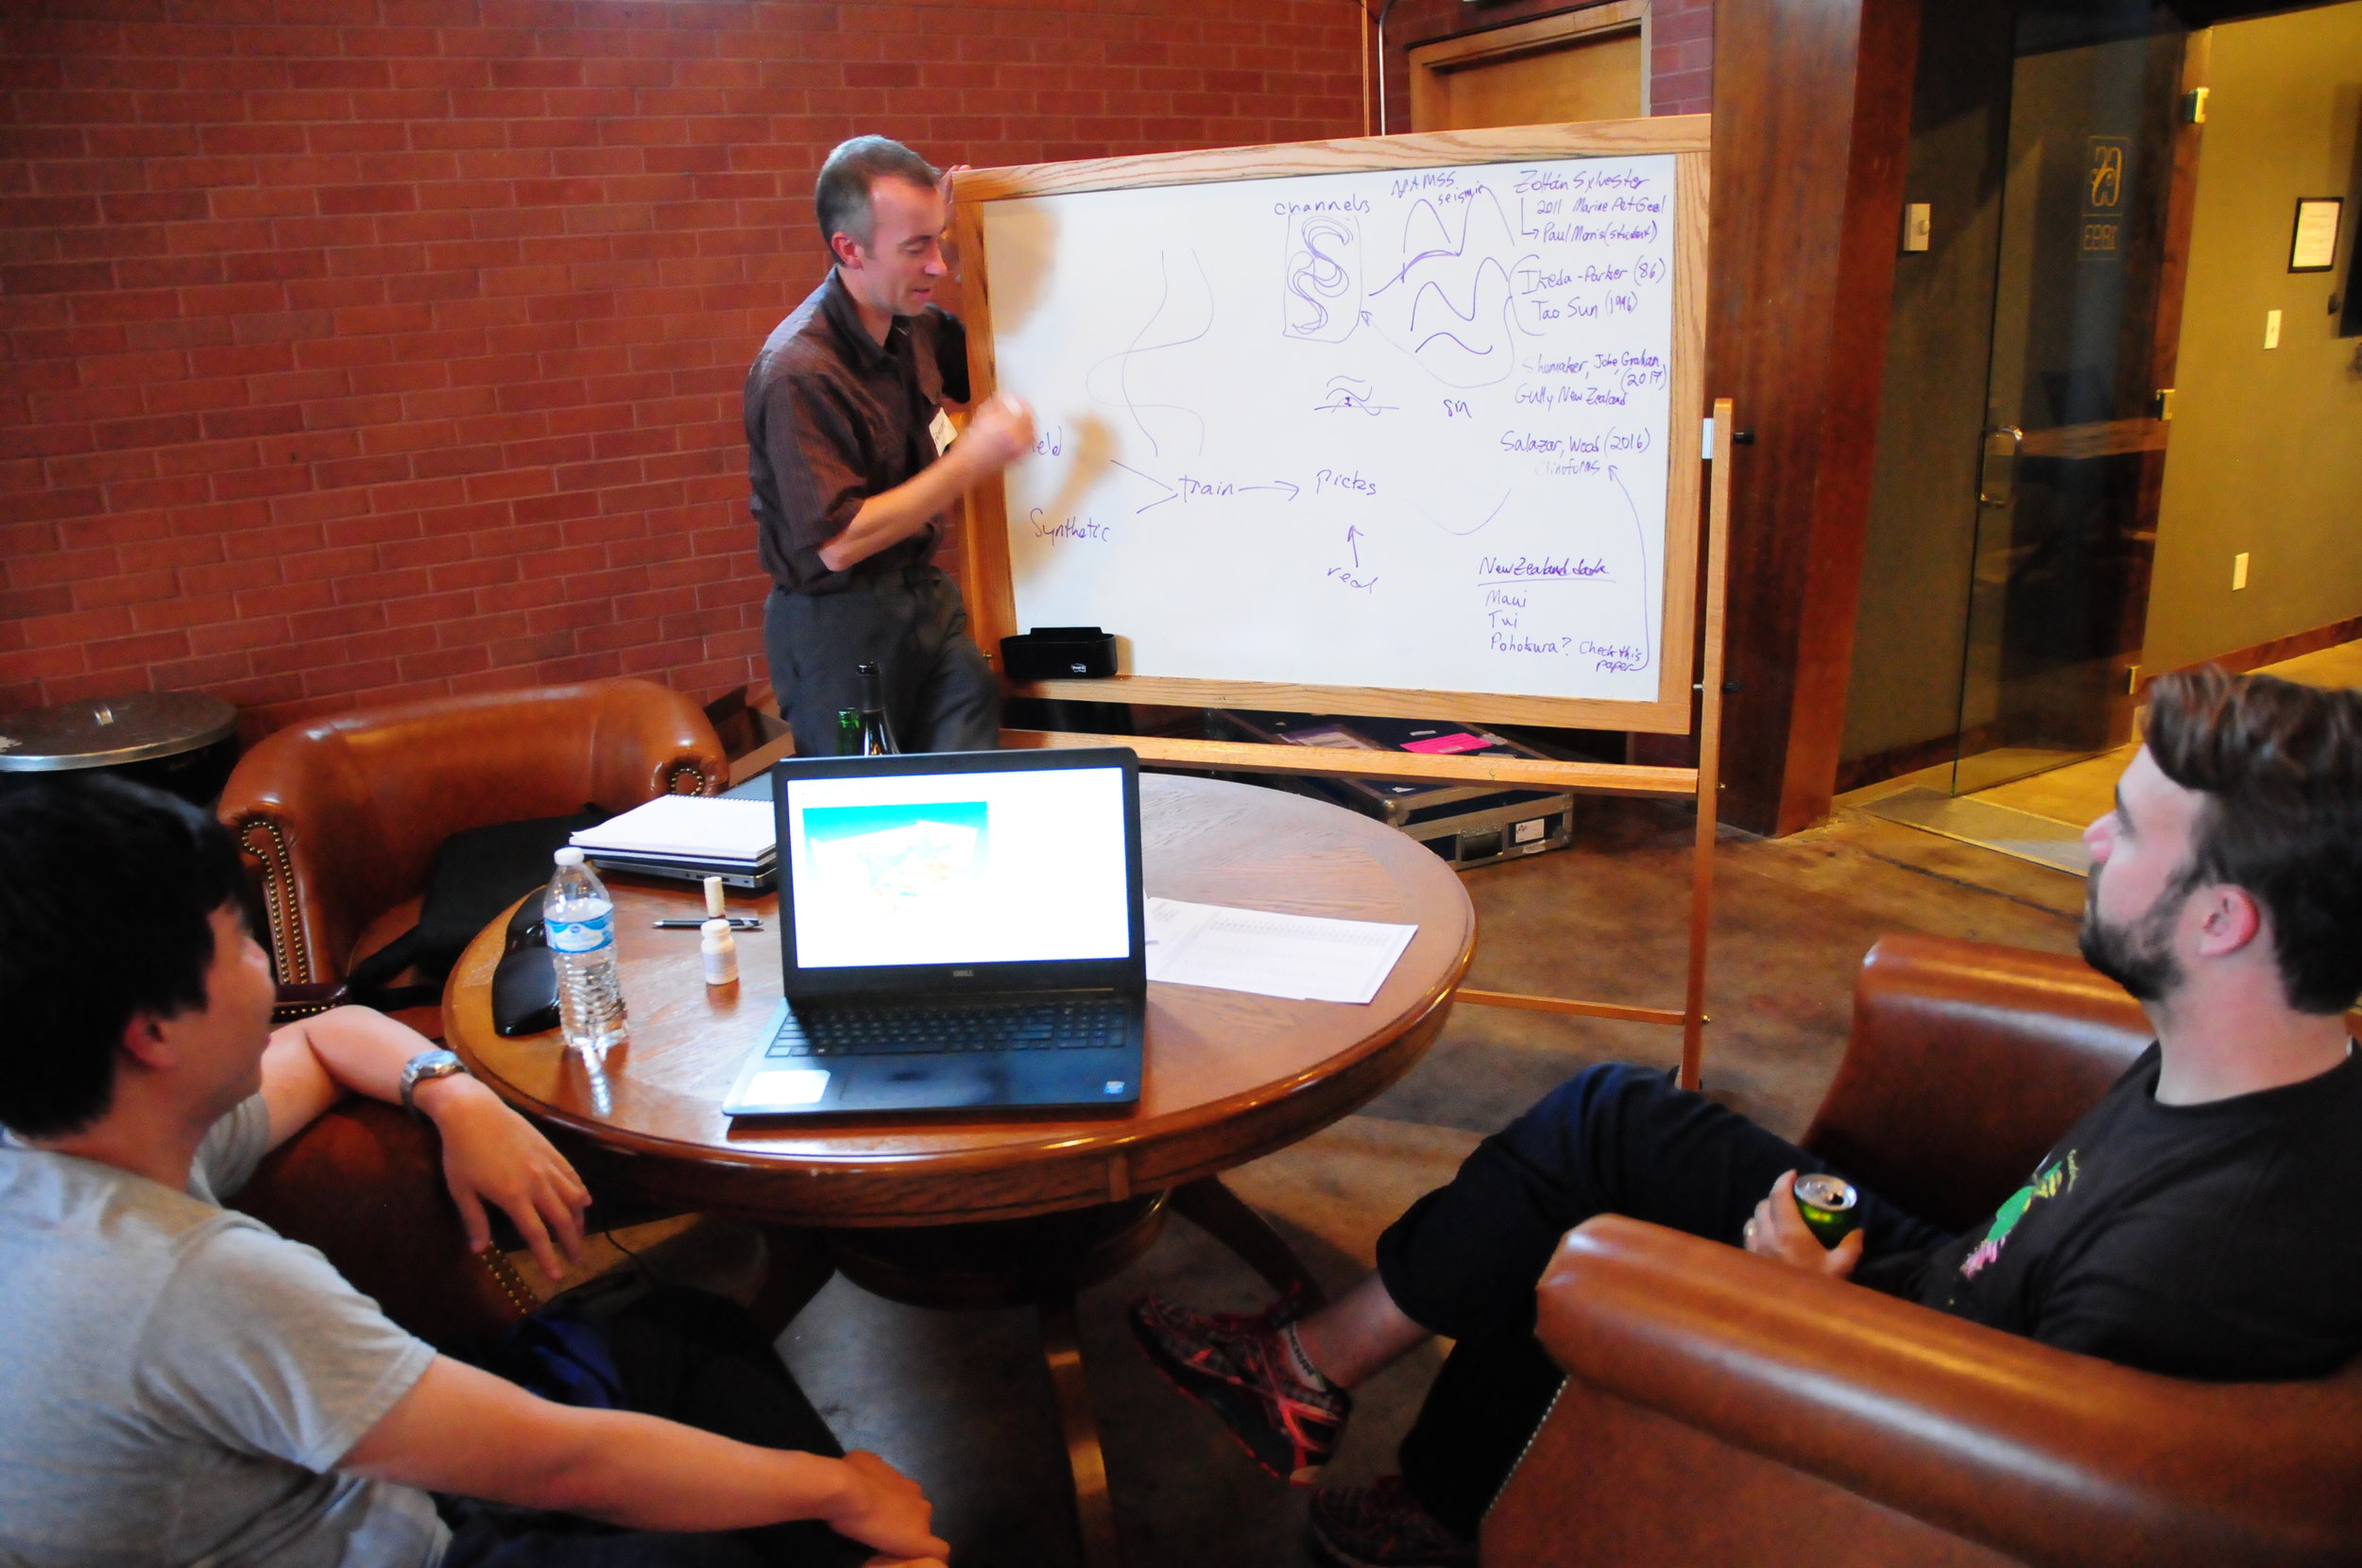
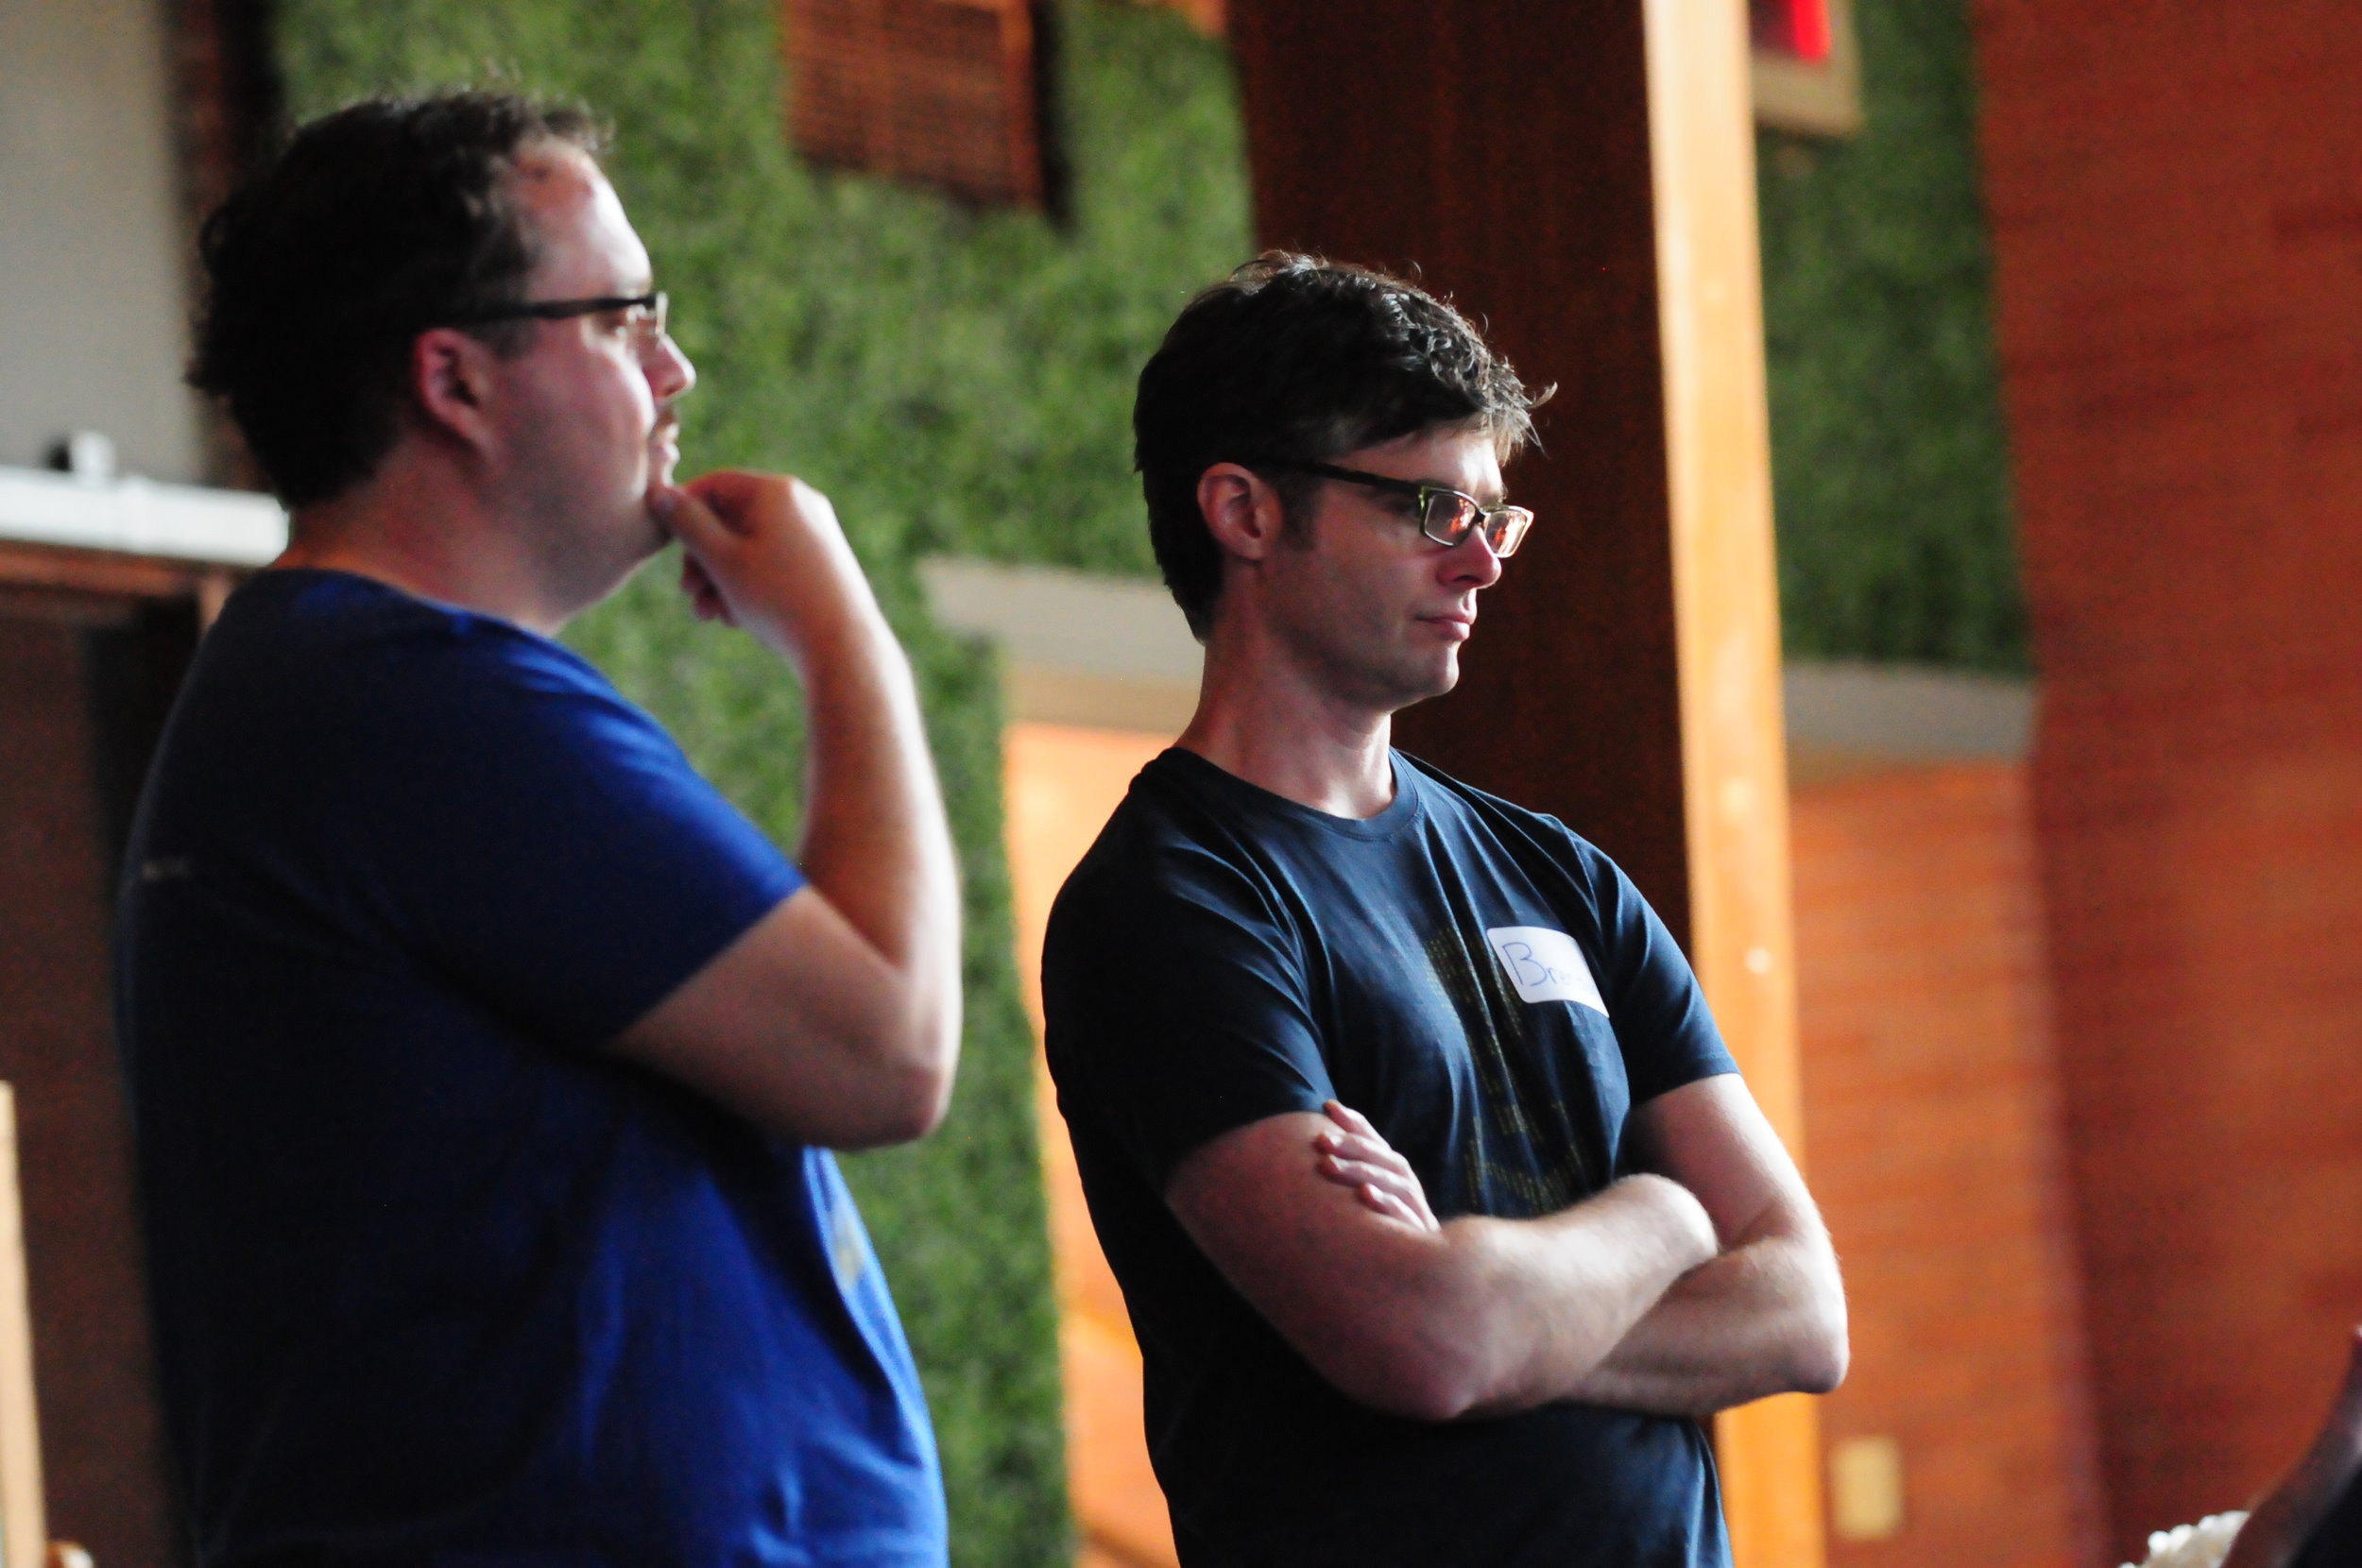
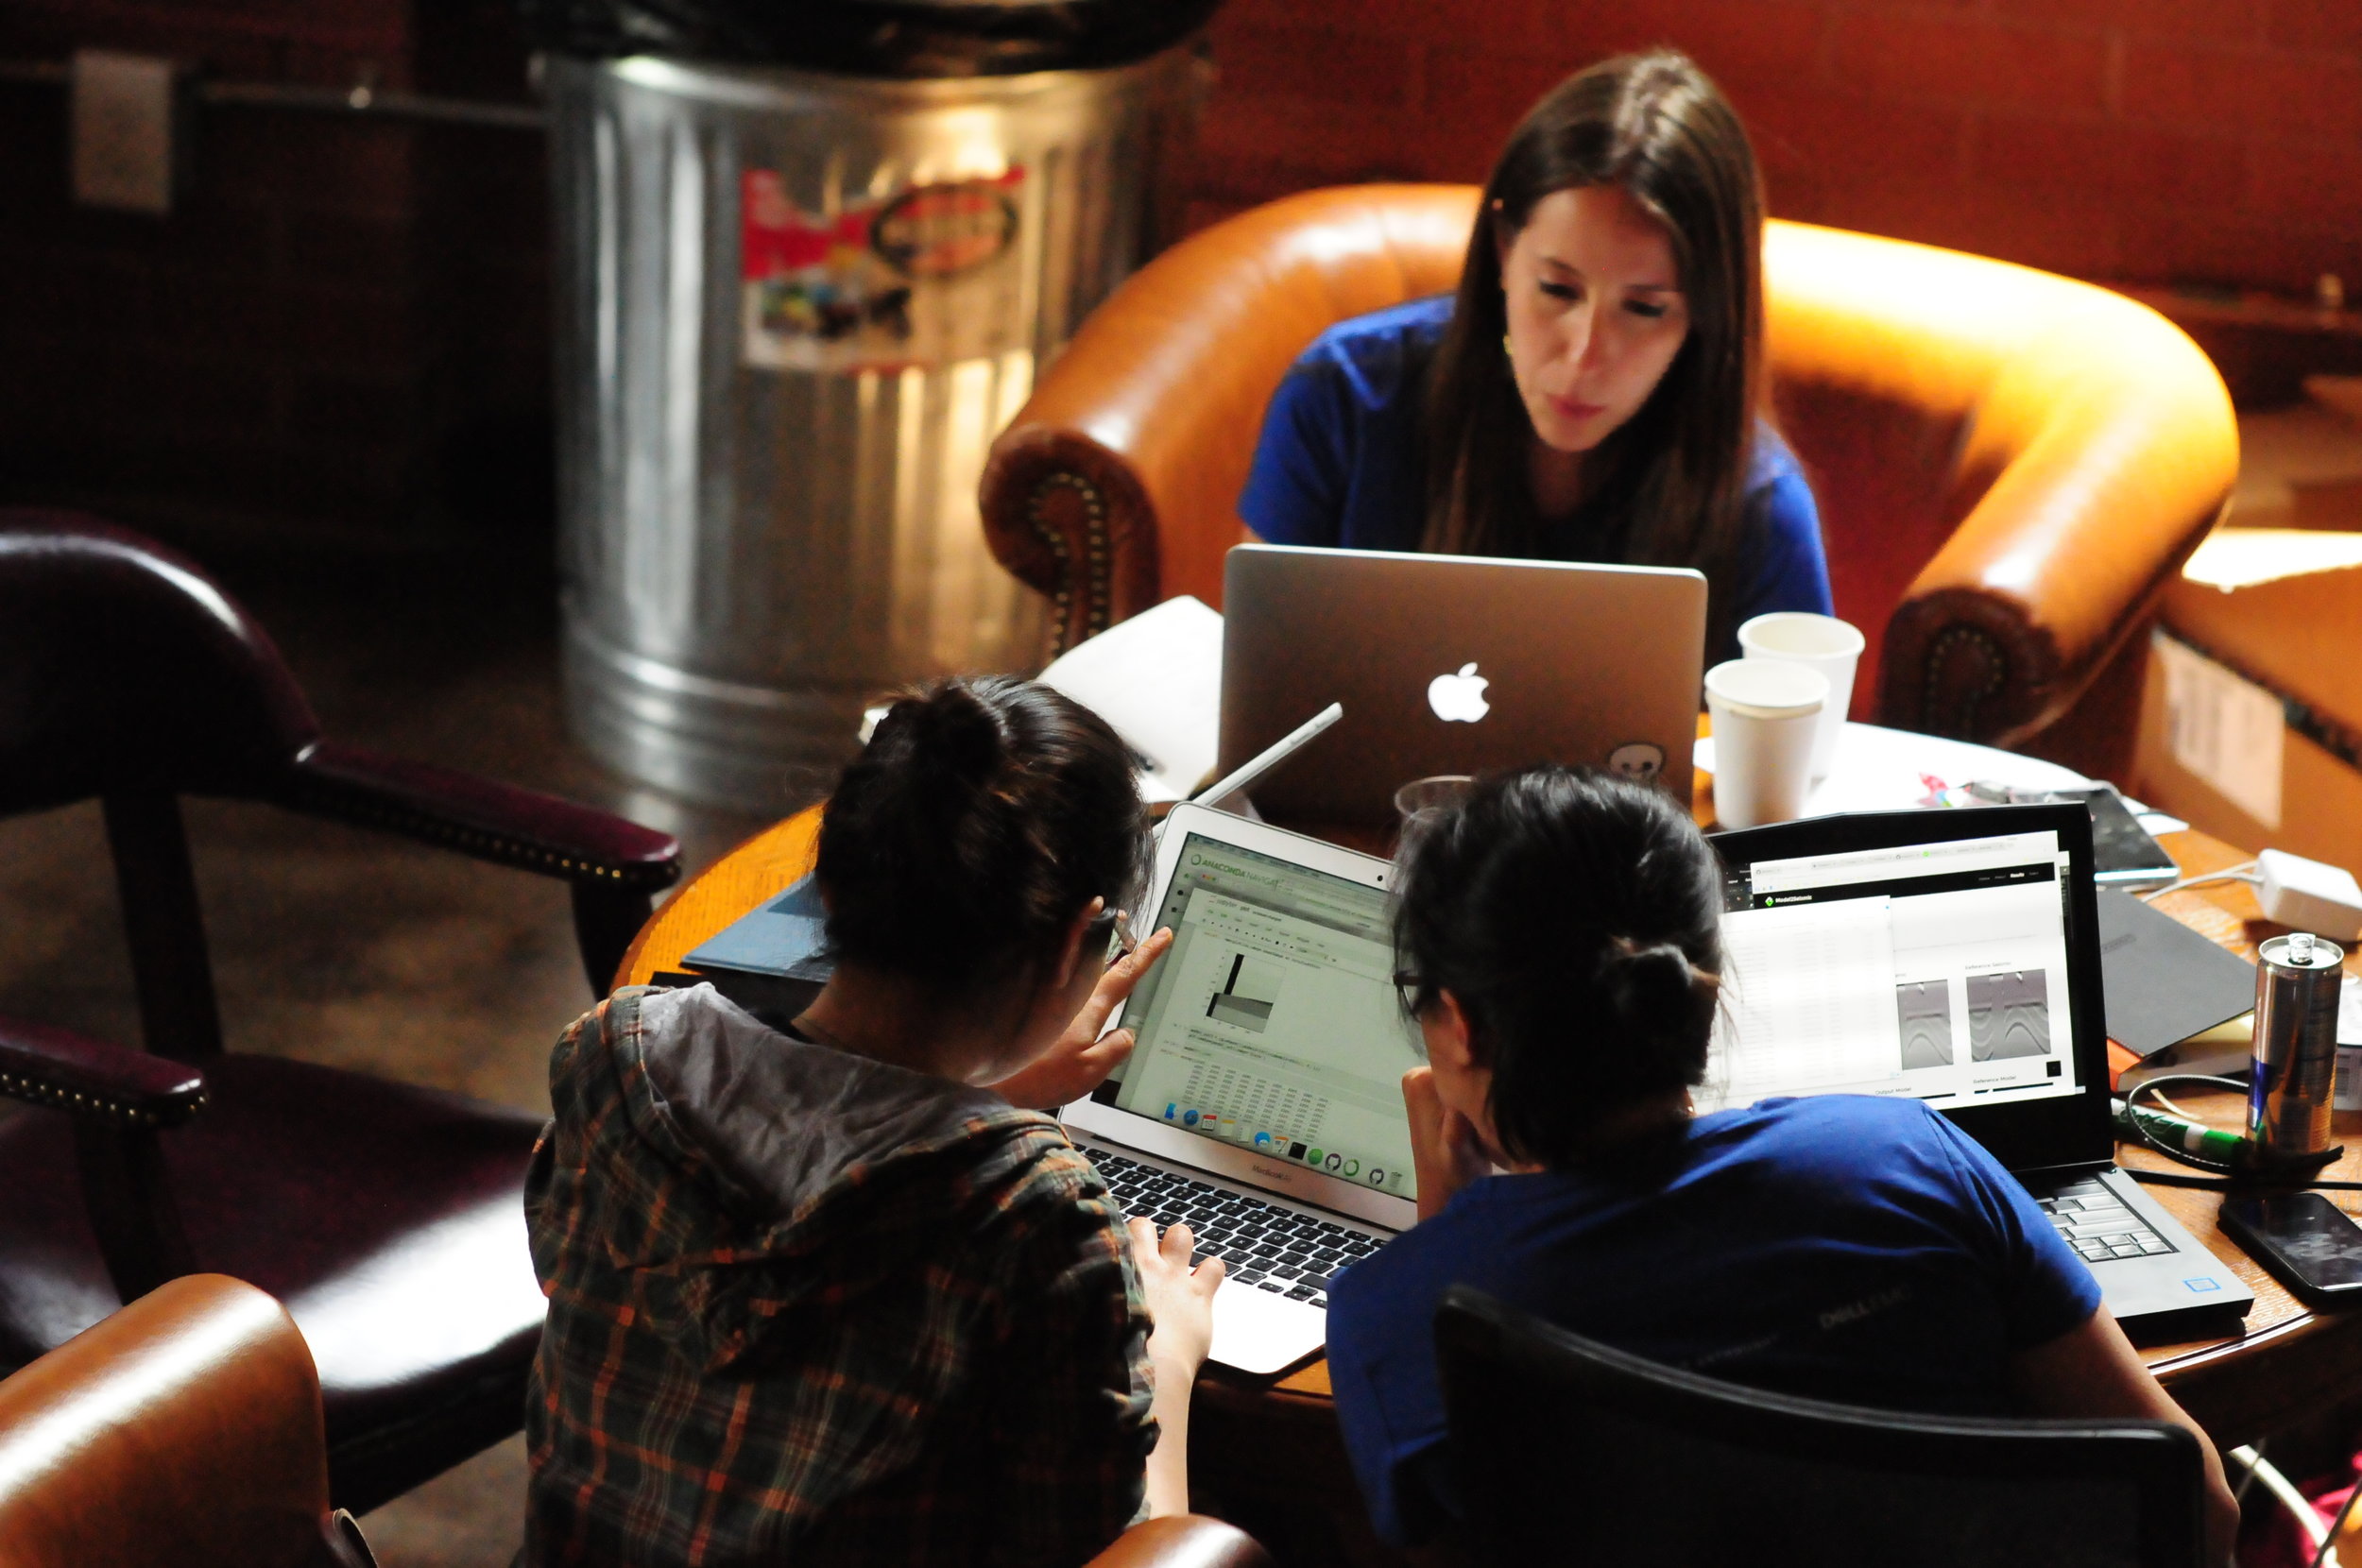
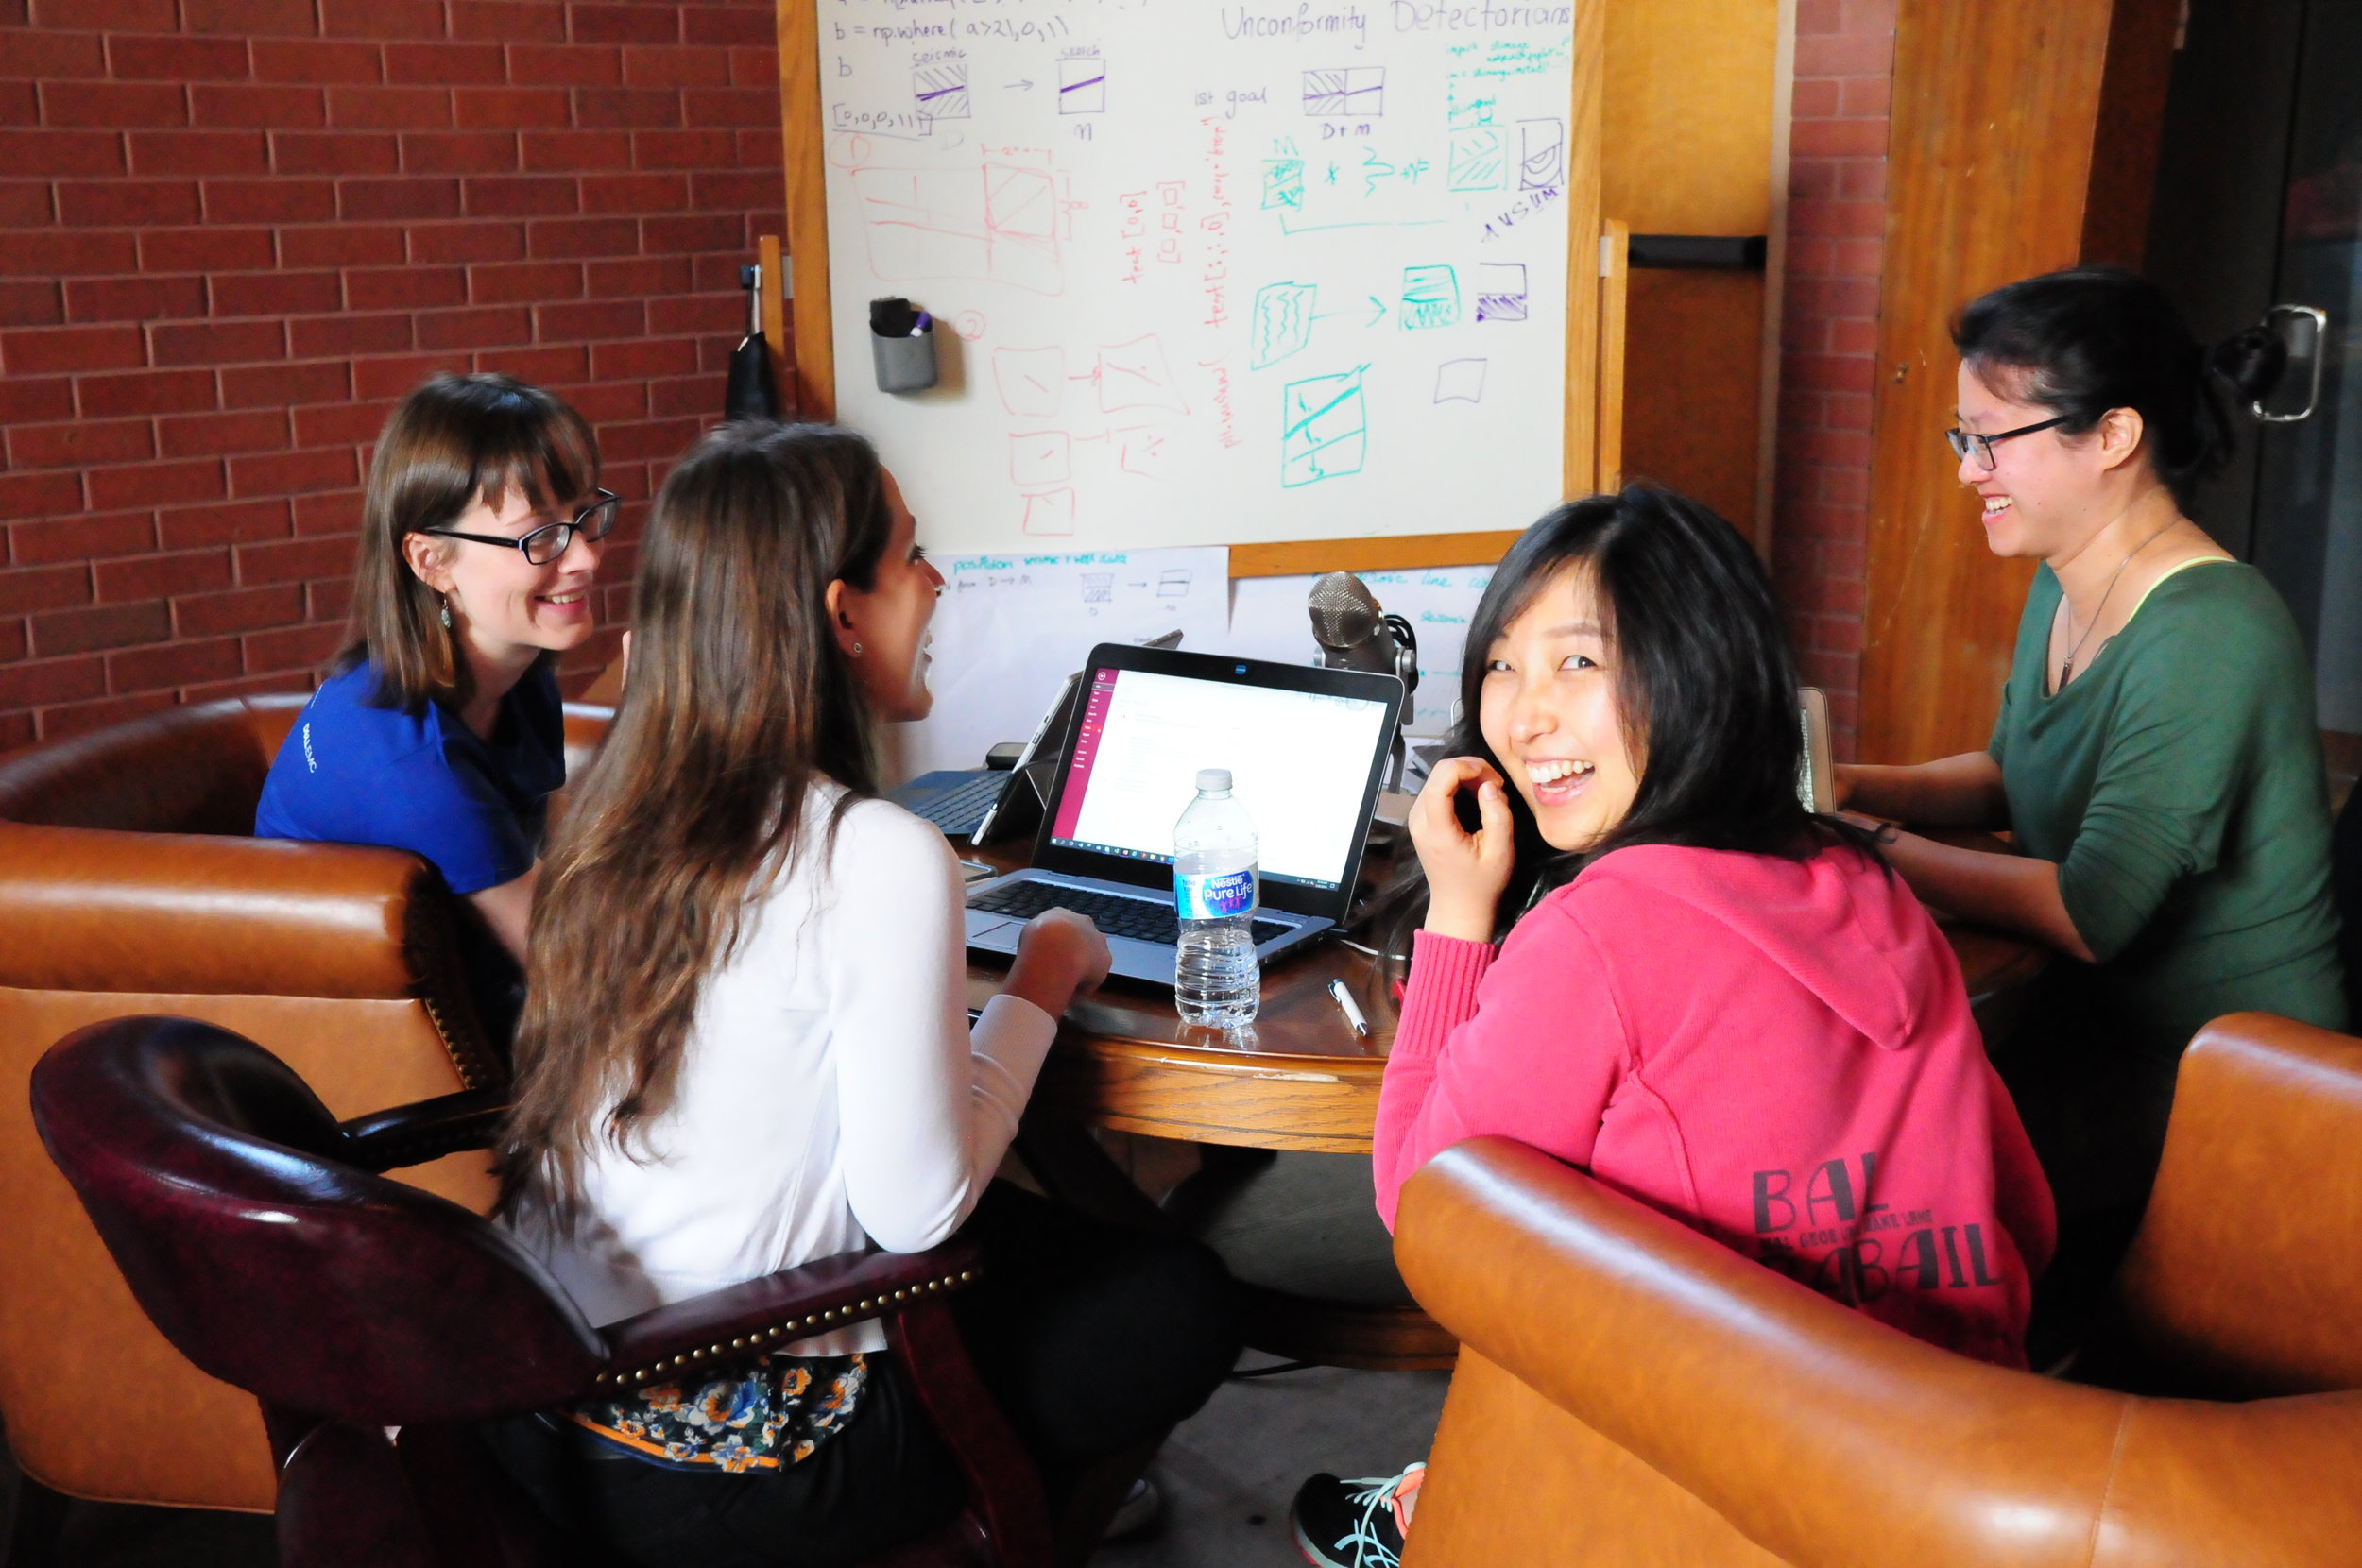
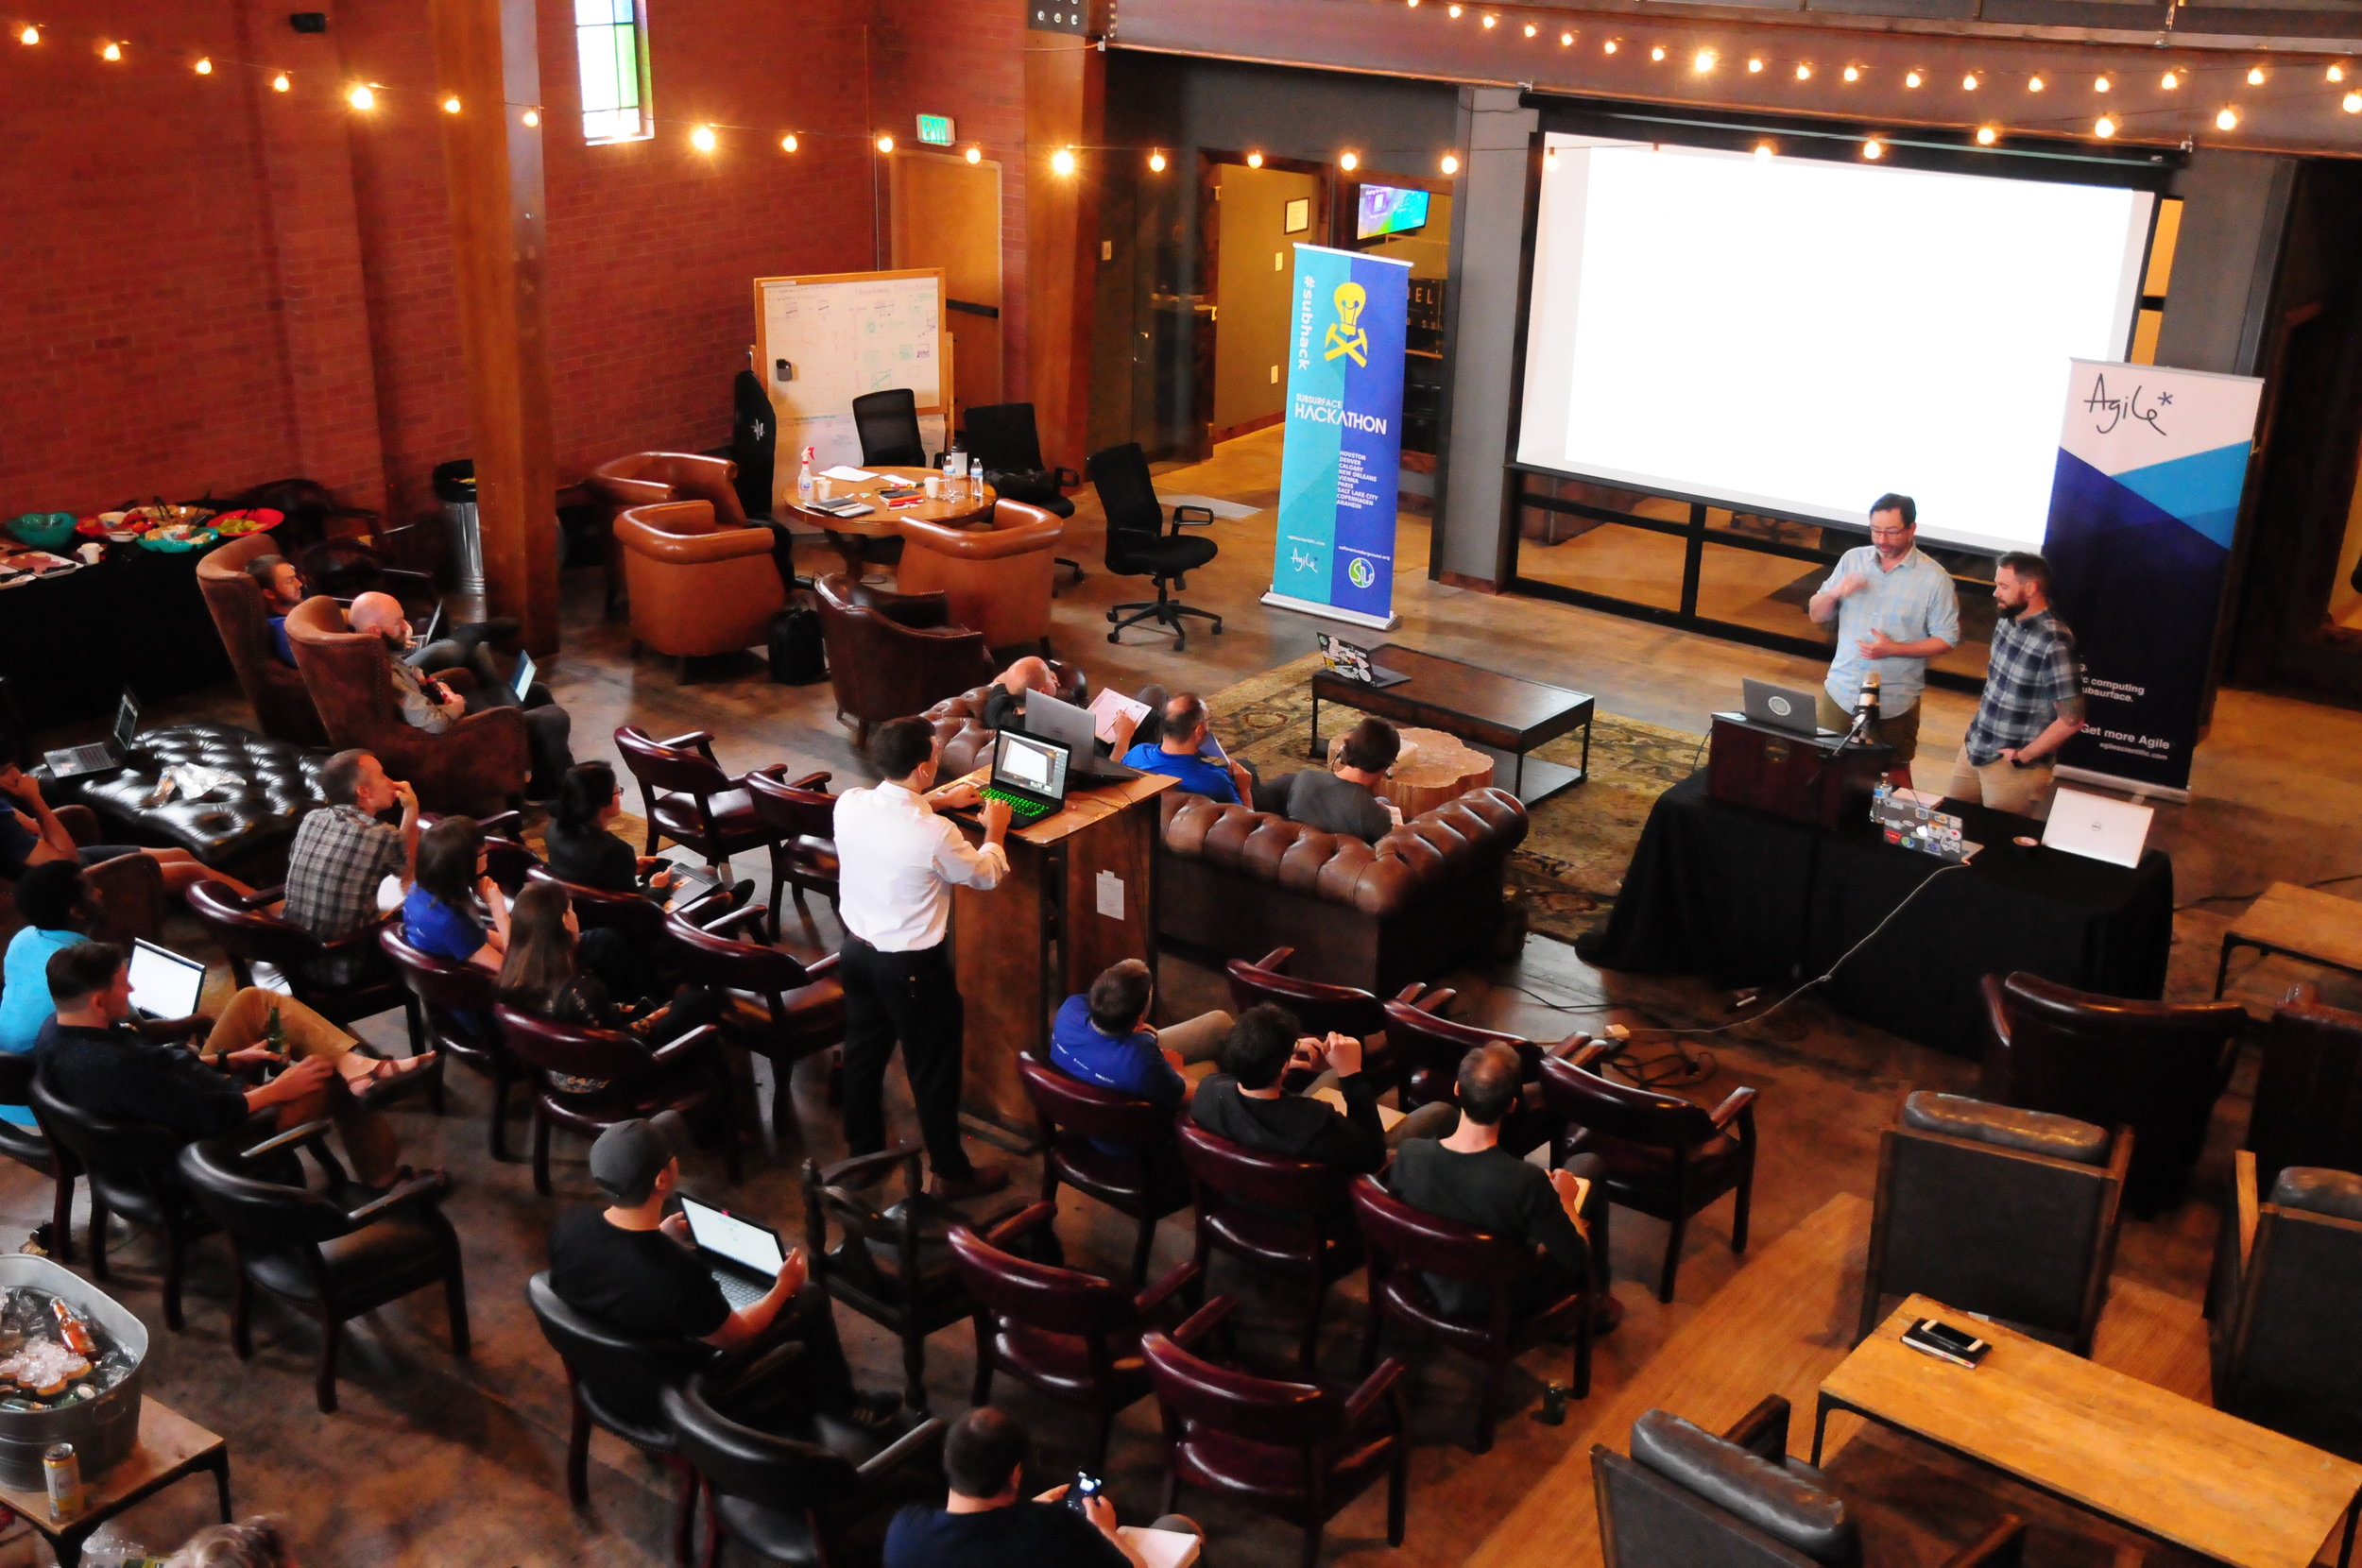
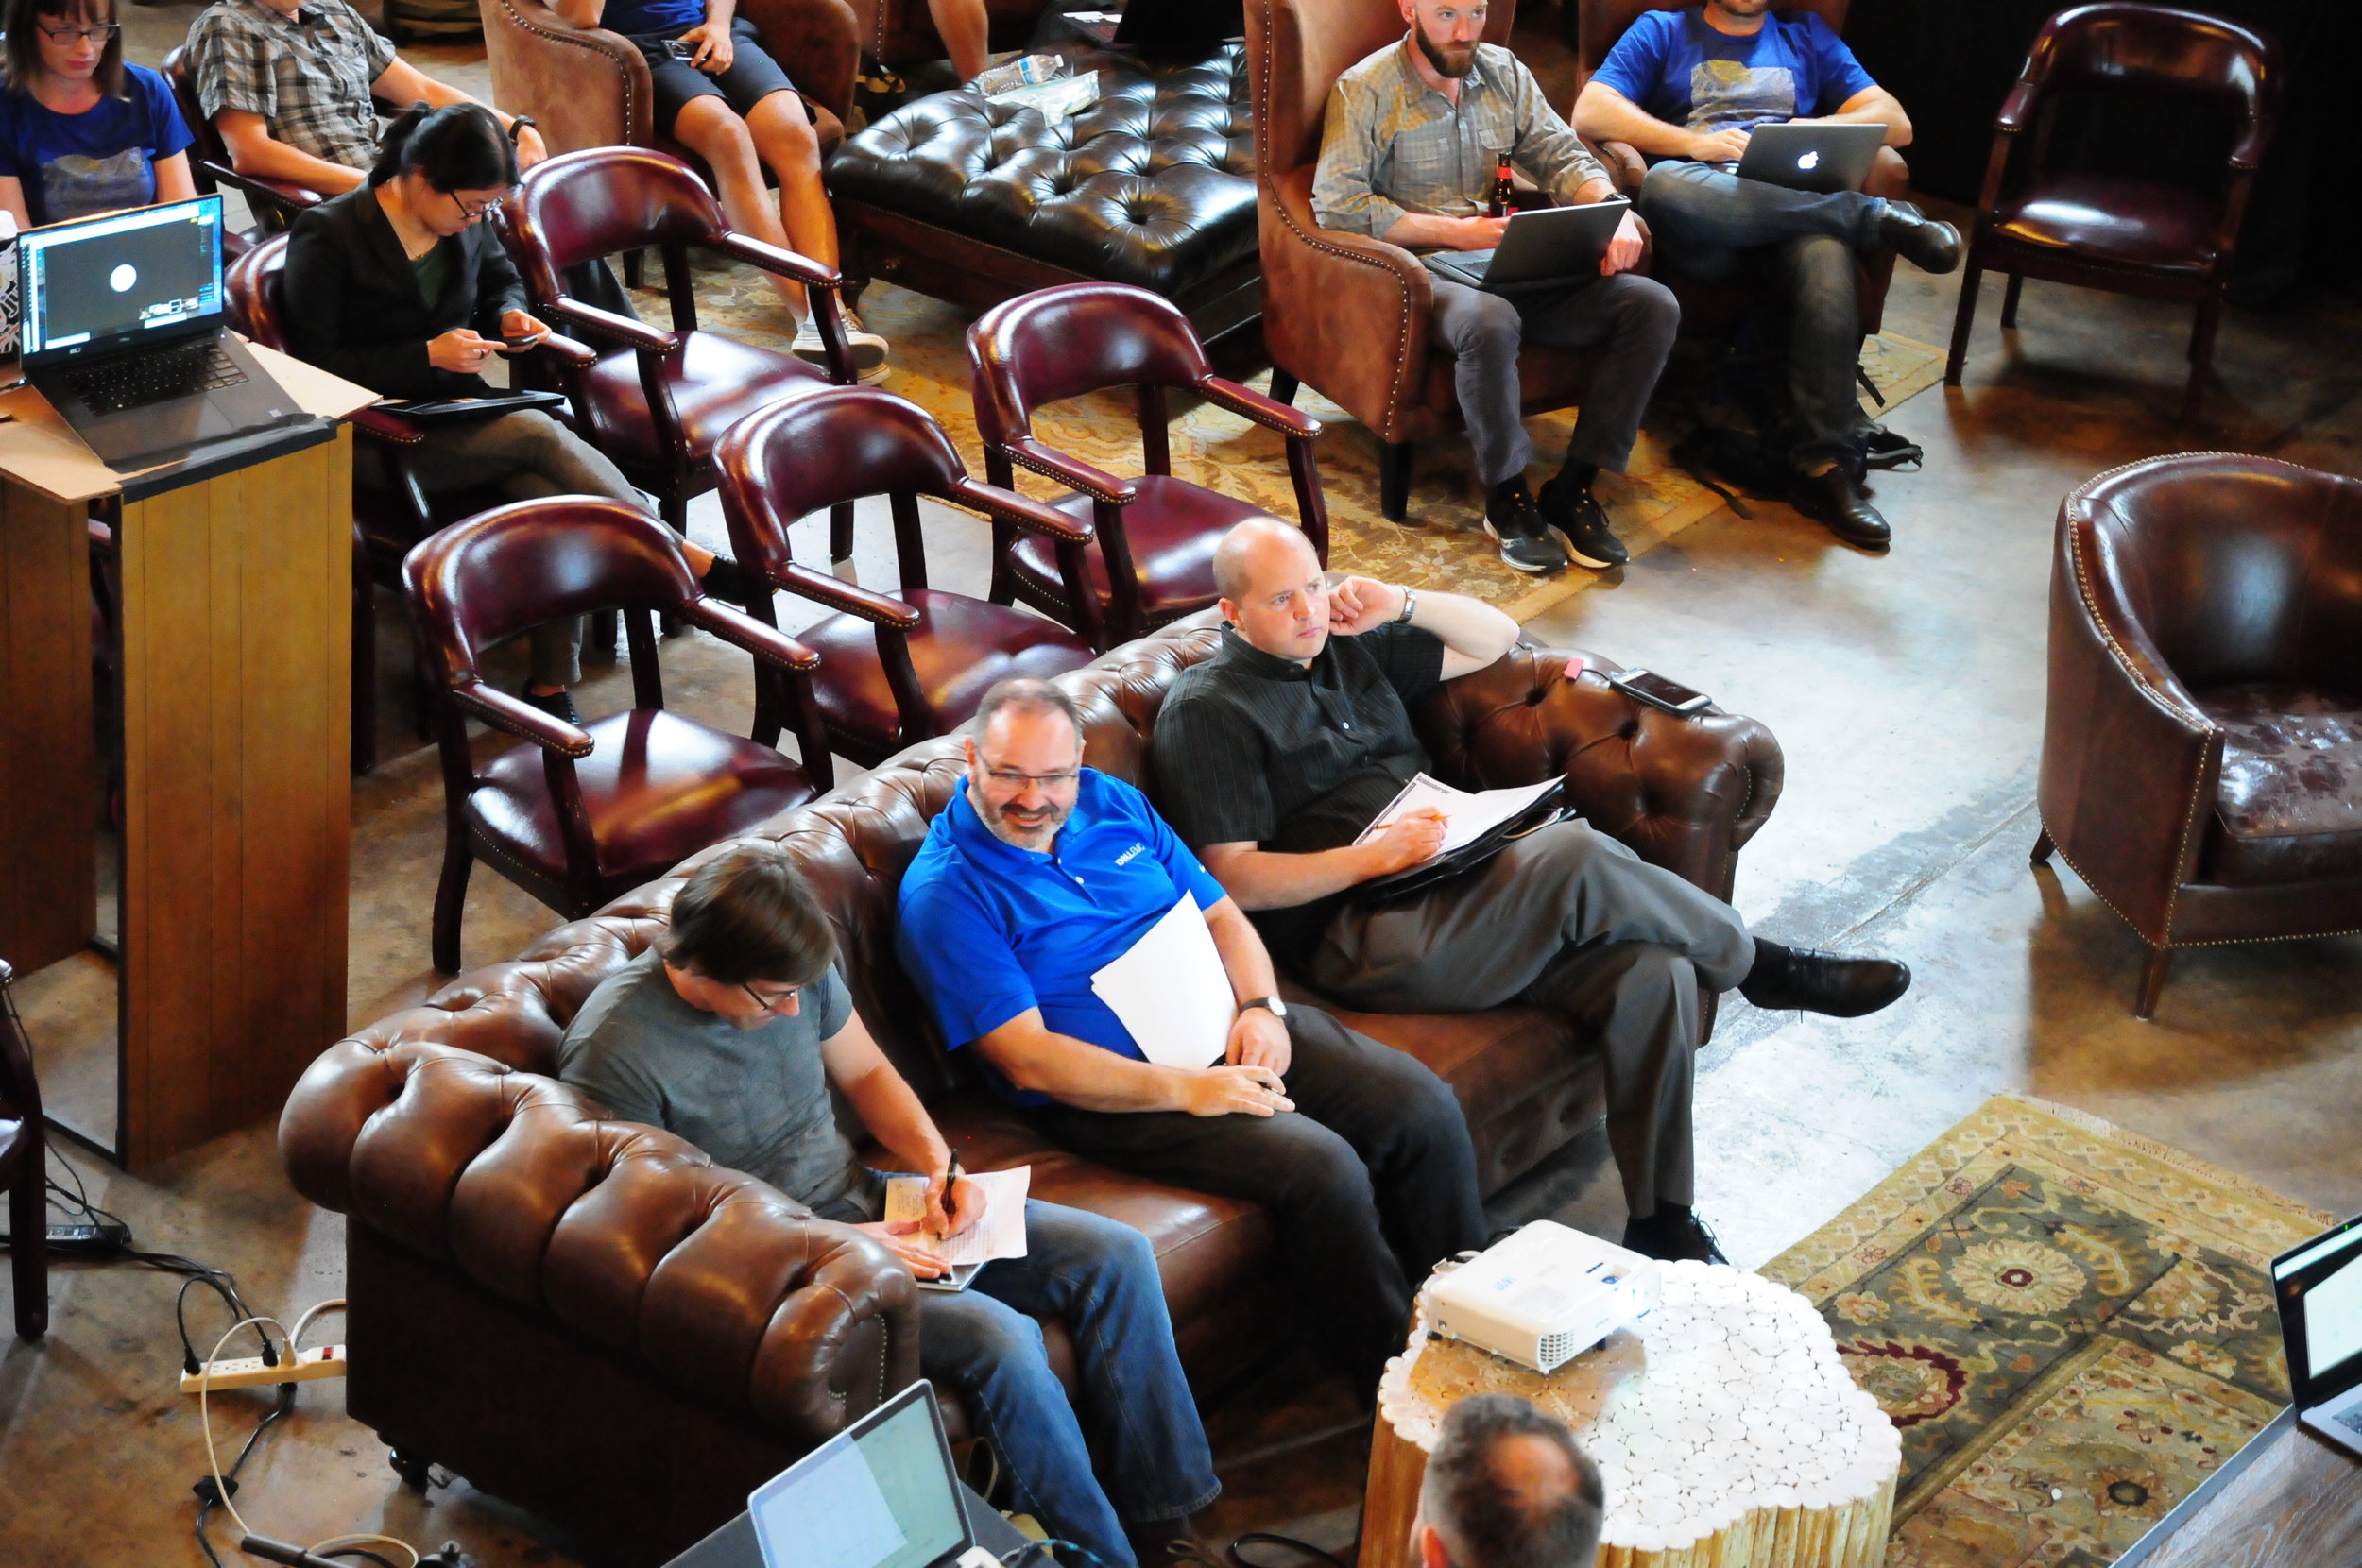
Demos from the Subsurface Hackathon. We were fortunate to have lots of hackathon participants make time for the Code Show. Graham Brew presented the uncertainty visualizer his team built; Jesper Dramsch and Lukas Mosser showed off their t-SNE experiments; Florian Smit and Steve Purves demoed their RGB explorations; and Paul Gabriel shared the GiGa Infosystems projects in AR and 3D web visualization. Many thanks to those folks and their teams.
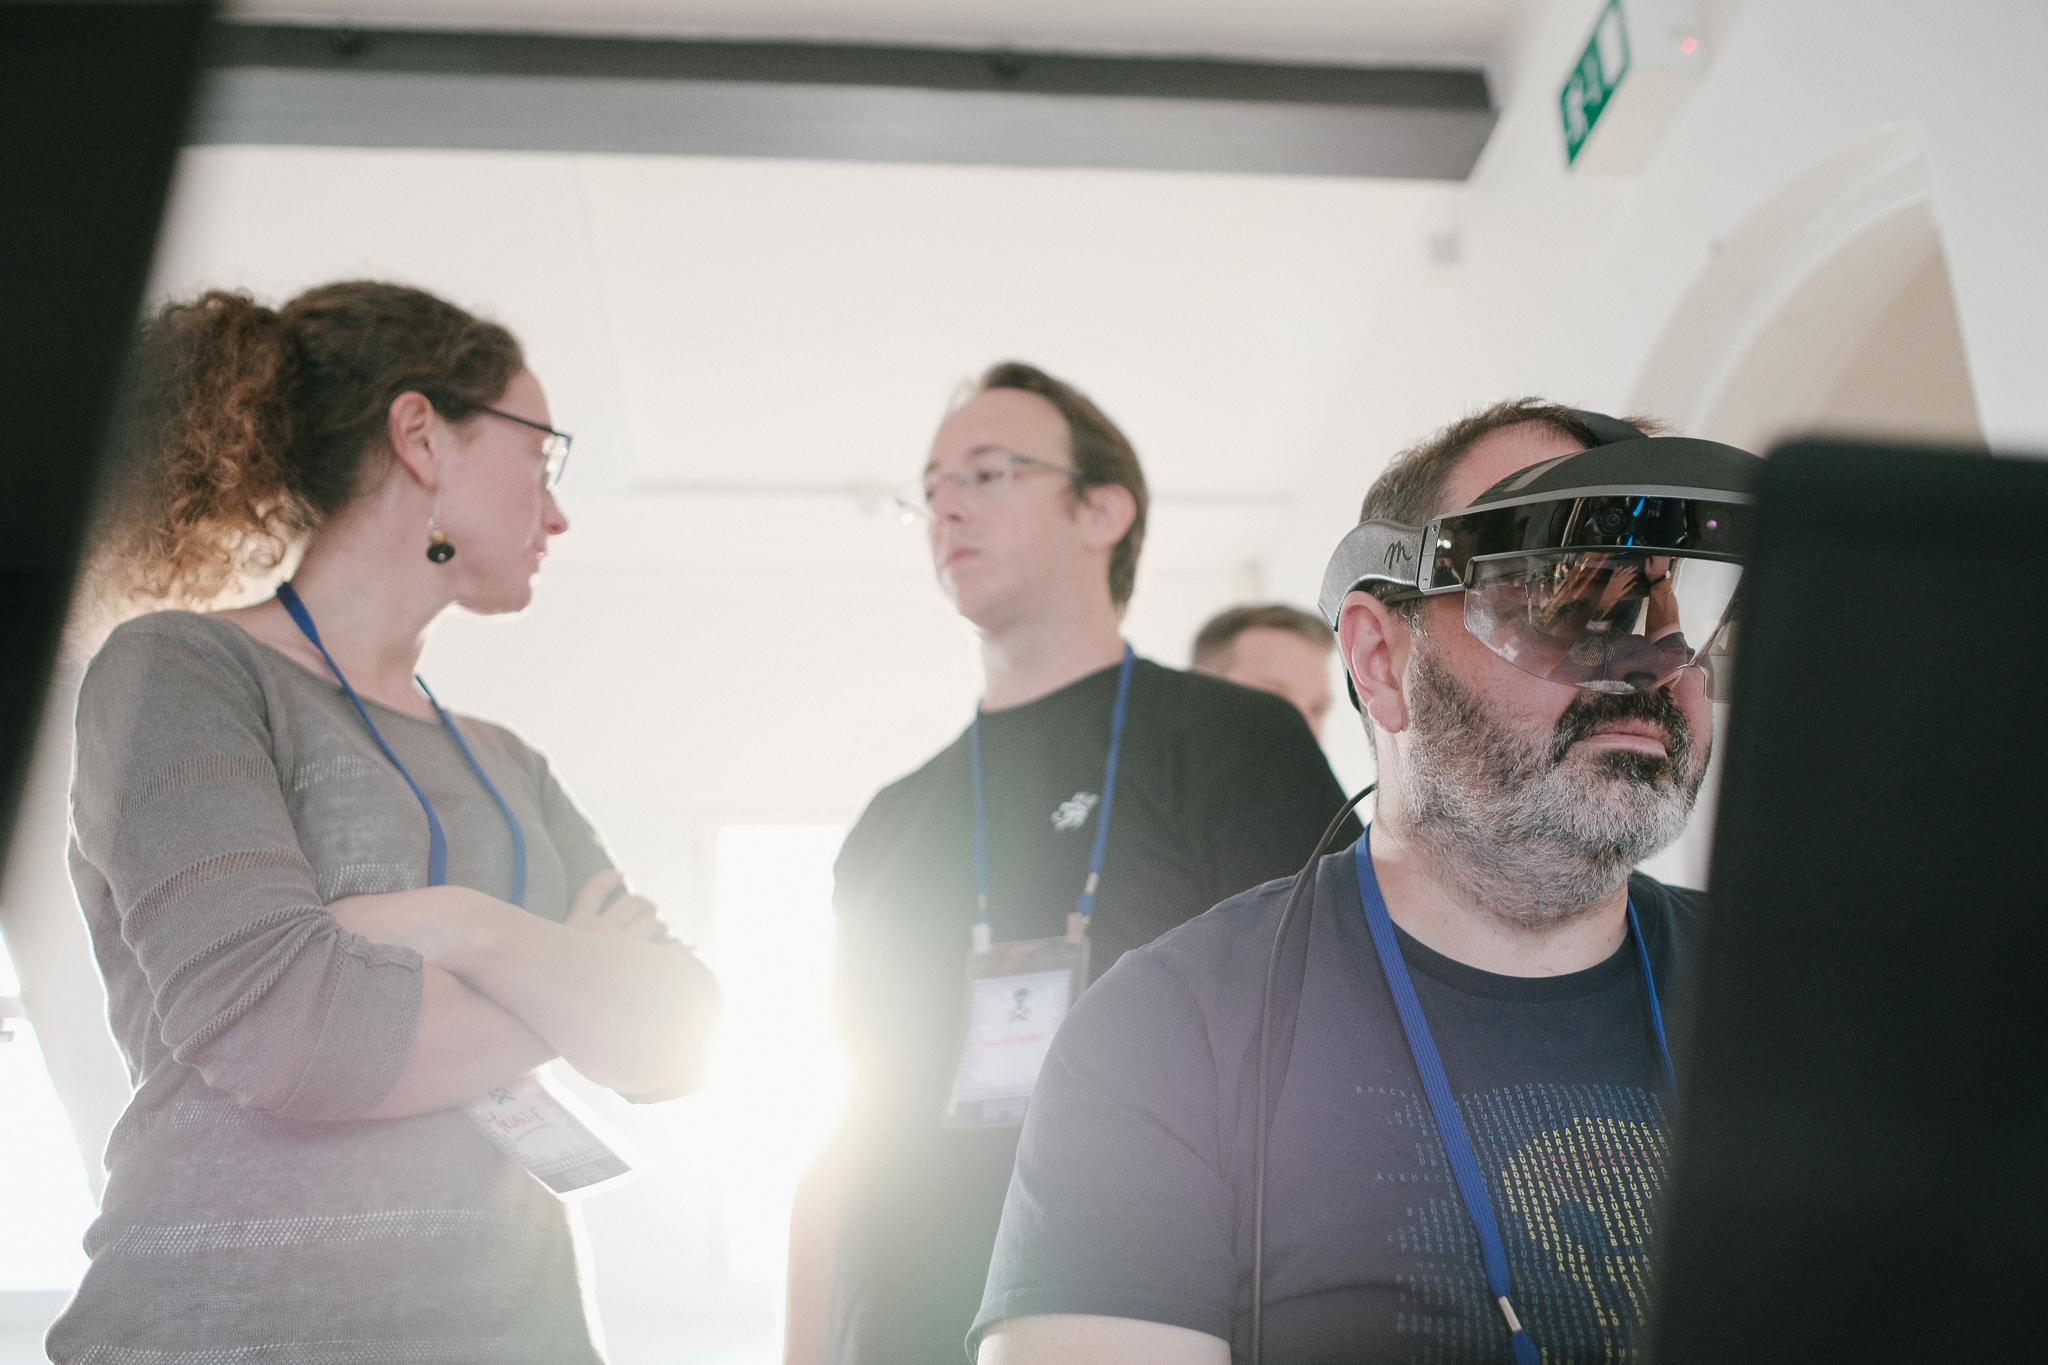
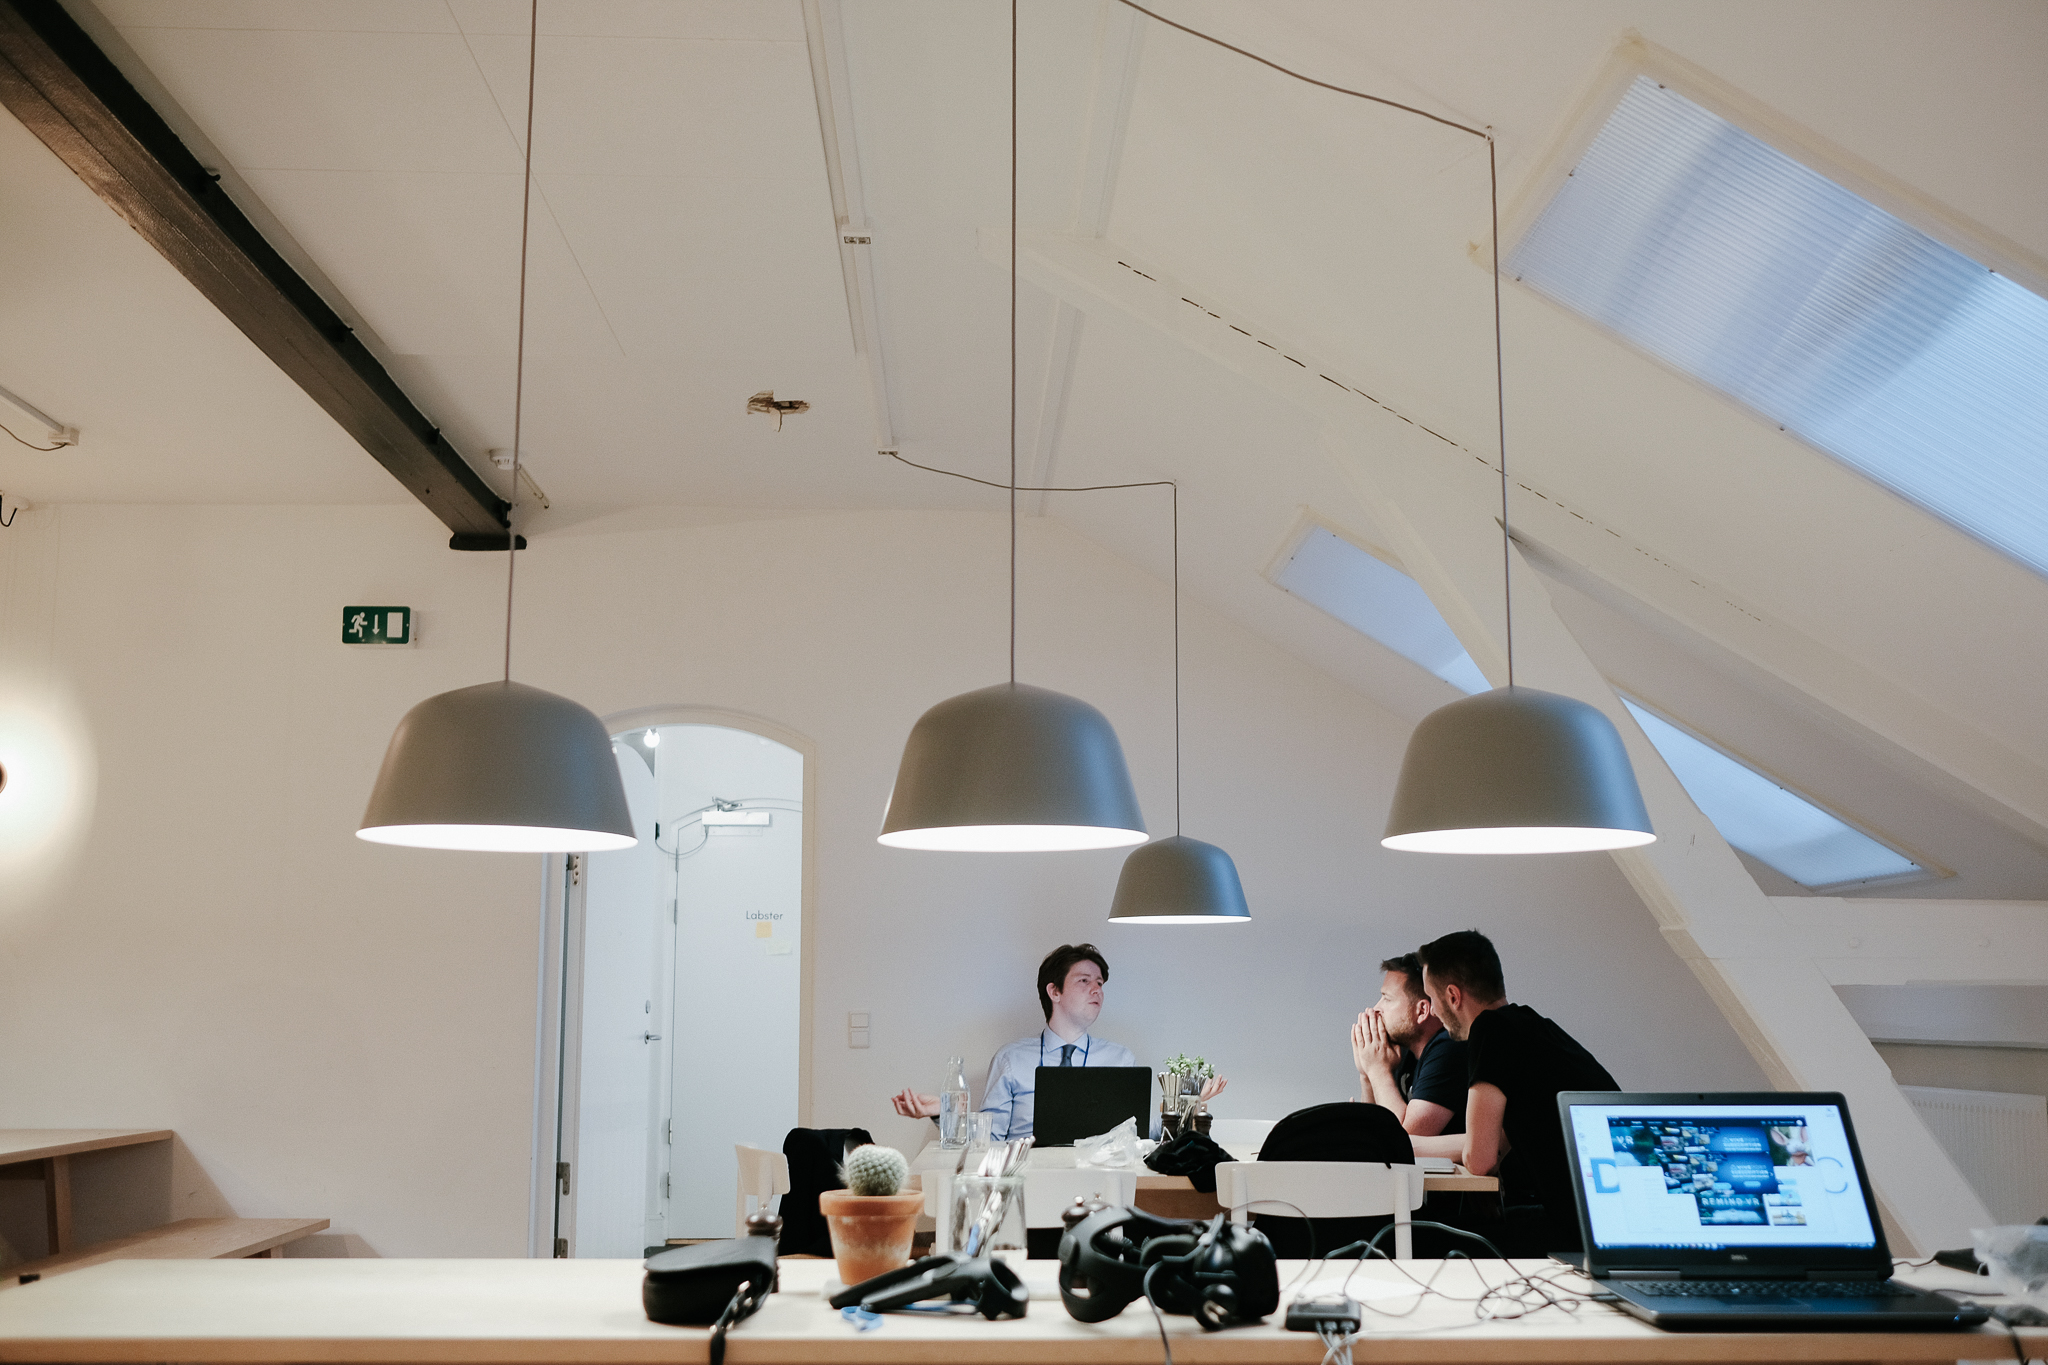
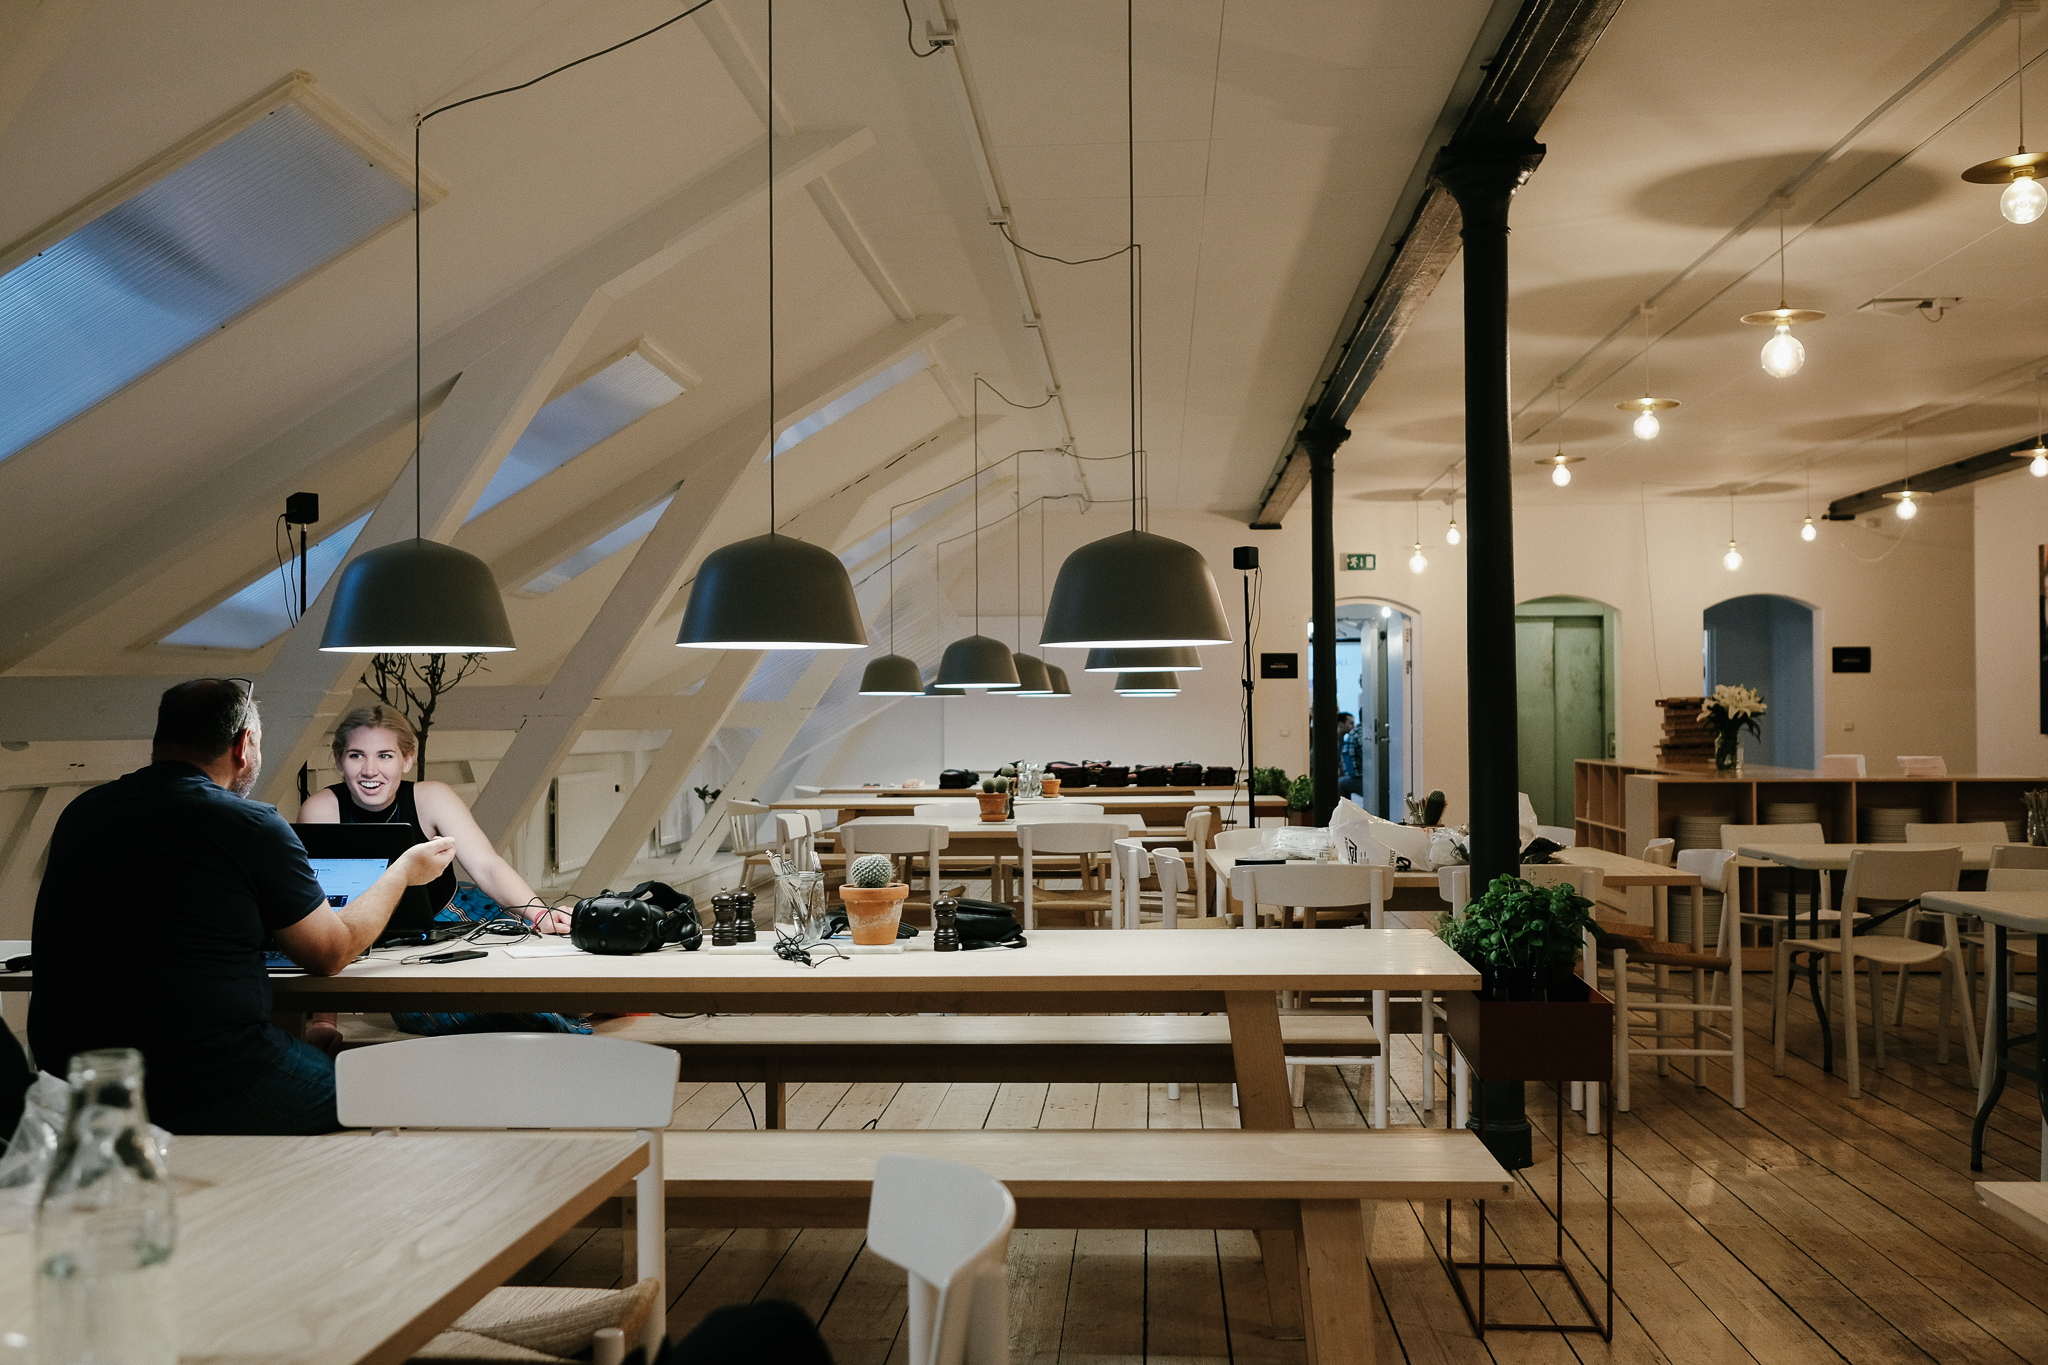
AR and VR demos by the Total team. Dell EMC provided HTC Vive and Meta 2 kits, with Dell Precision workstations, for people to try. They were a lot of fun, provoking several cries of disbelief and causing at least one person to collapse in a heap on the floor.
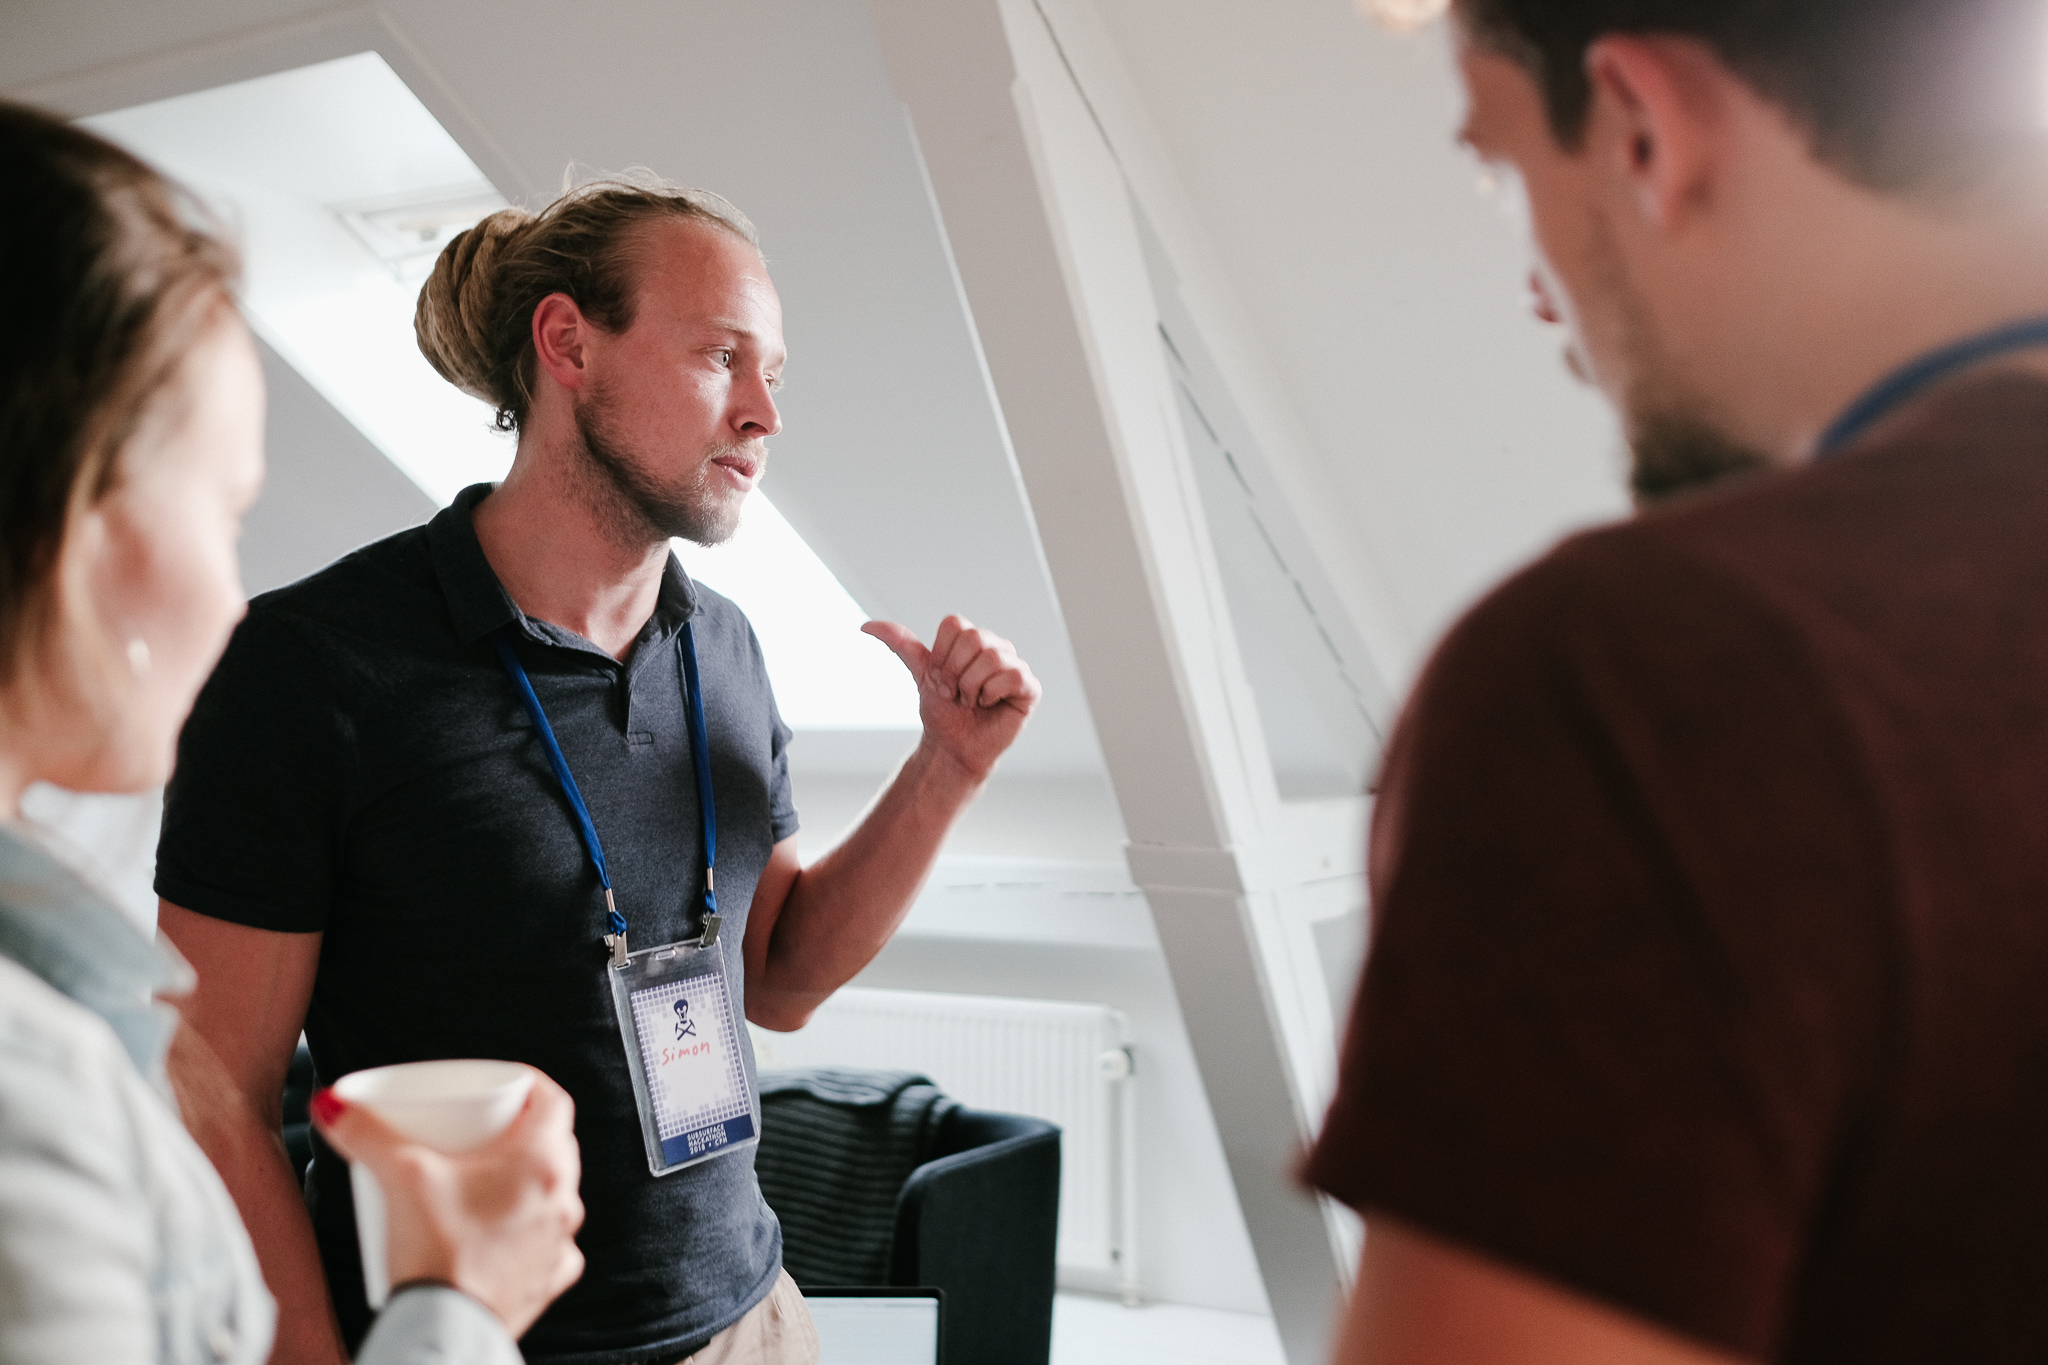
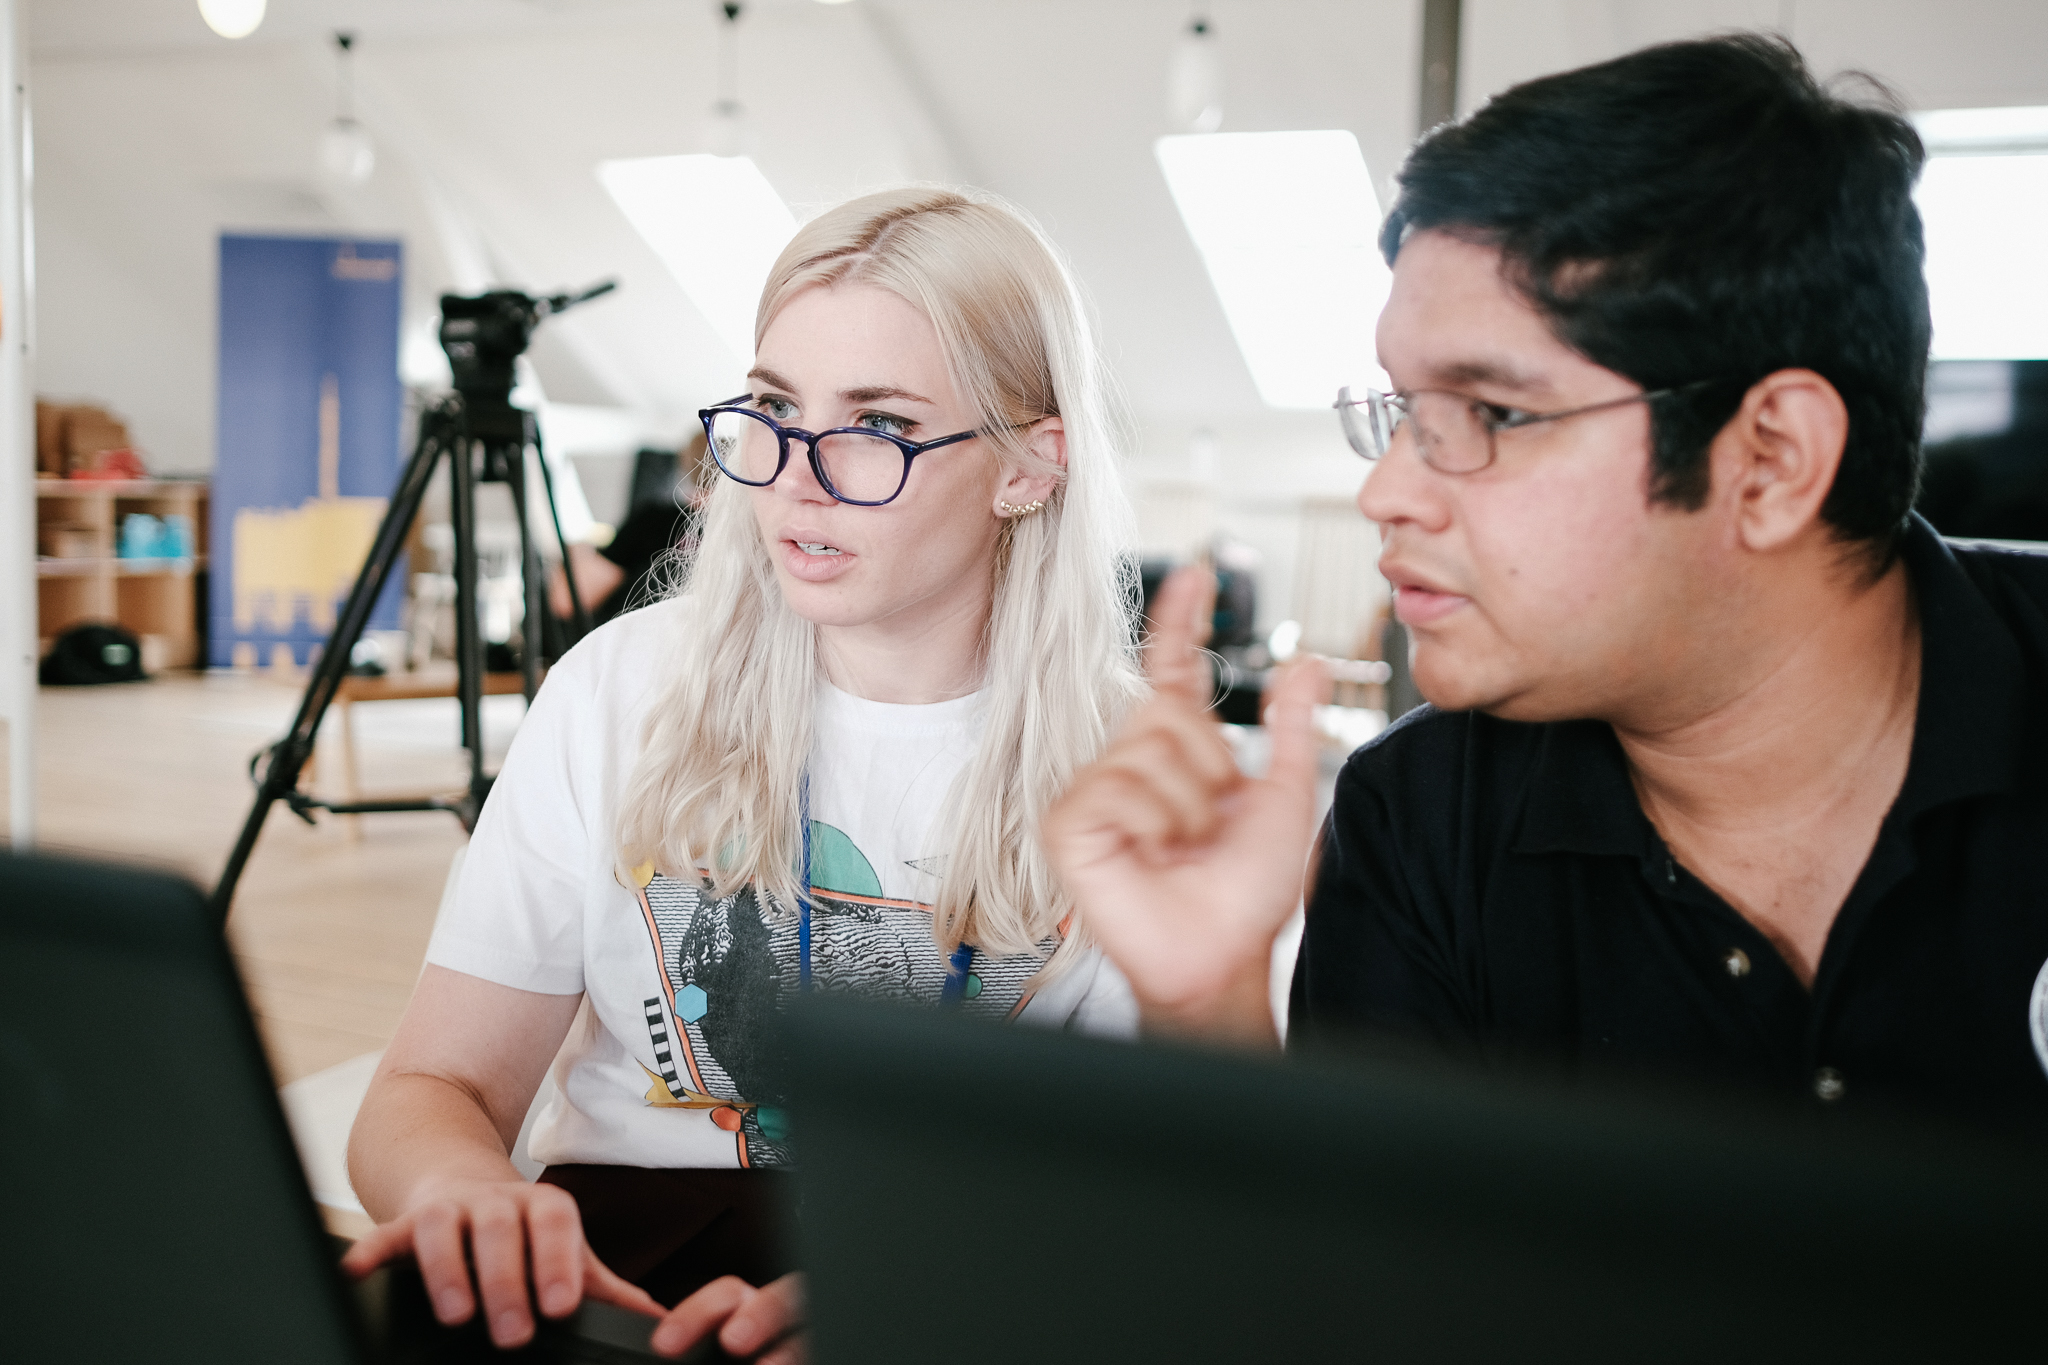
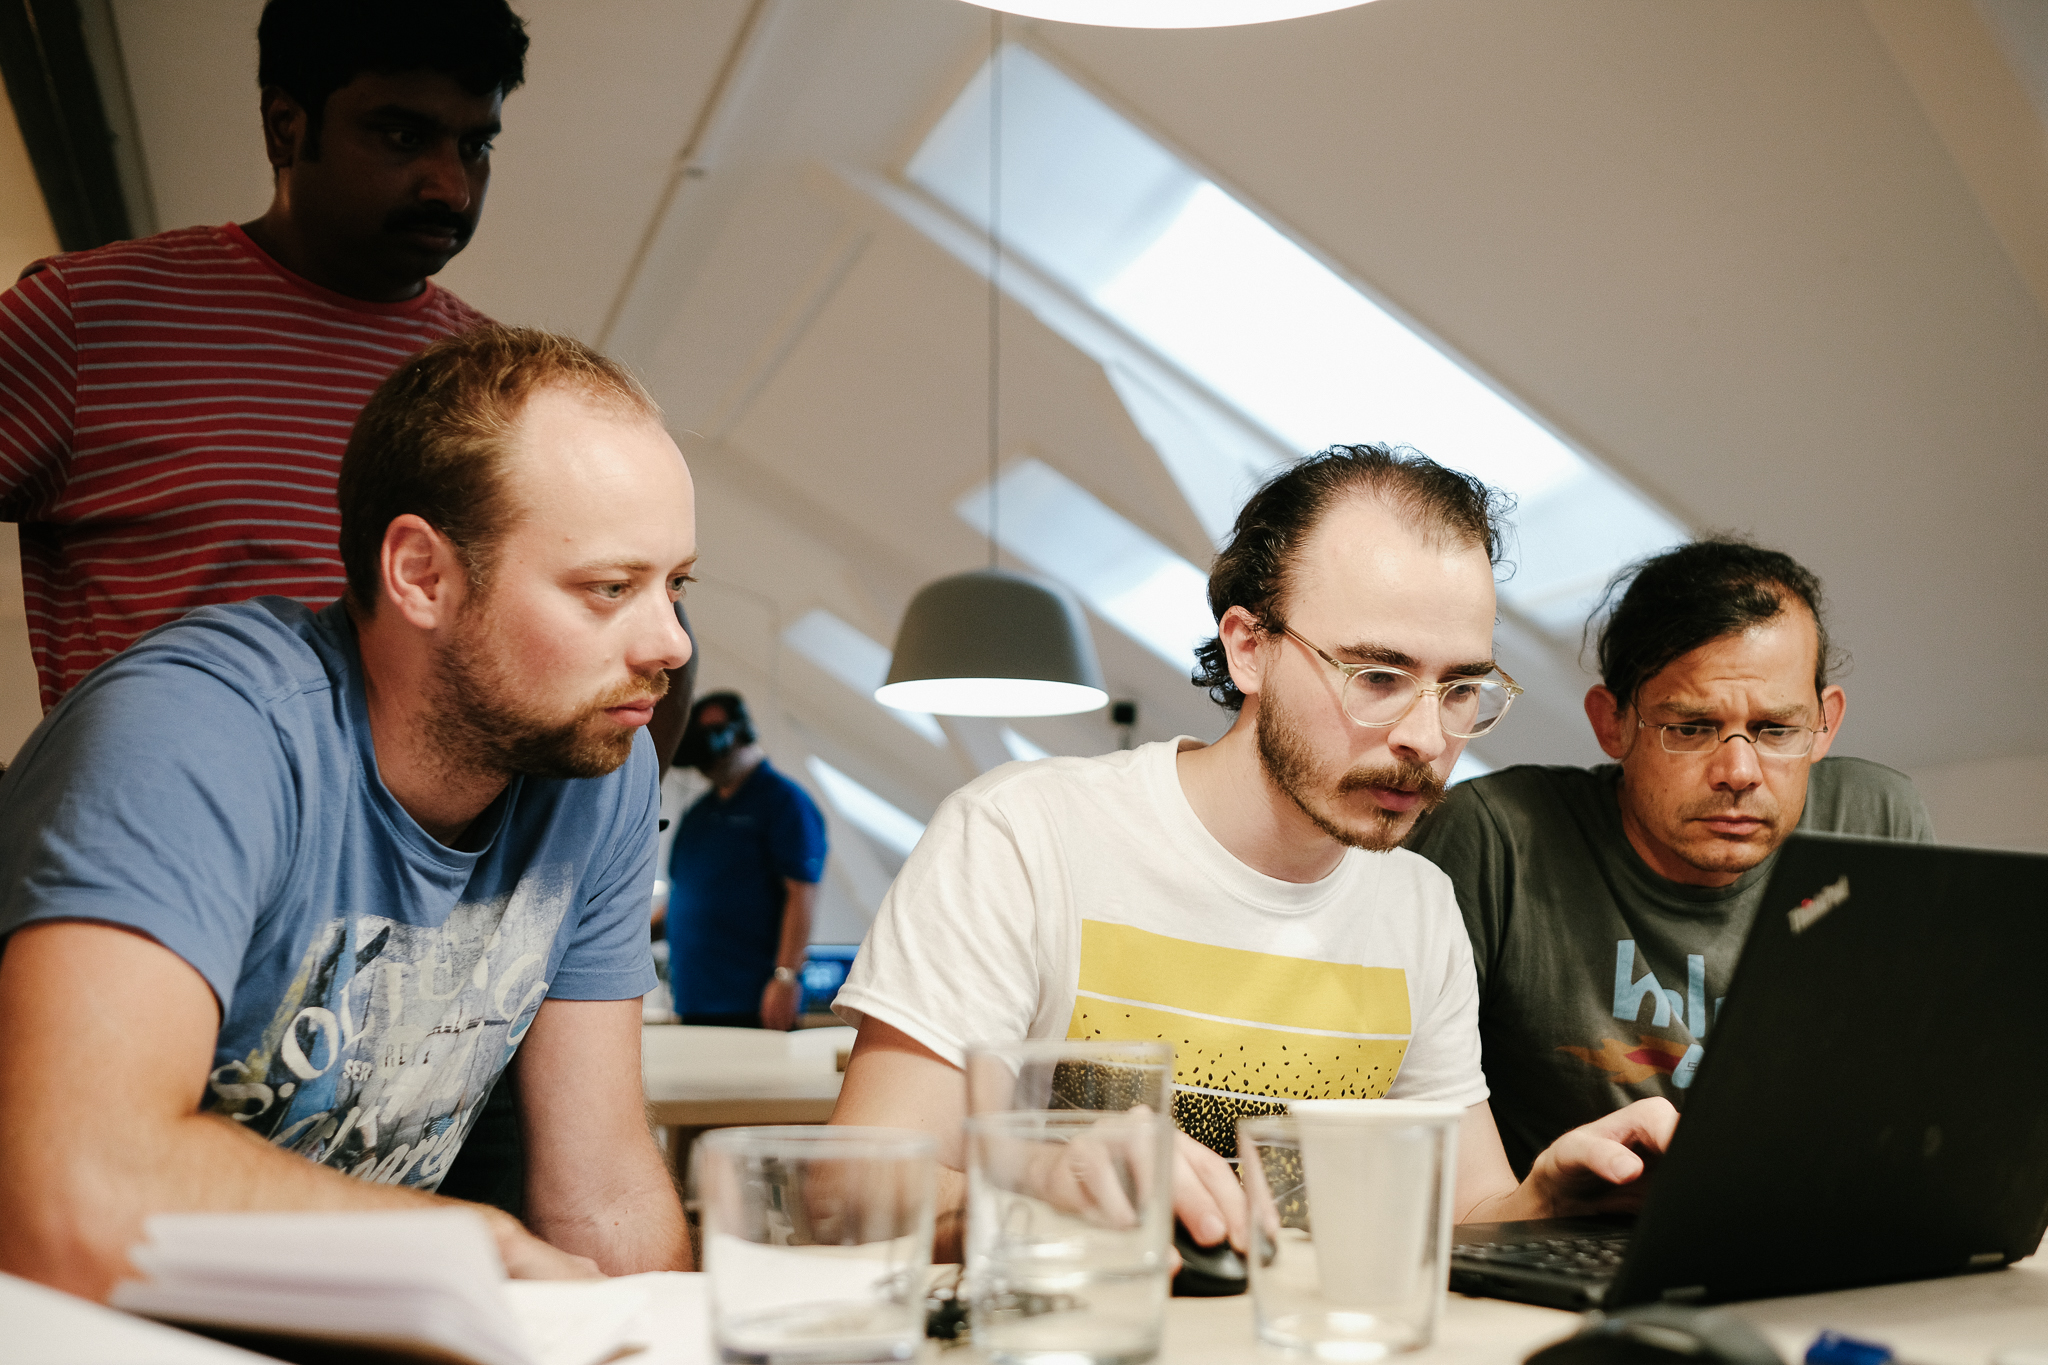
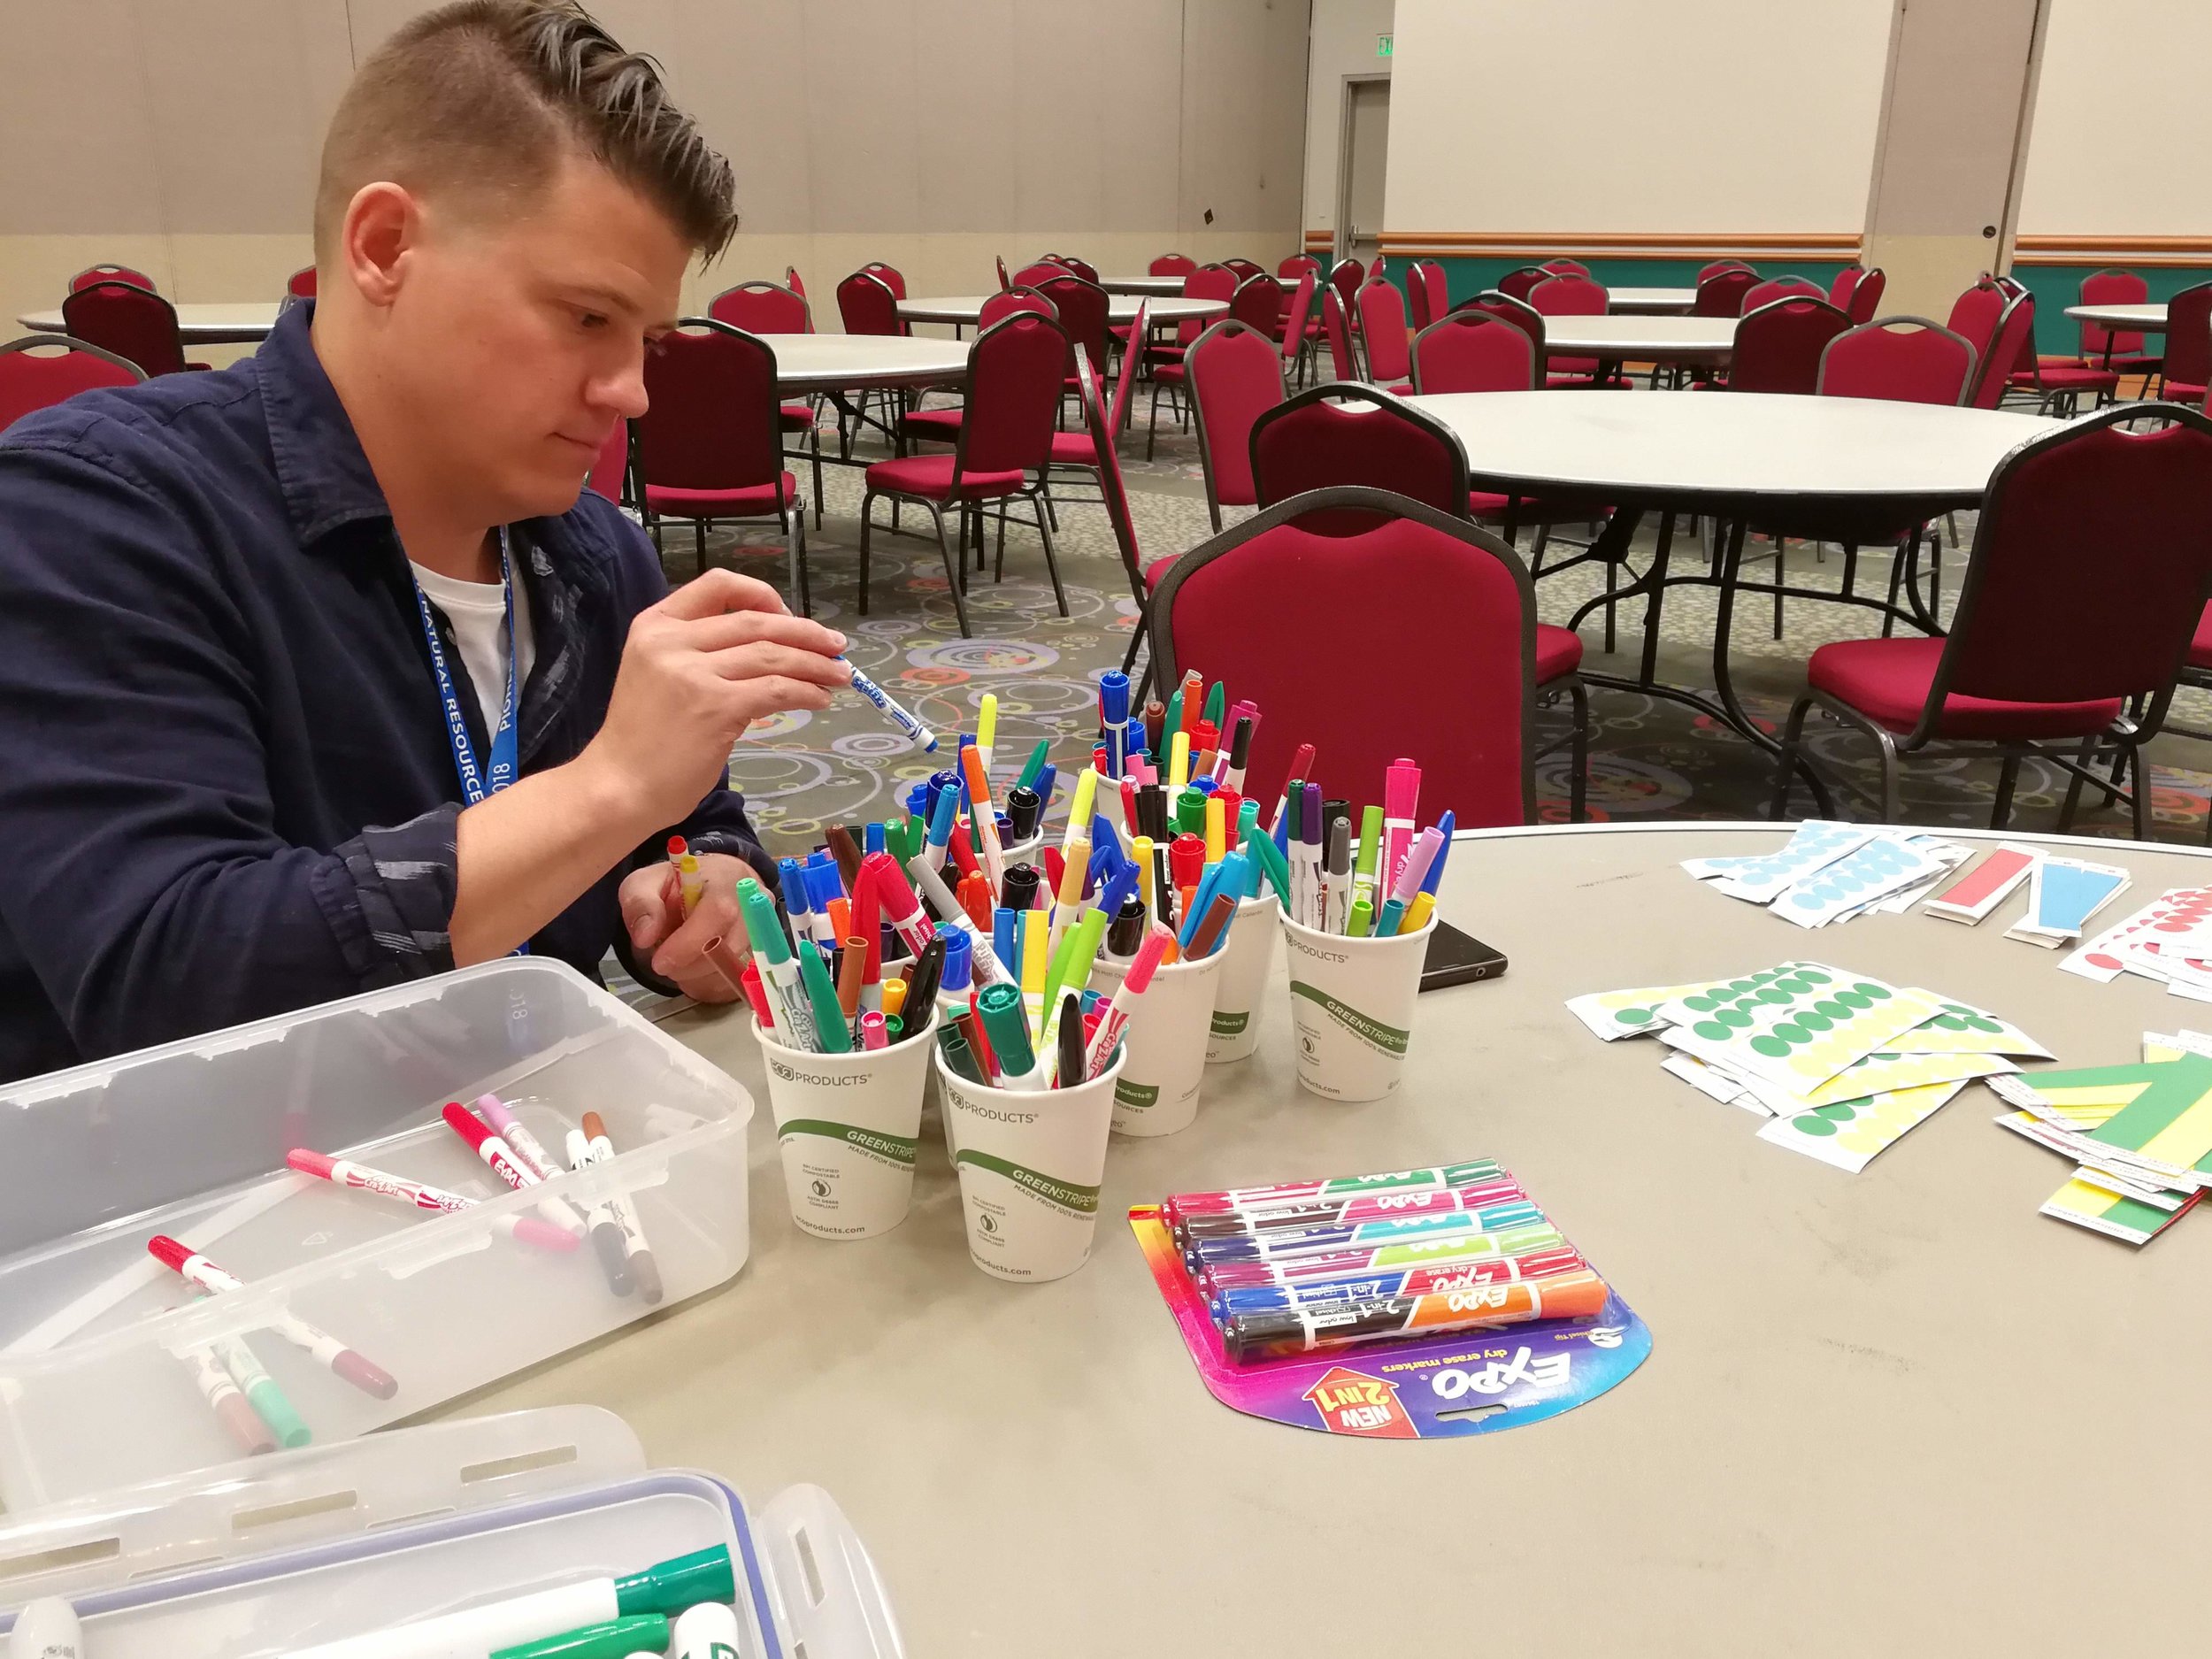
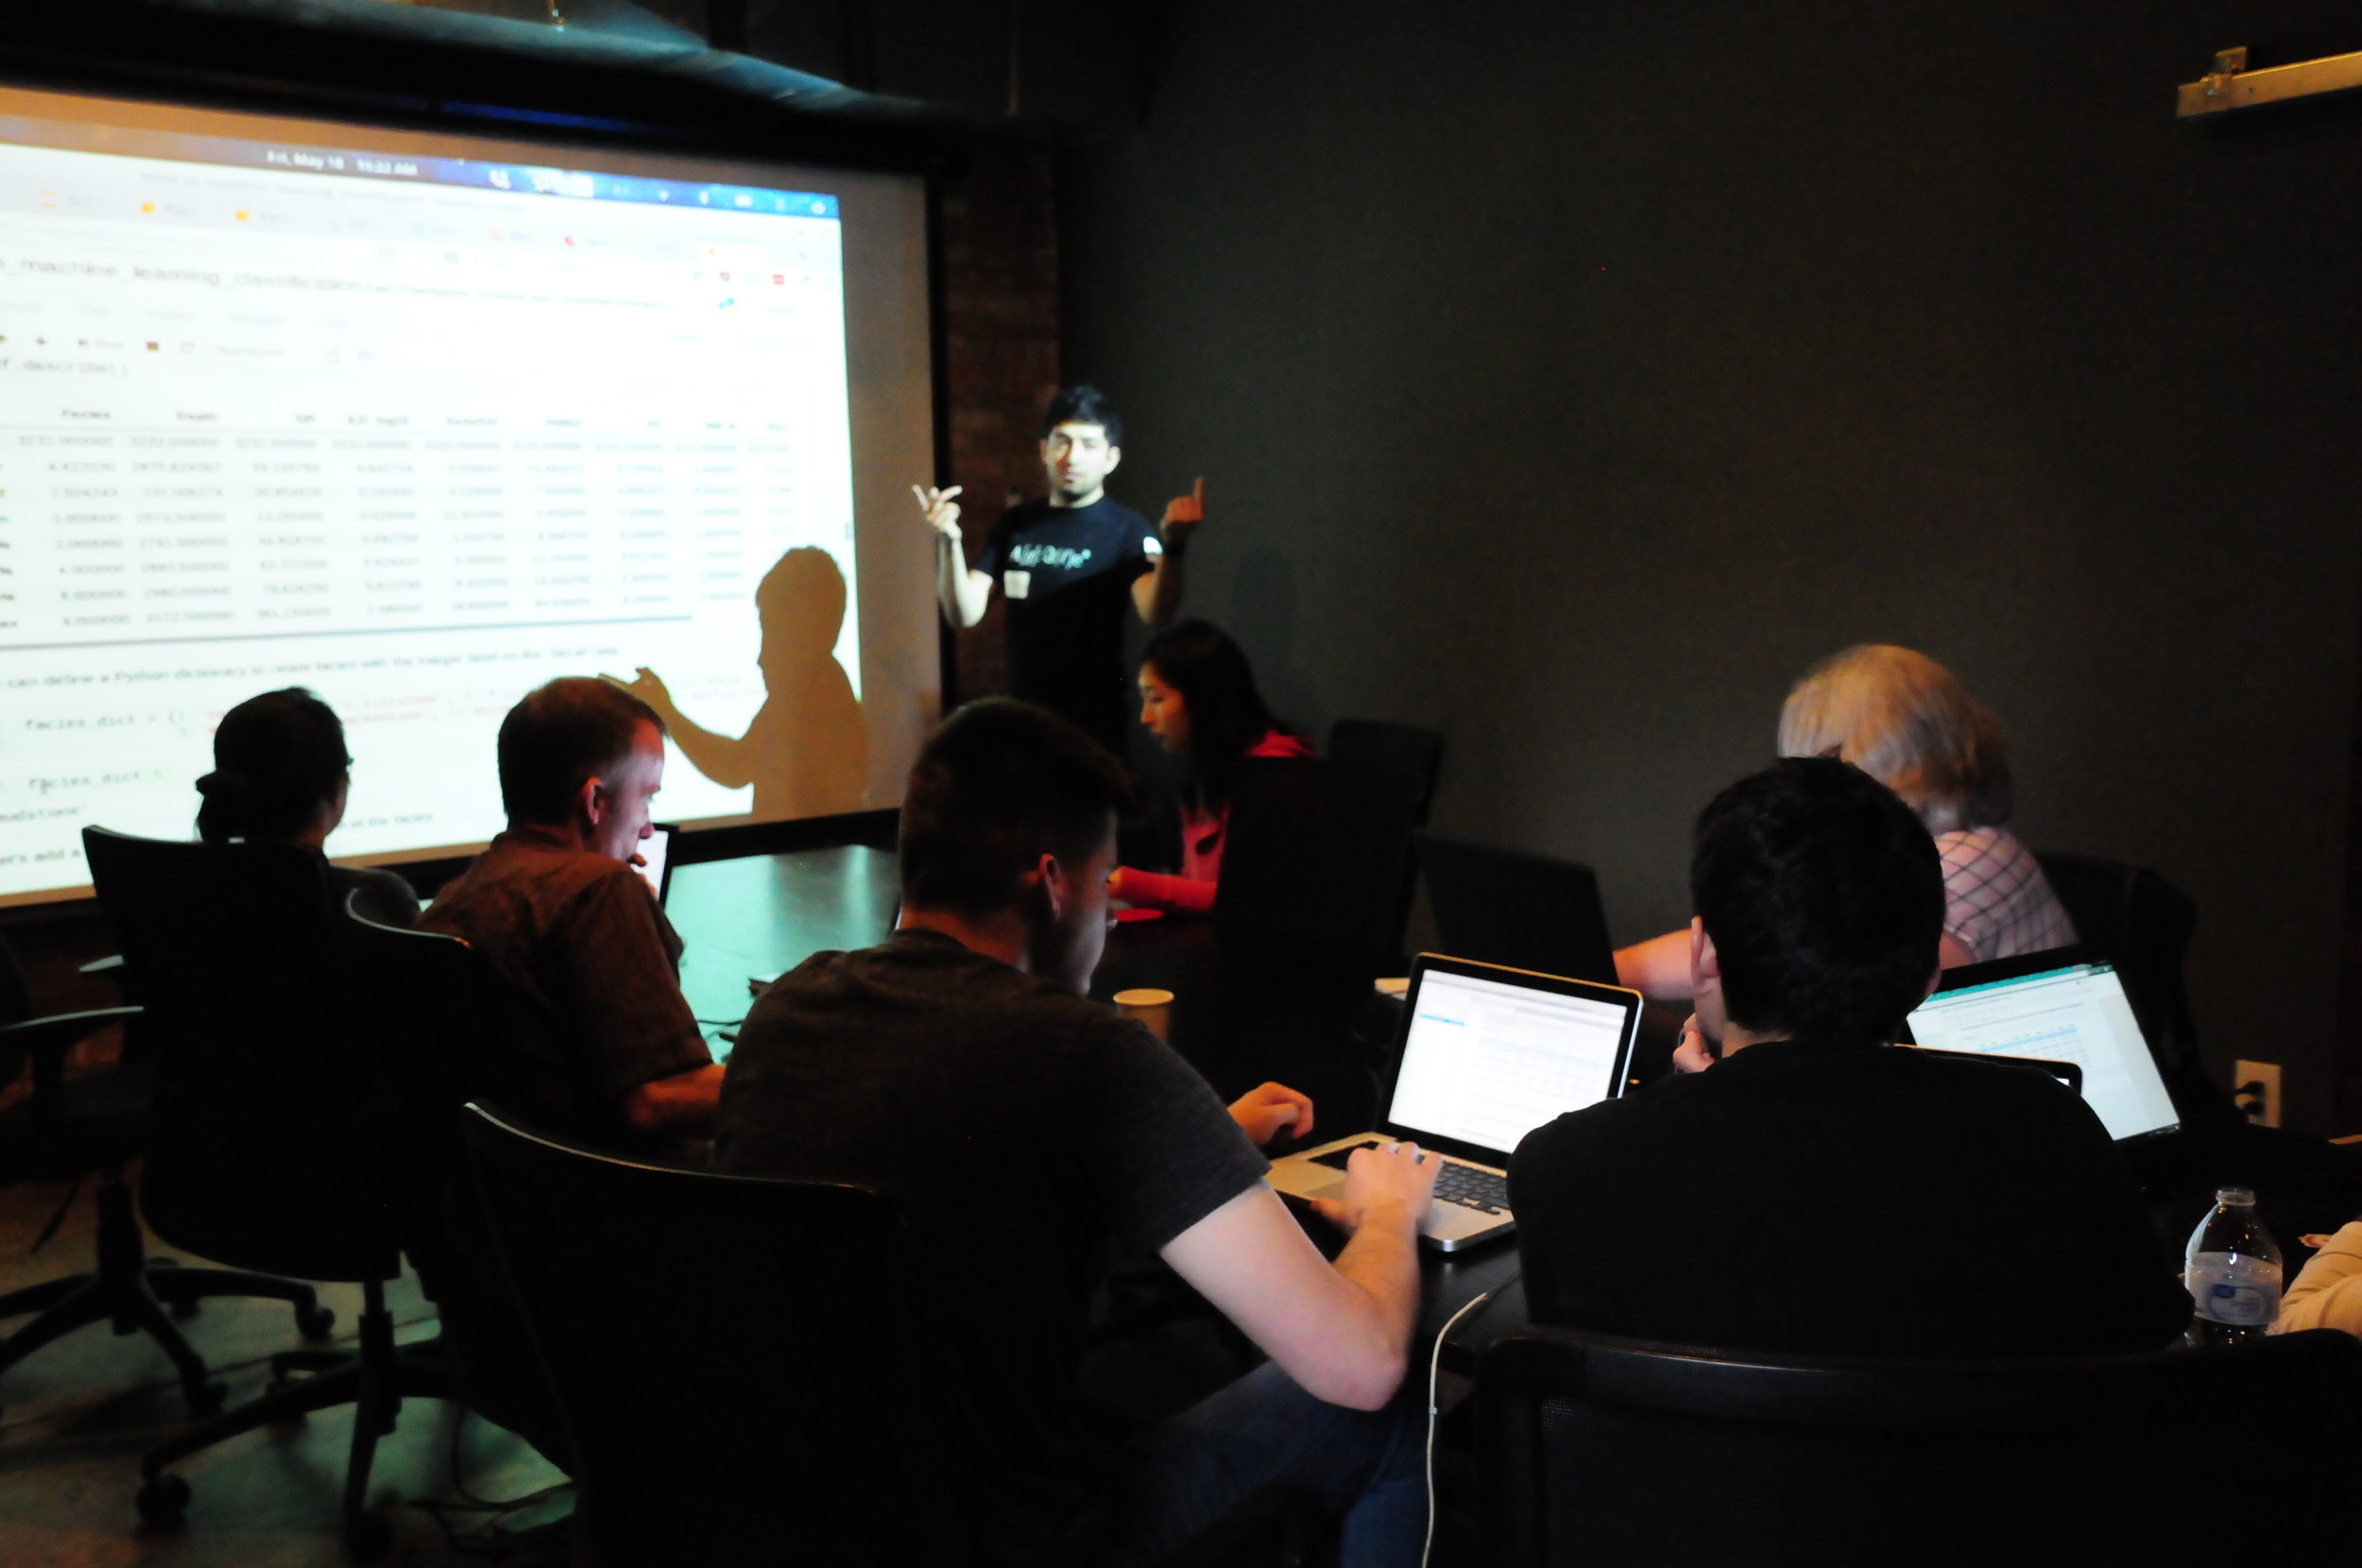
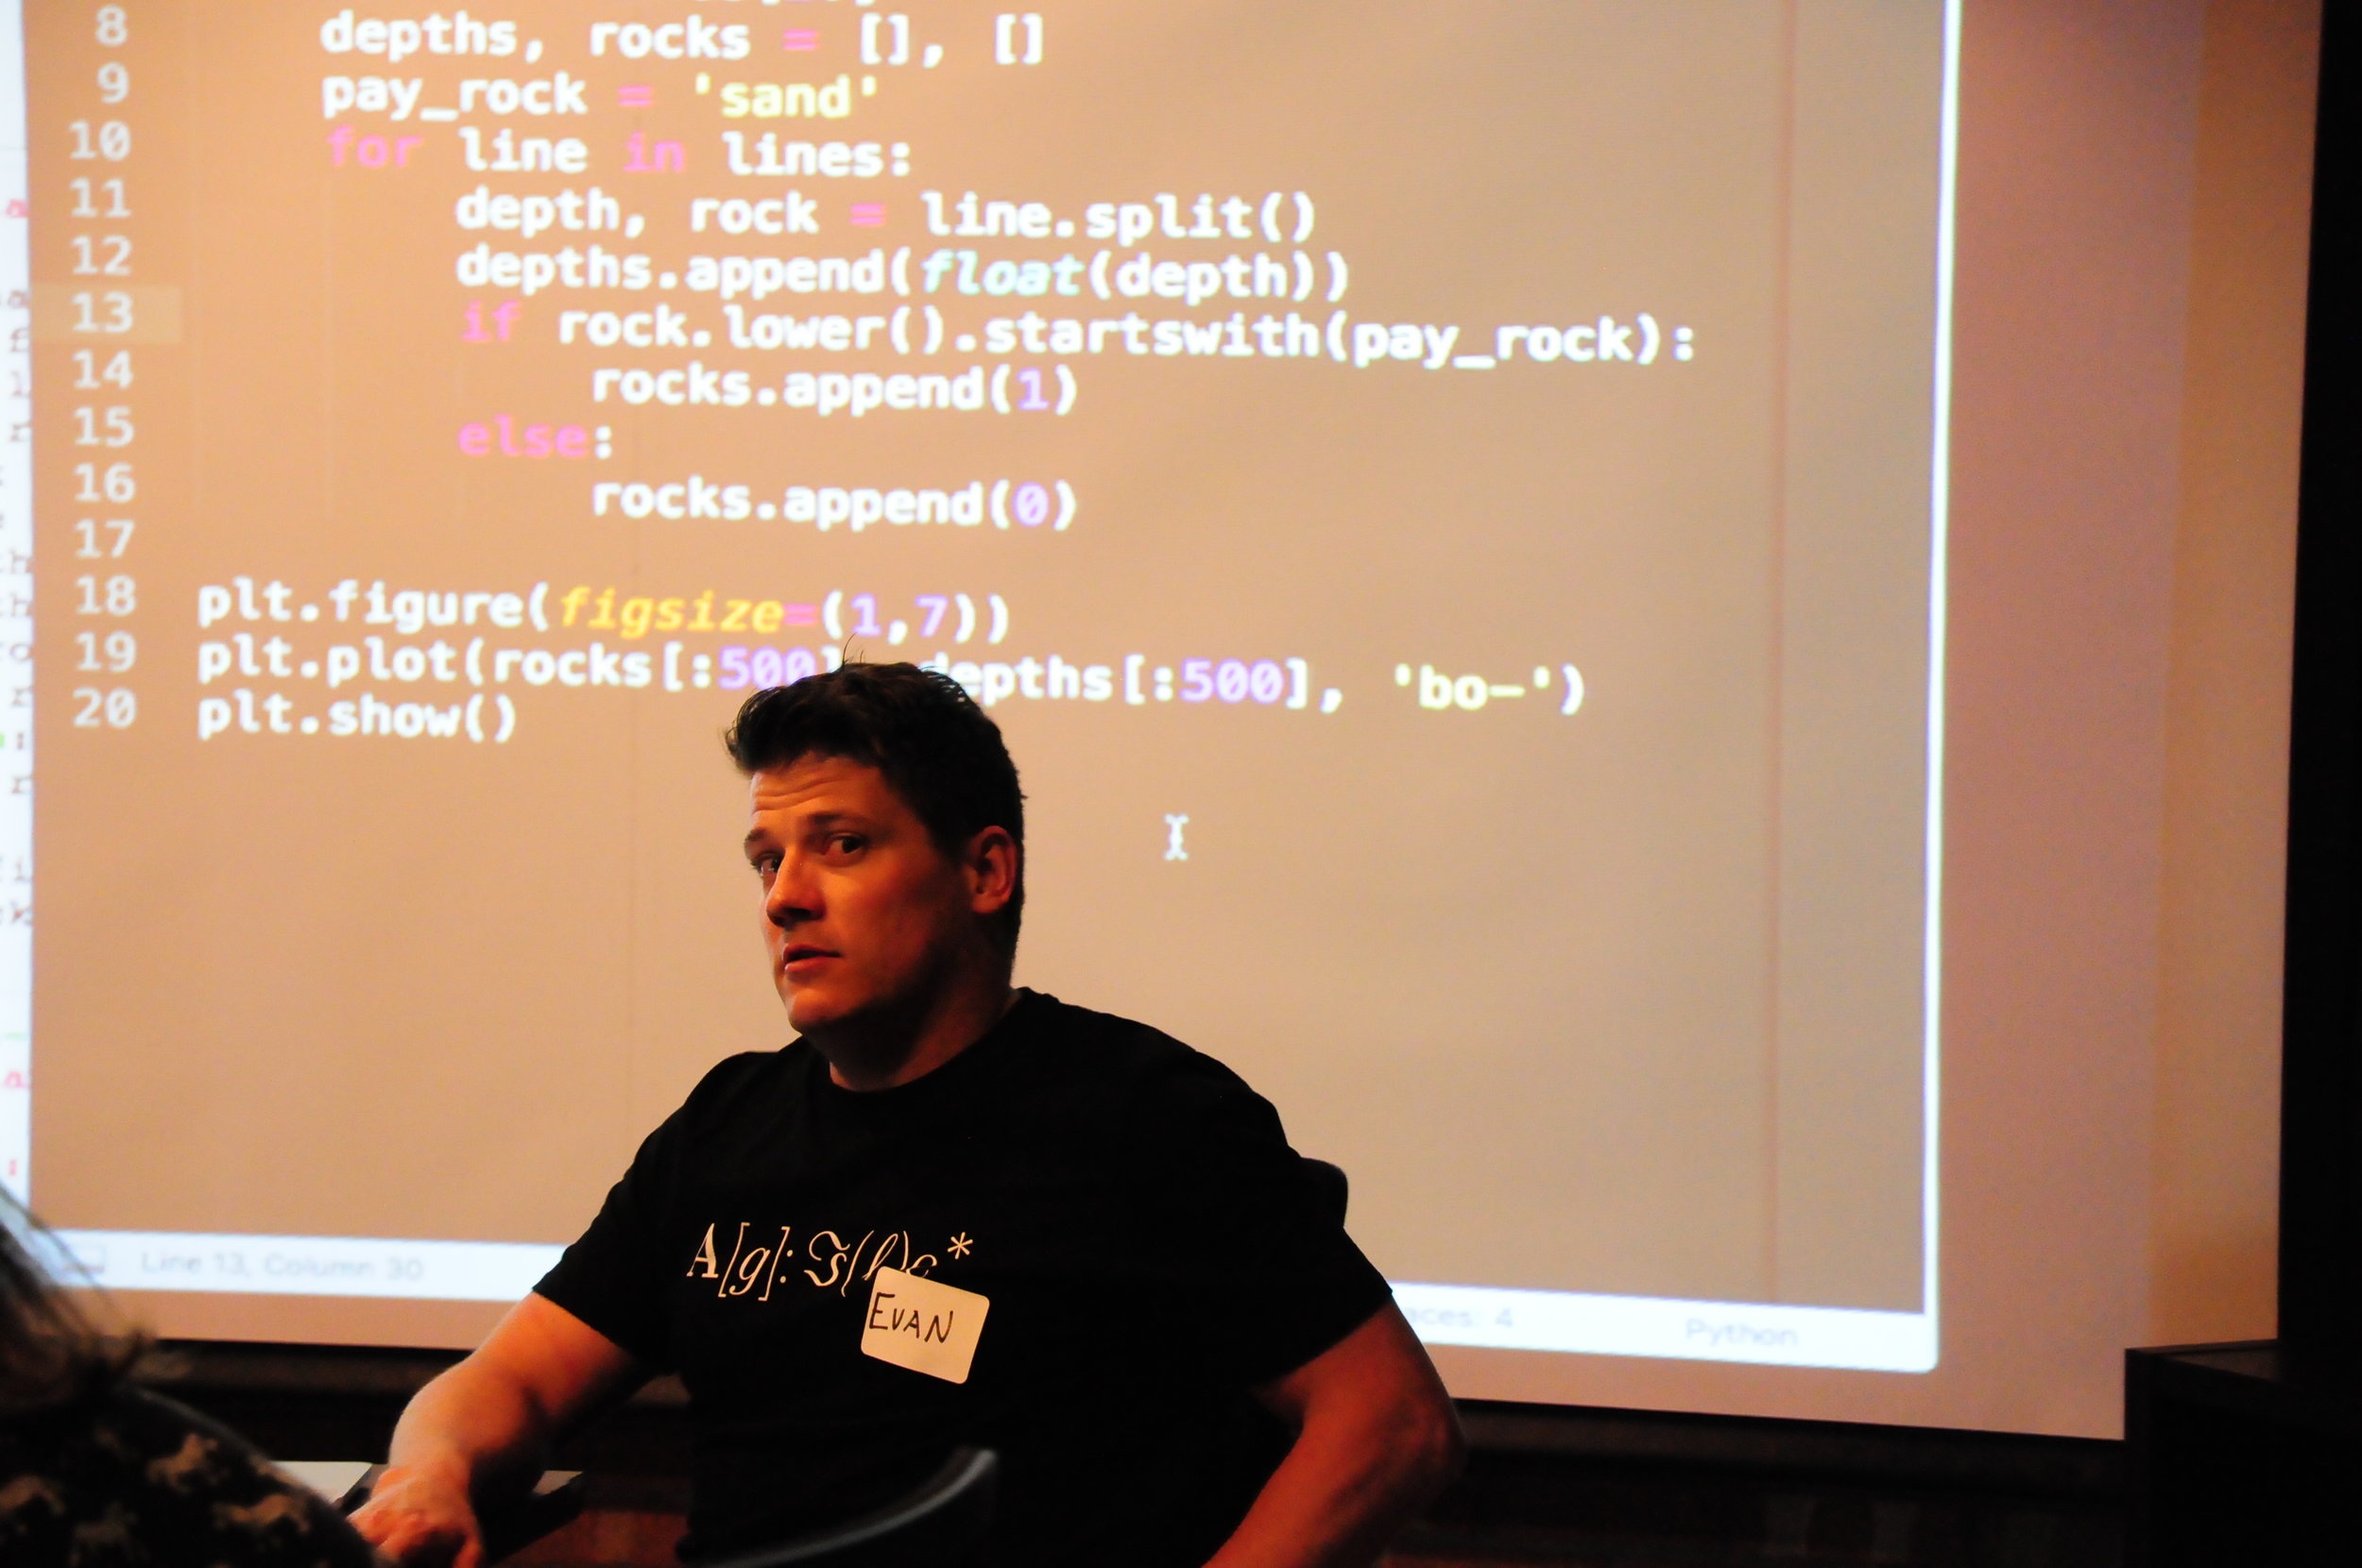
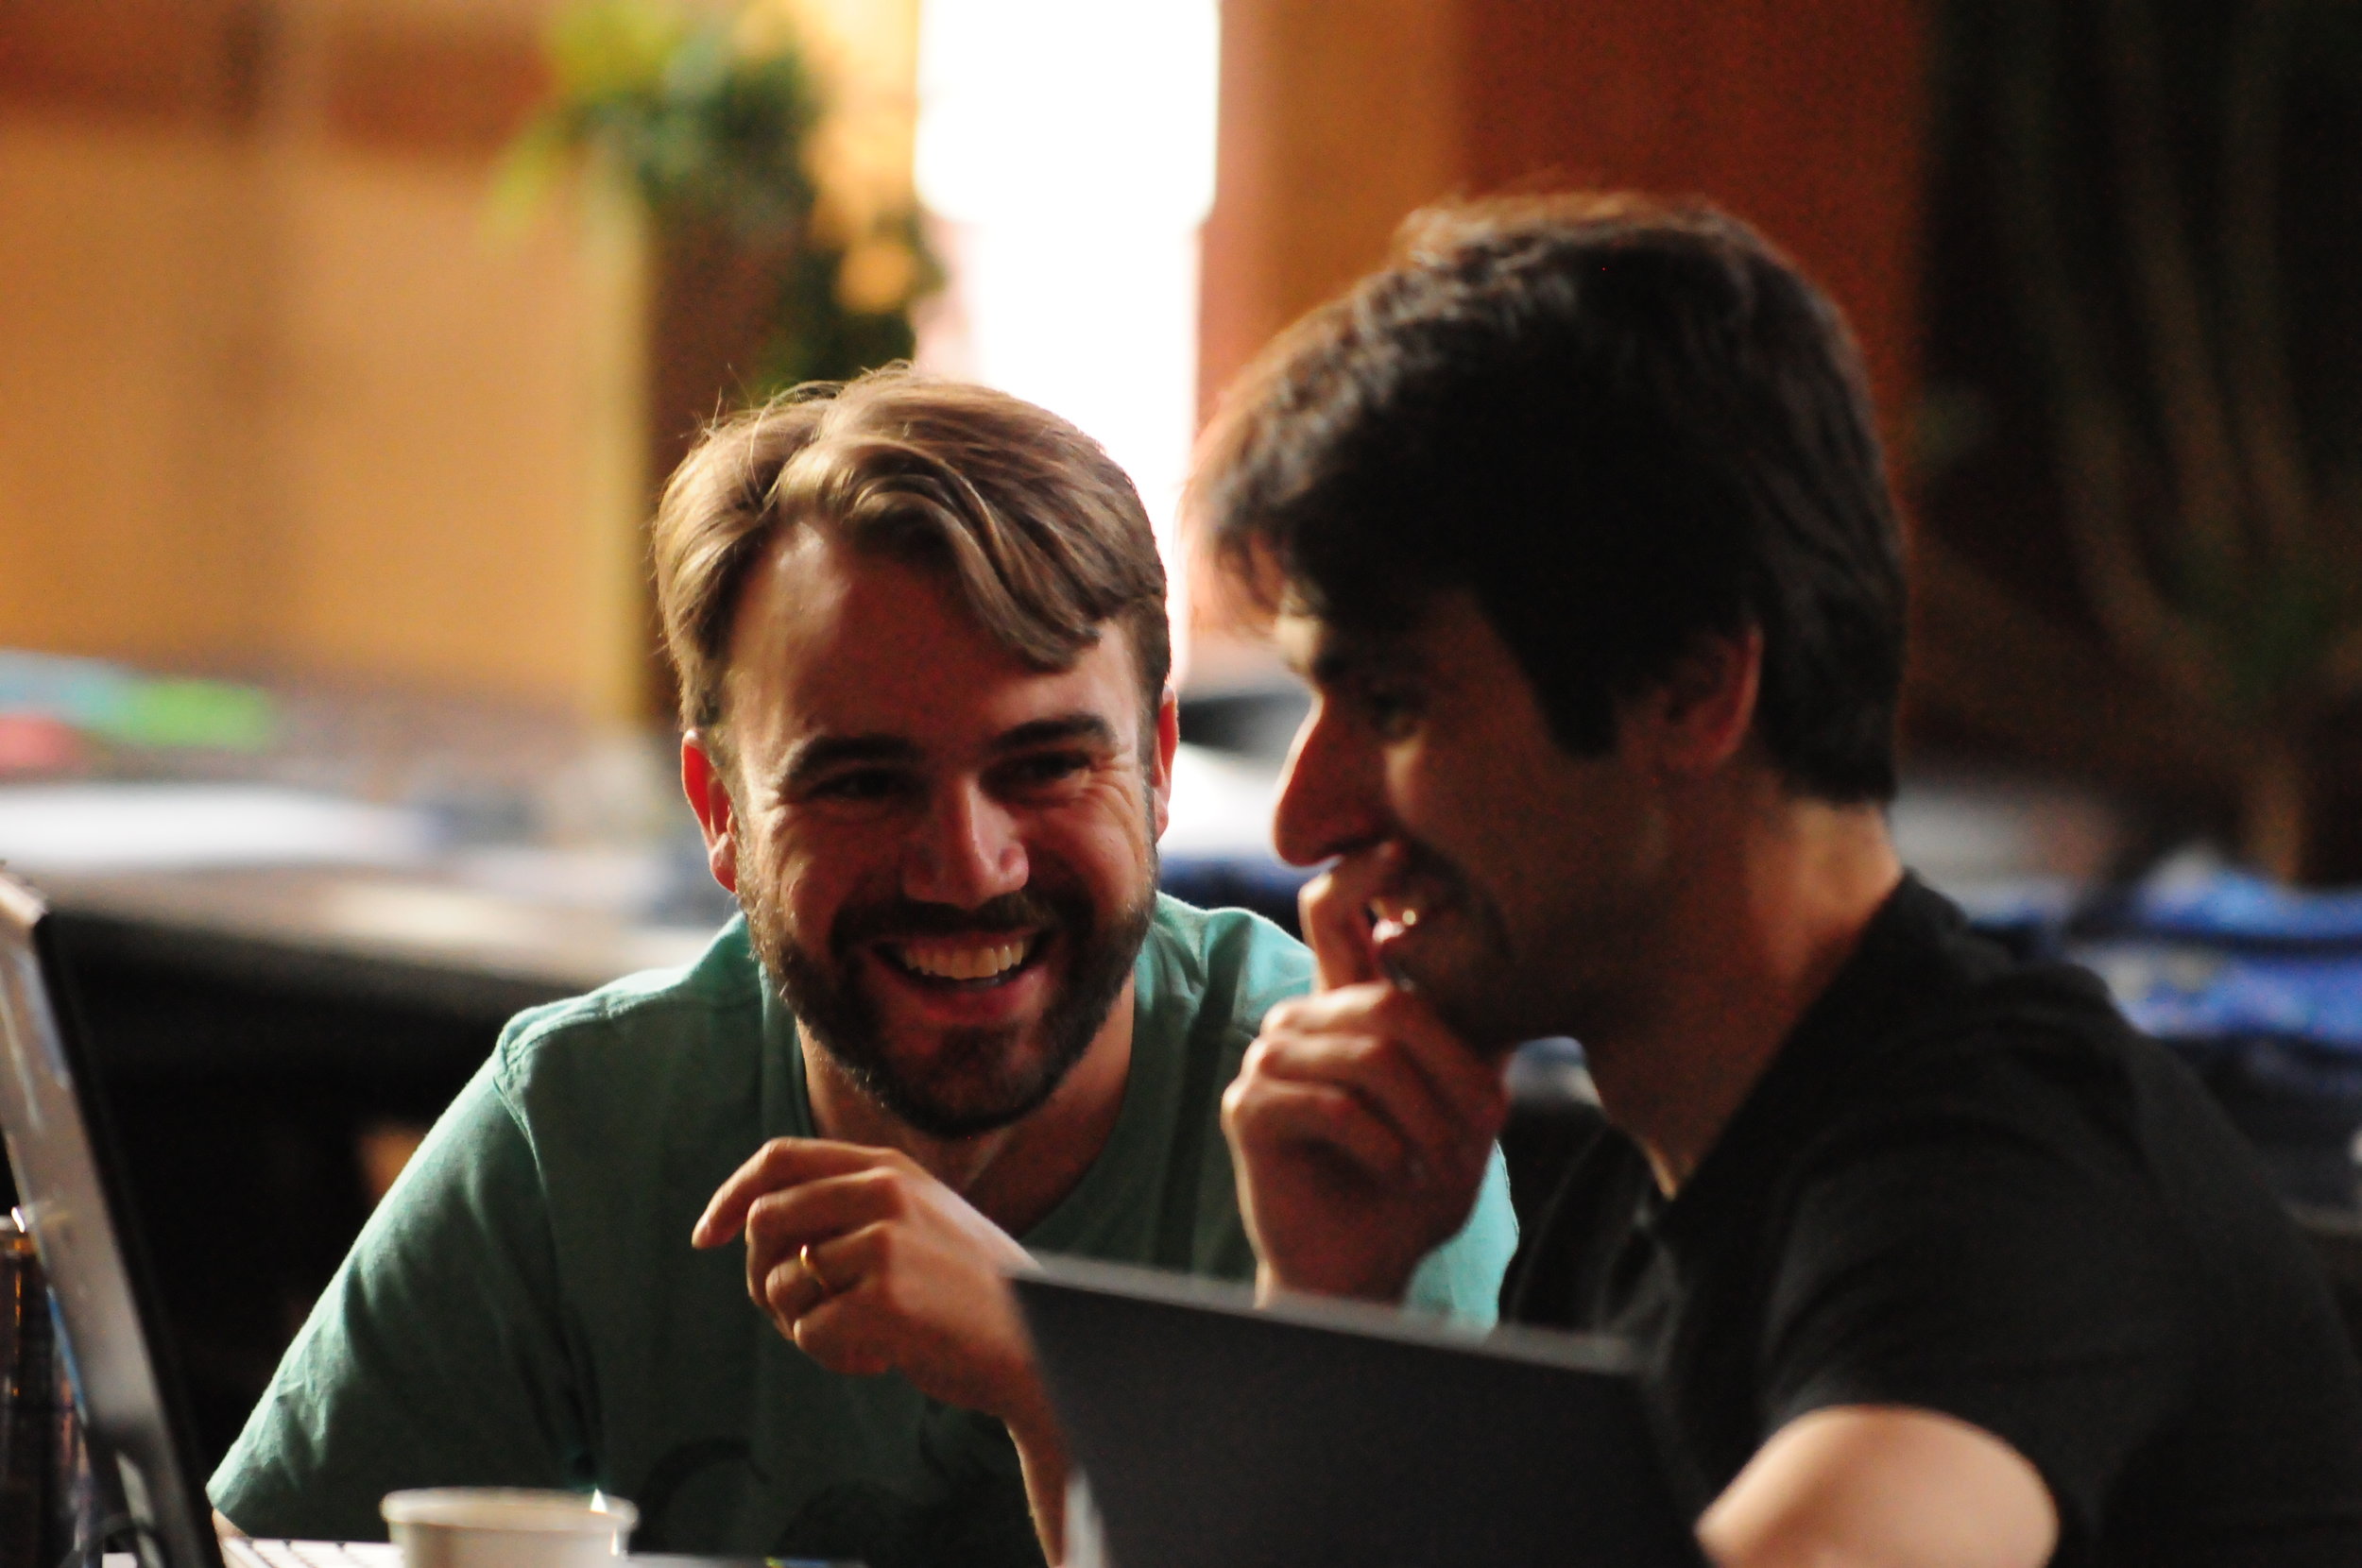
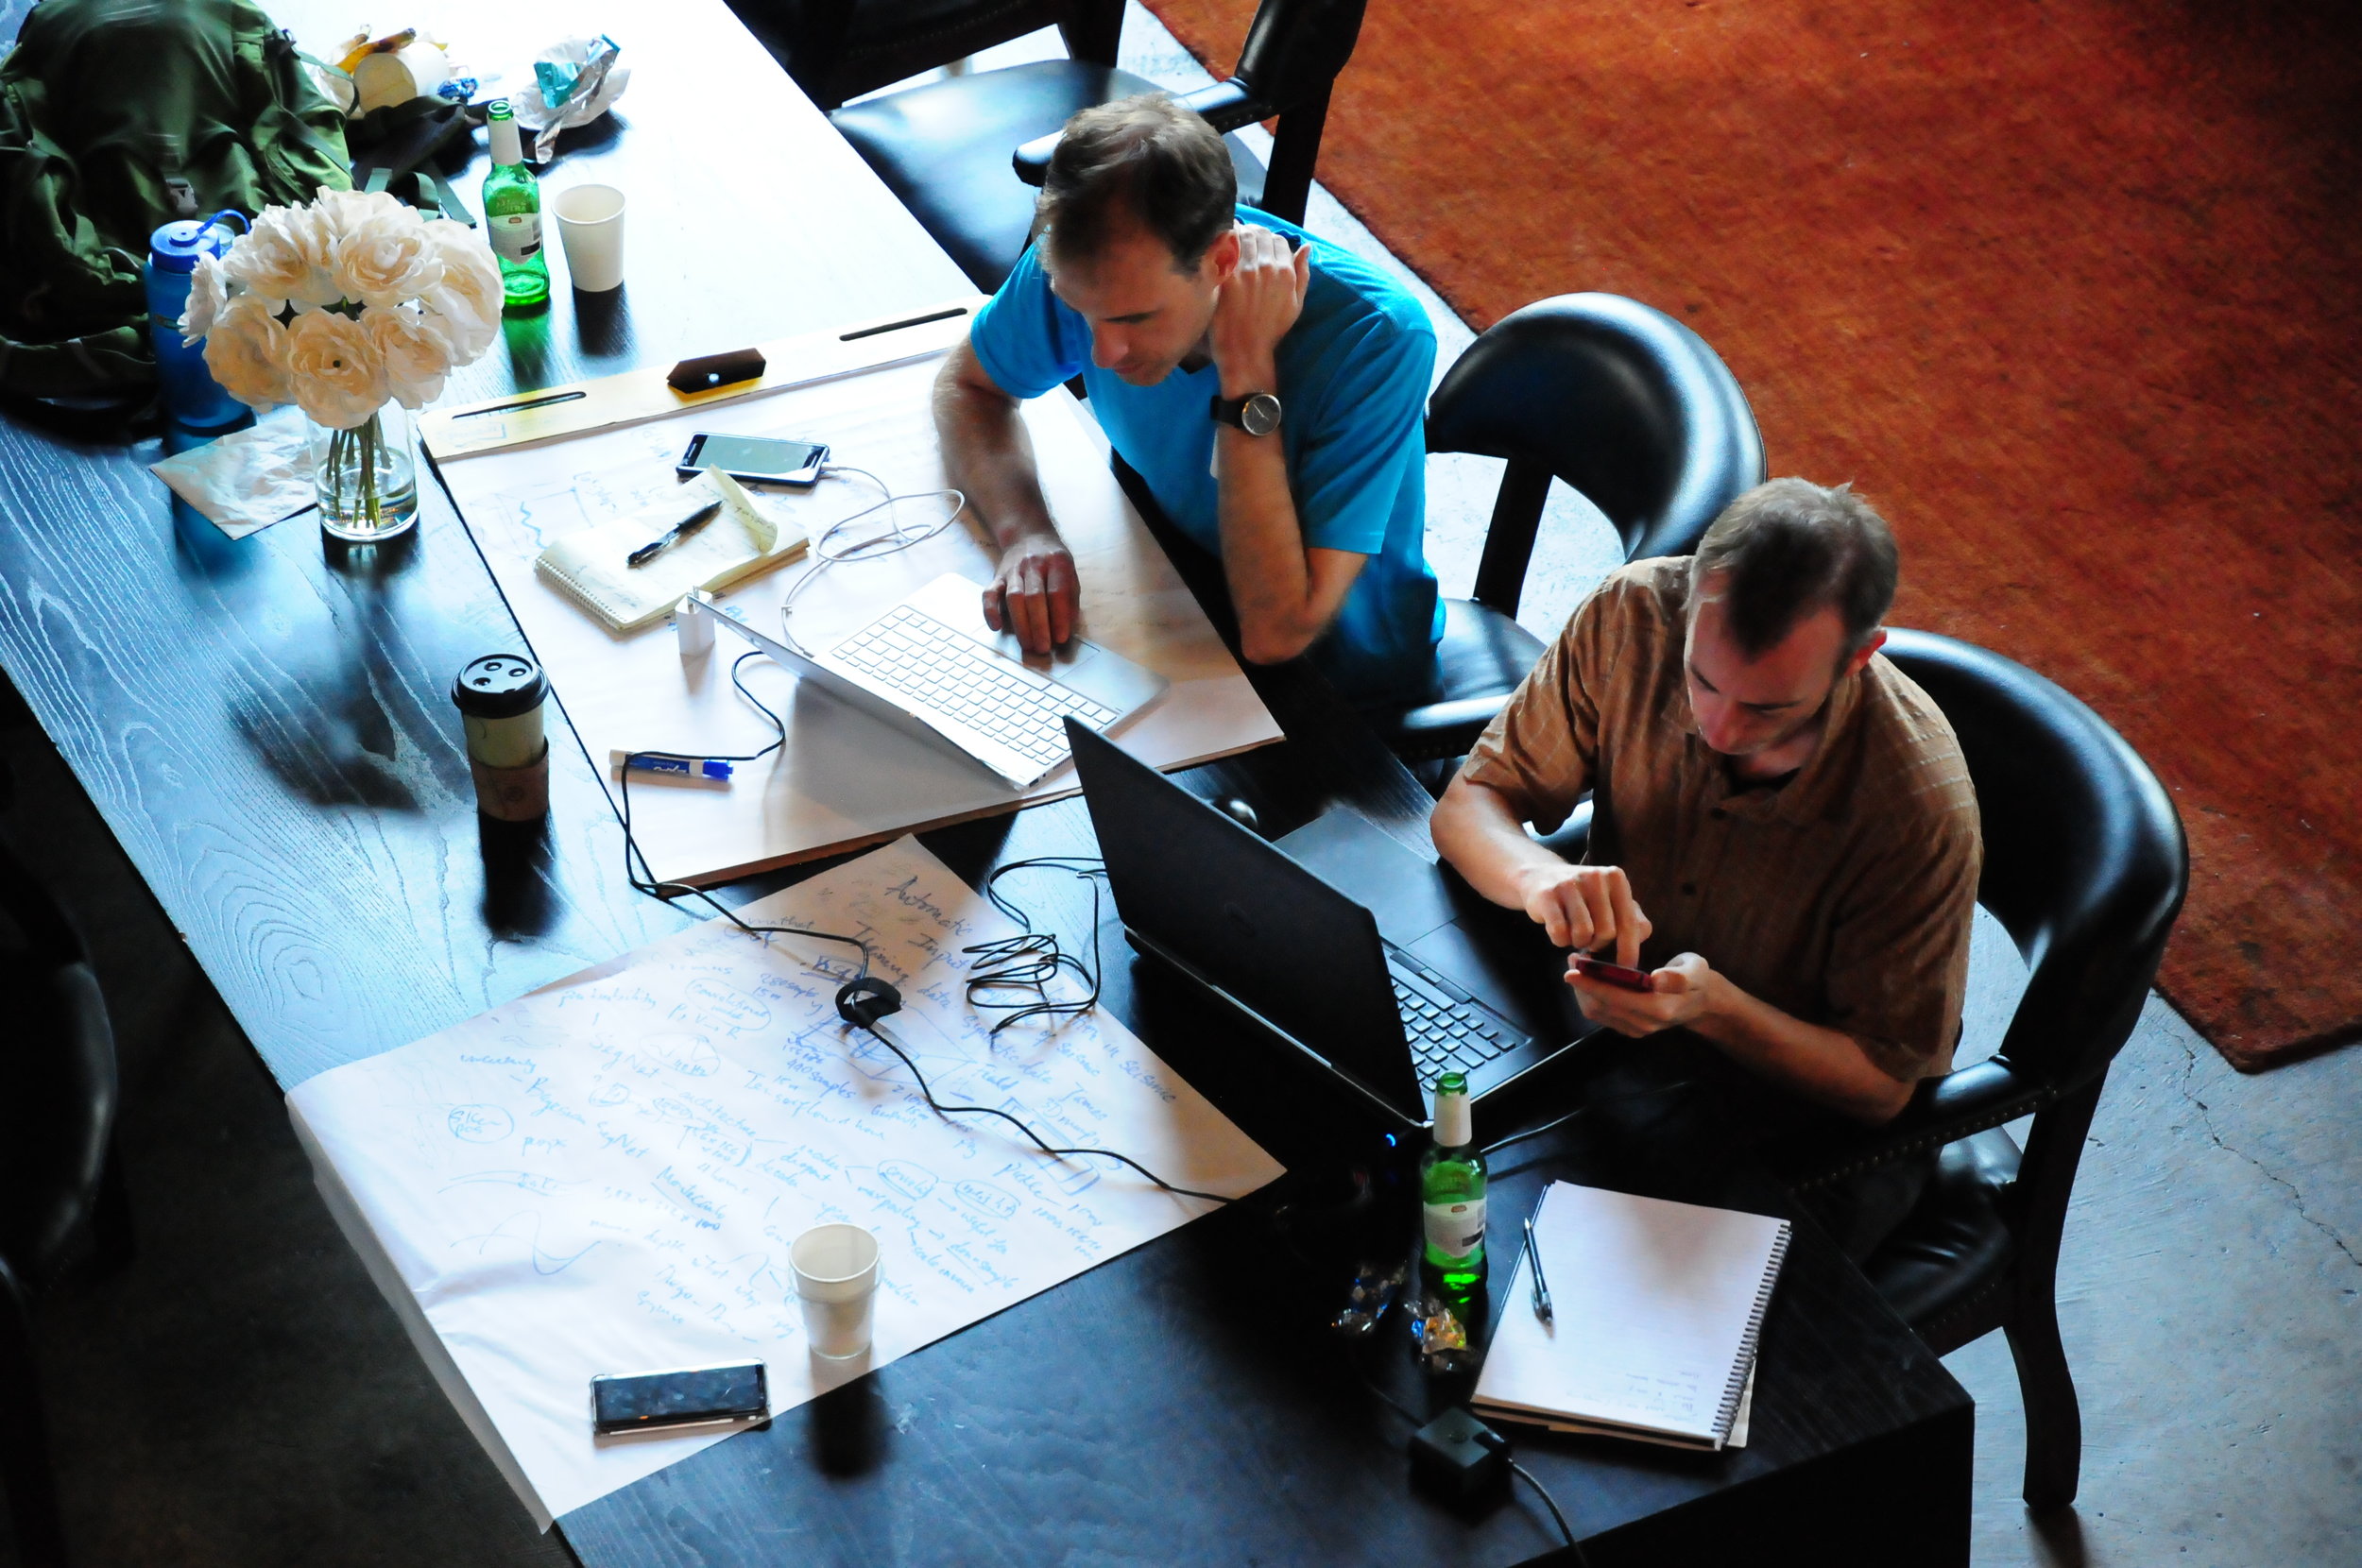
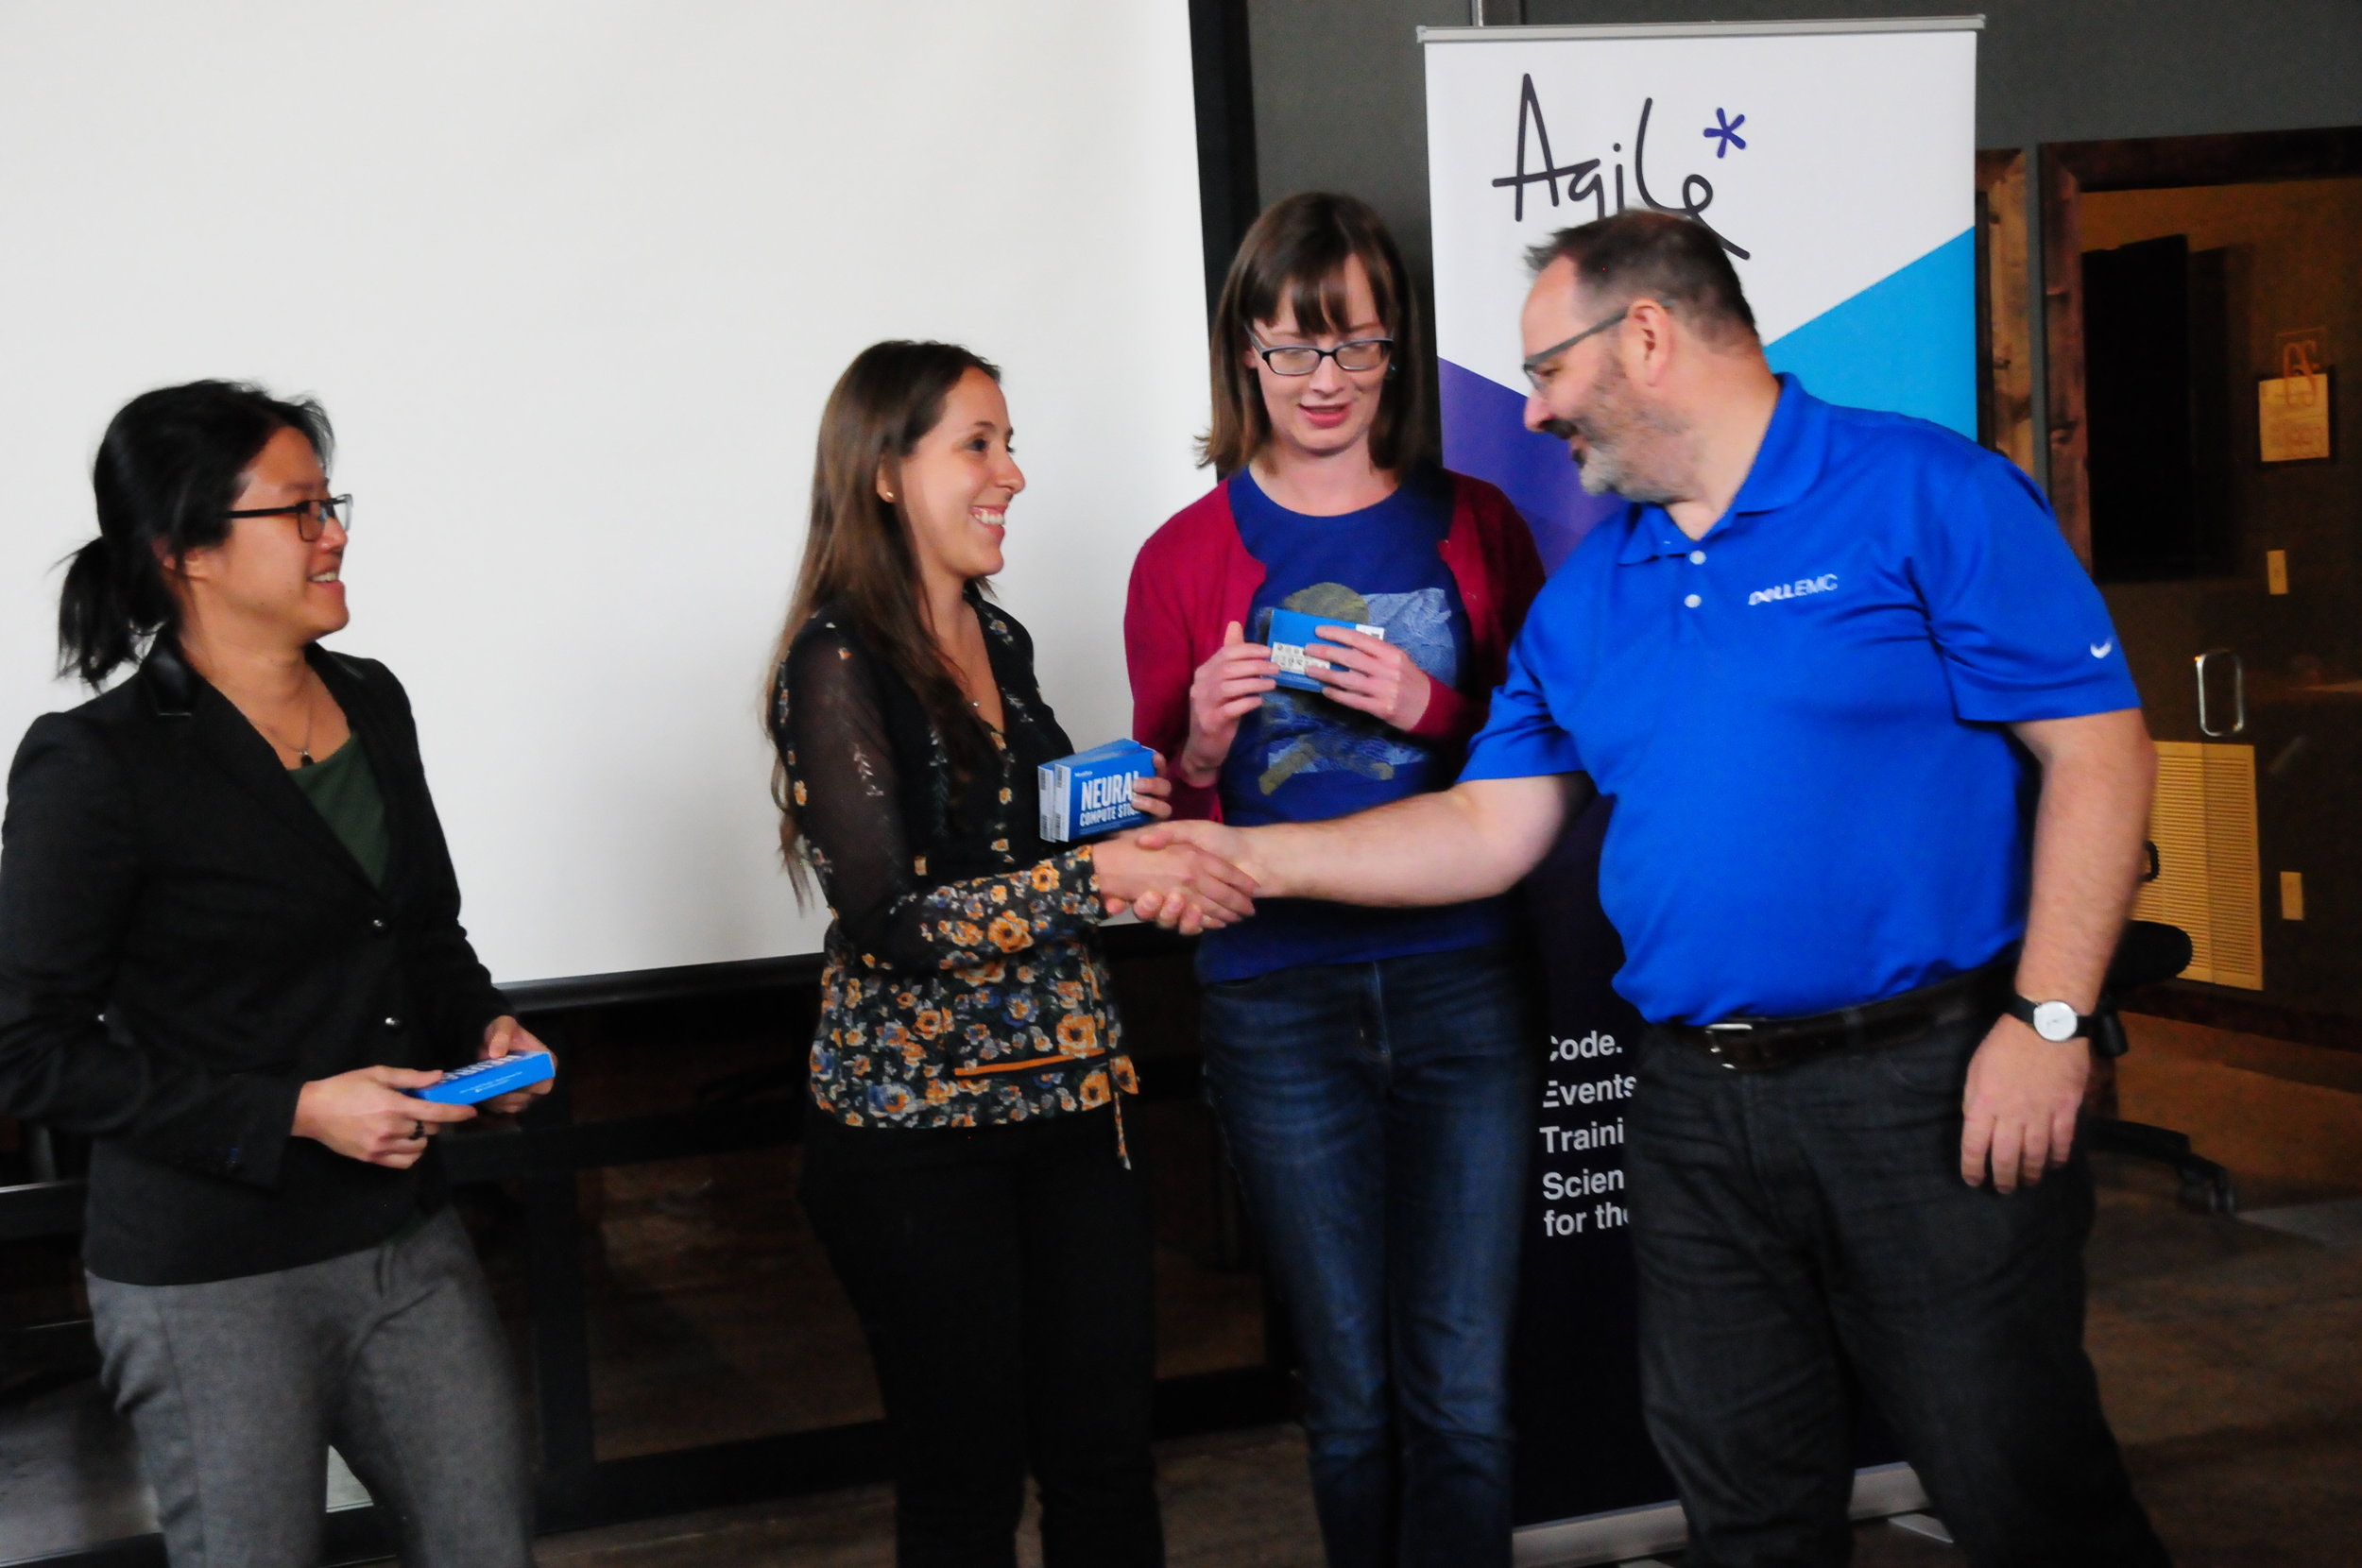
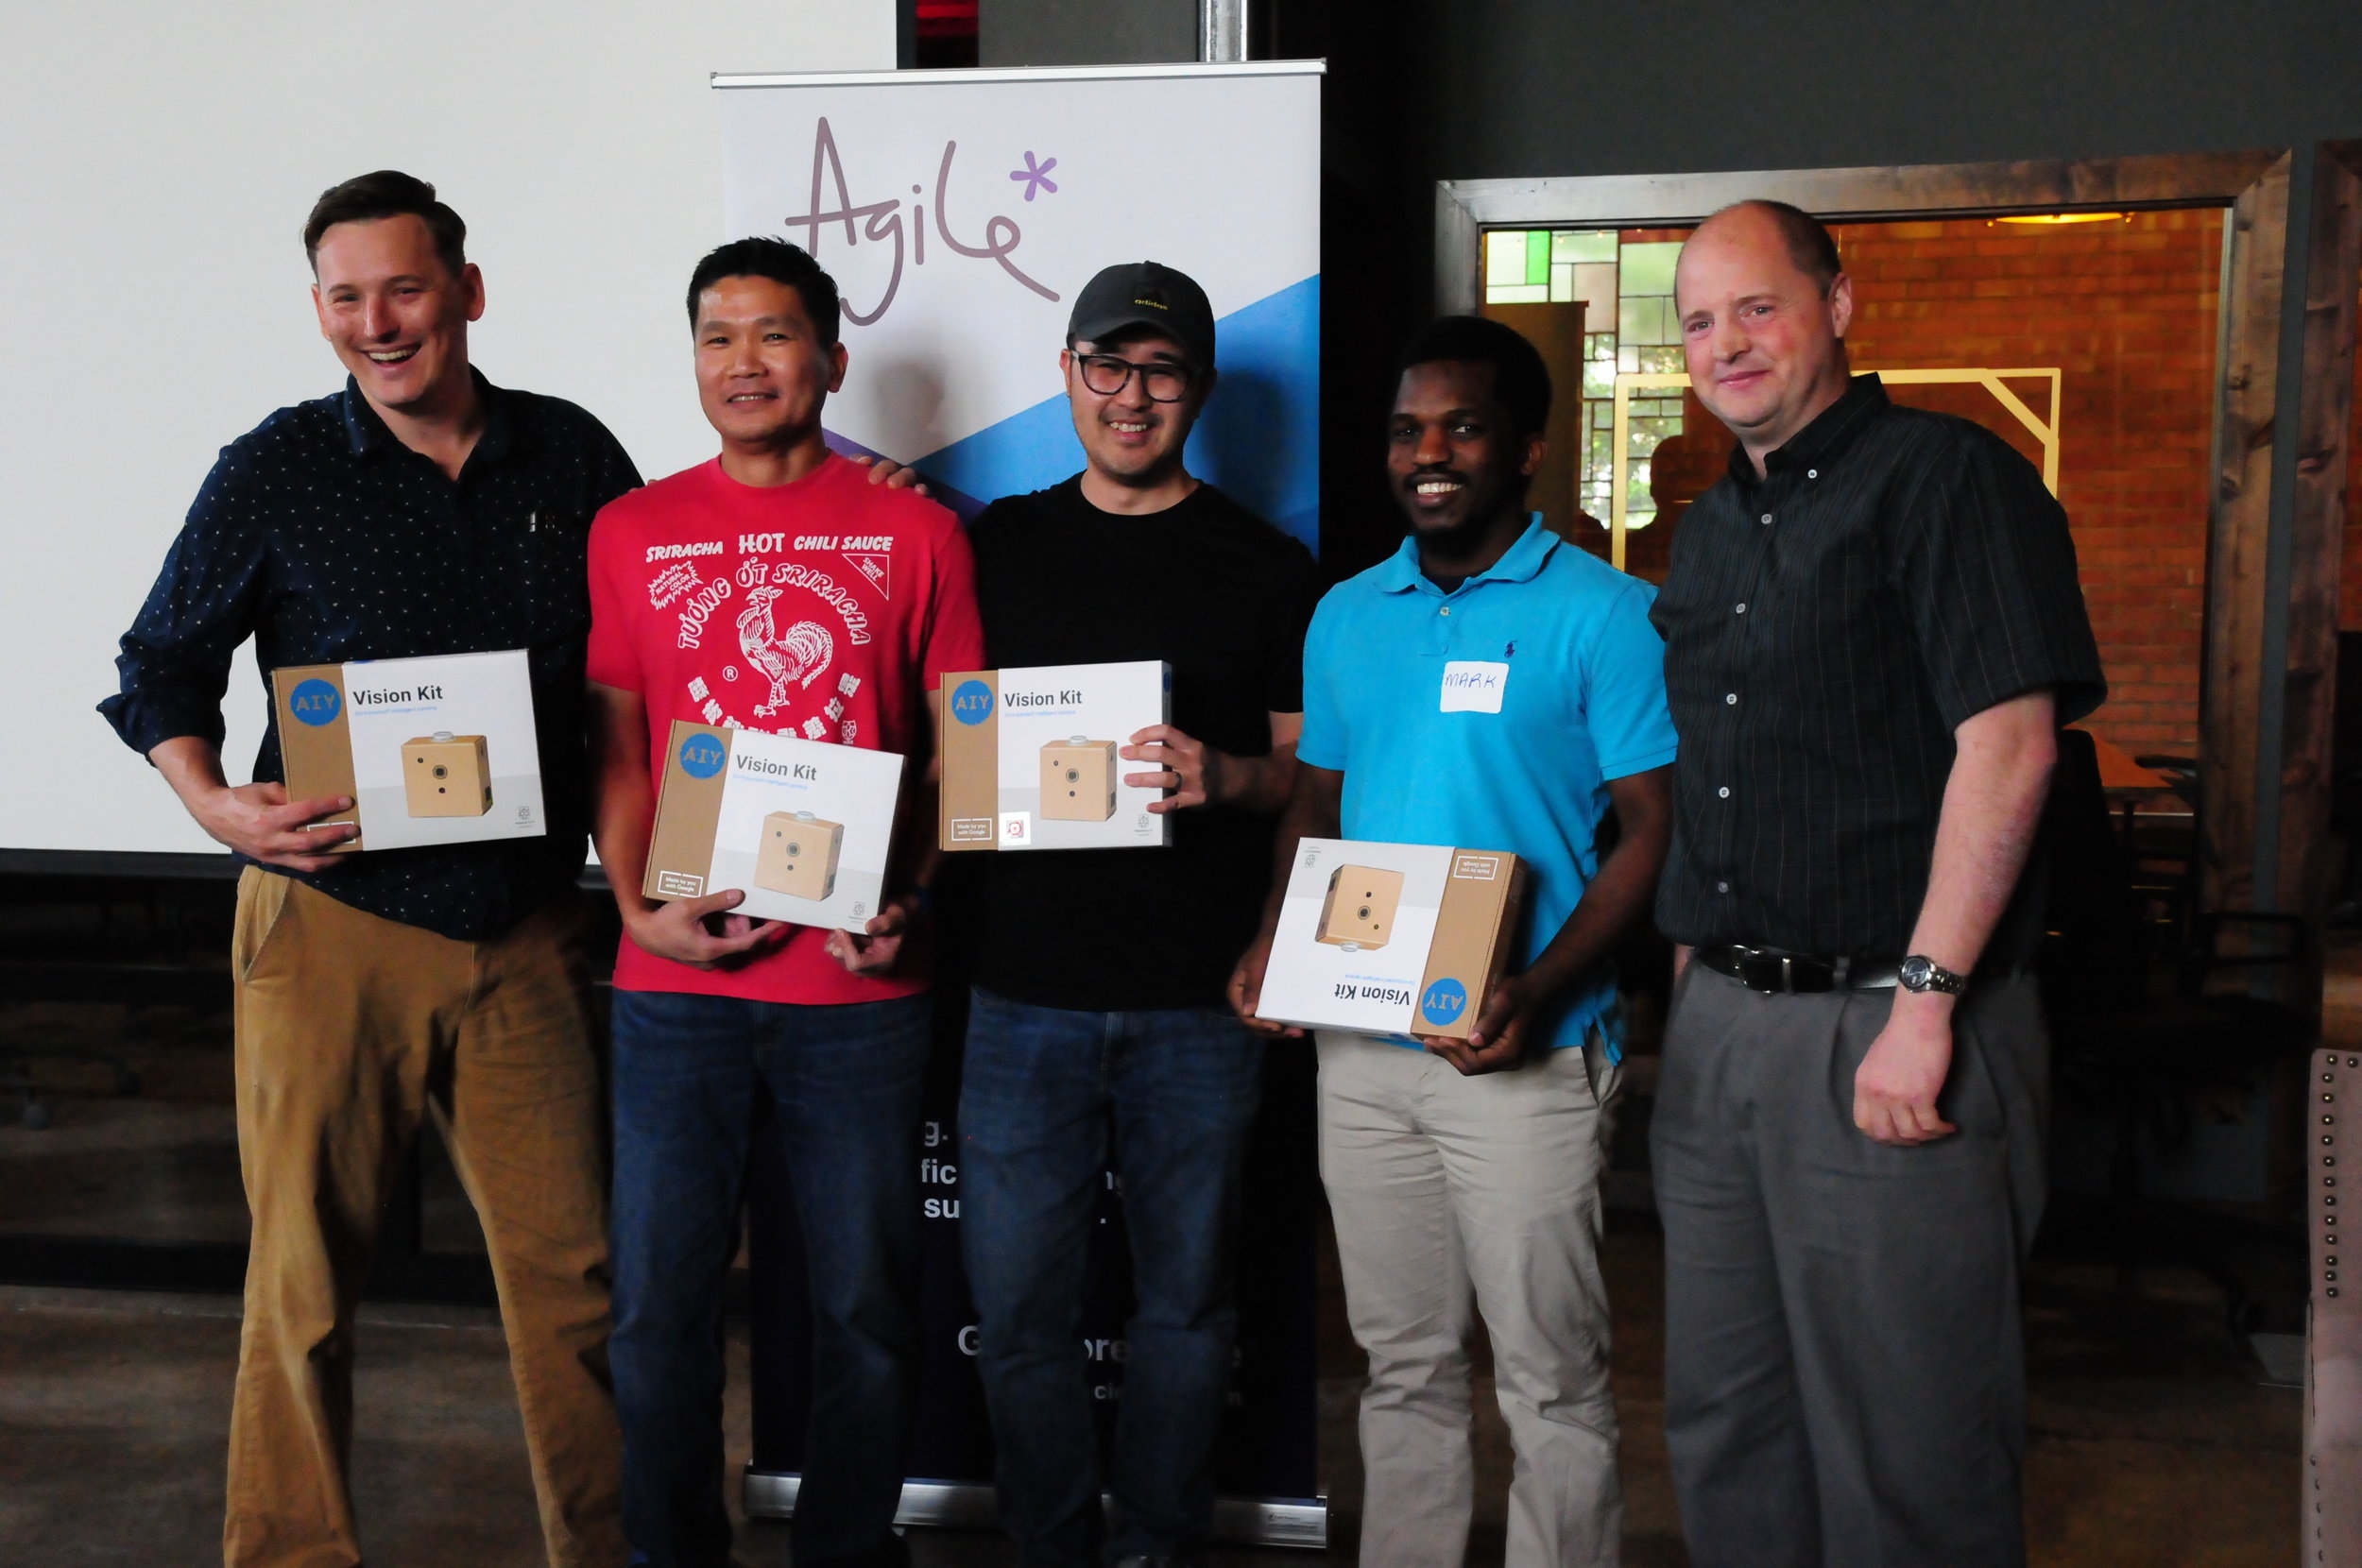
Python demos by the Agile team. Dell EMC also kindly provided lots more Dell Precision workstations for general use. We hooked up some BBC micro:bit microcontrollers, Microsoft Azure IoT DevKits, and other bits and bobs, and showed anyone who would listen what you can do with a few lines of Python. Thank you to Carlos da Costa (University of Edinburgh) for helping out!
Tech demos by engineers from Intel and INT. Both companies are very active in visualization research and generously spent time showing visitors their technology.

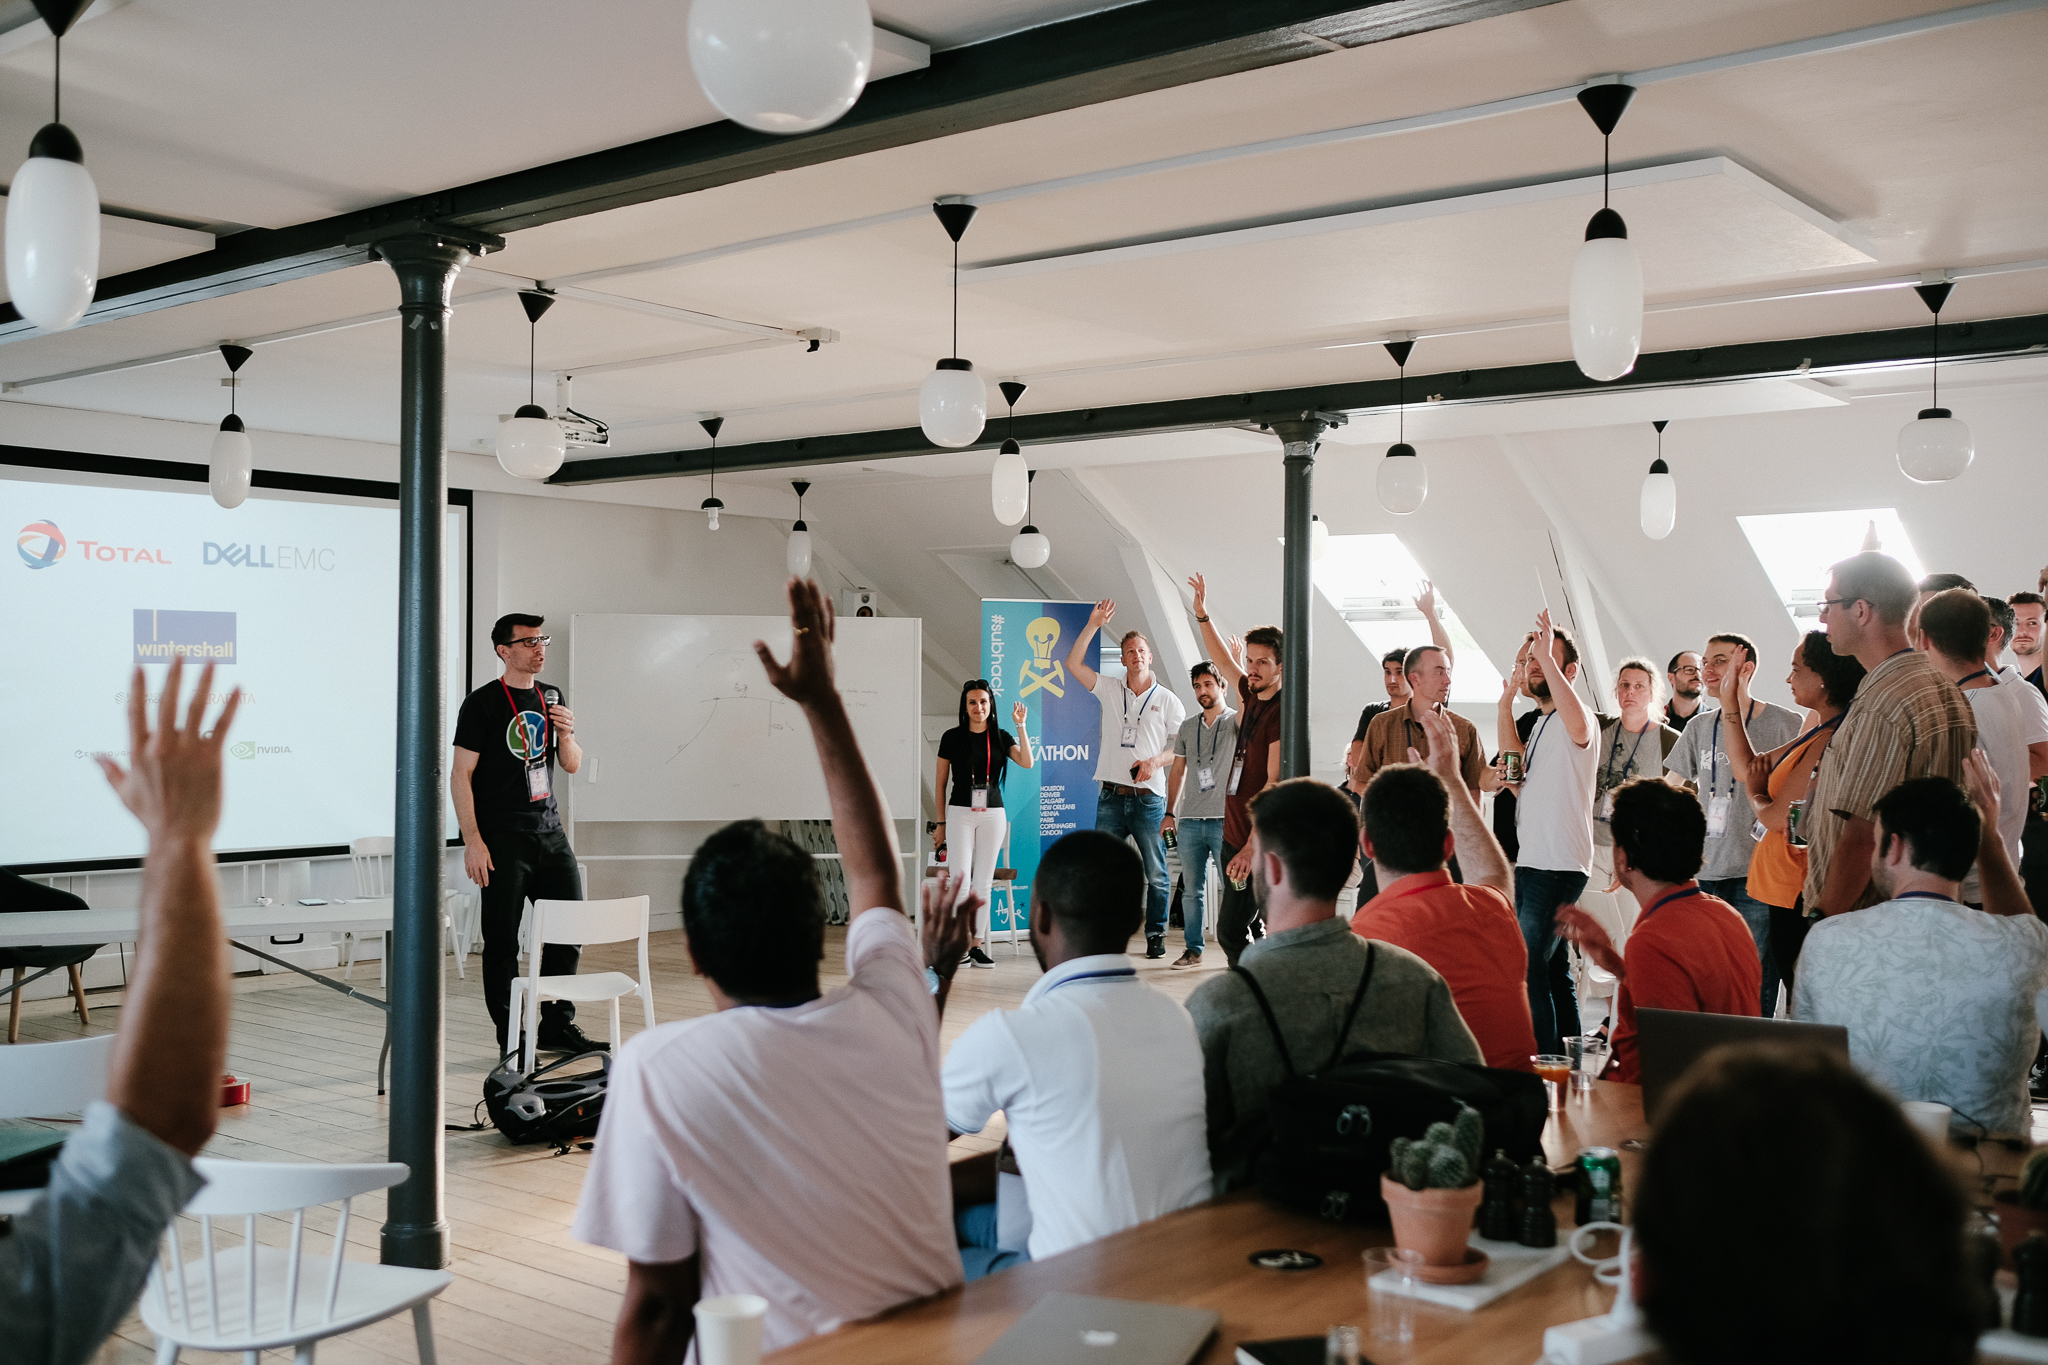
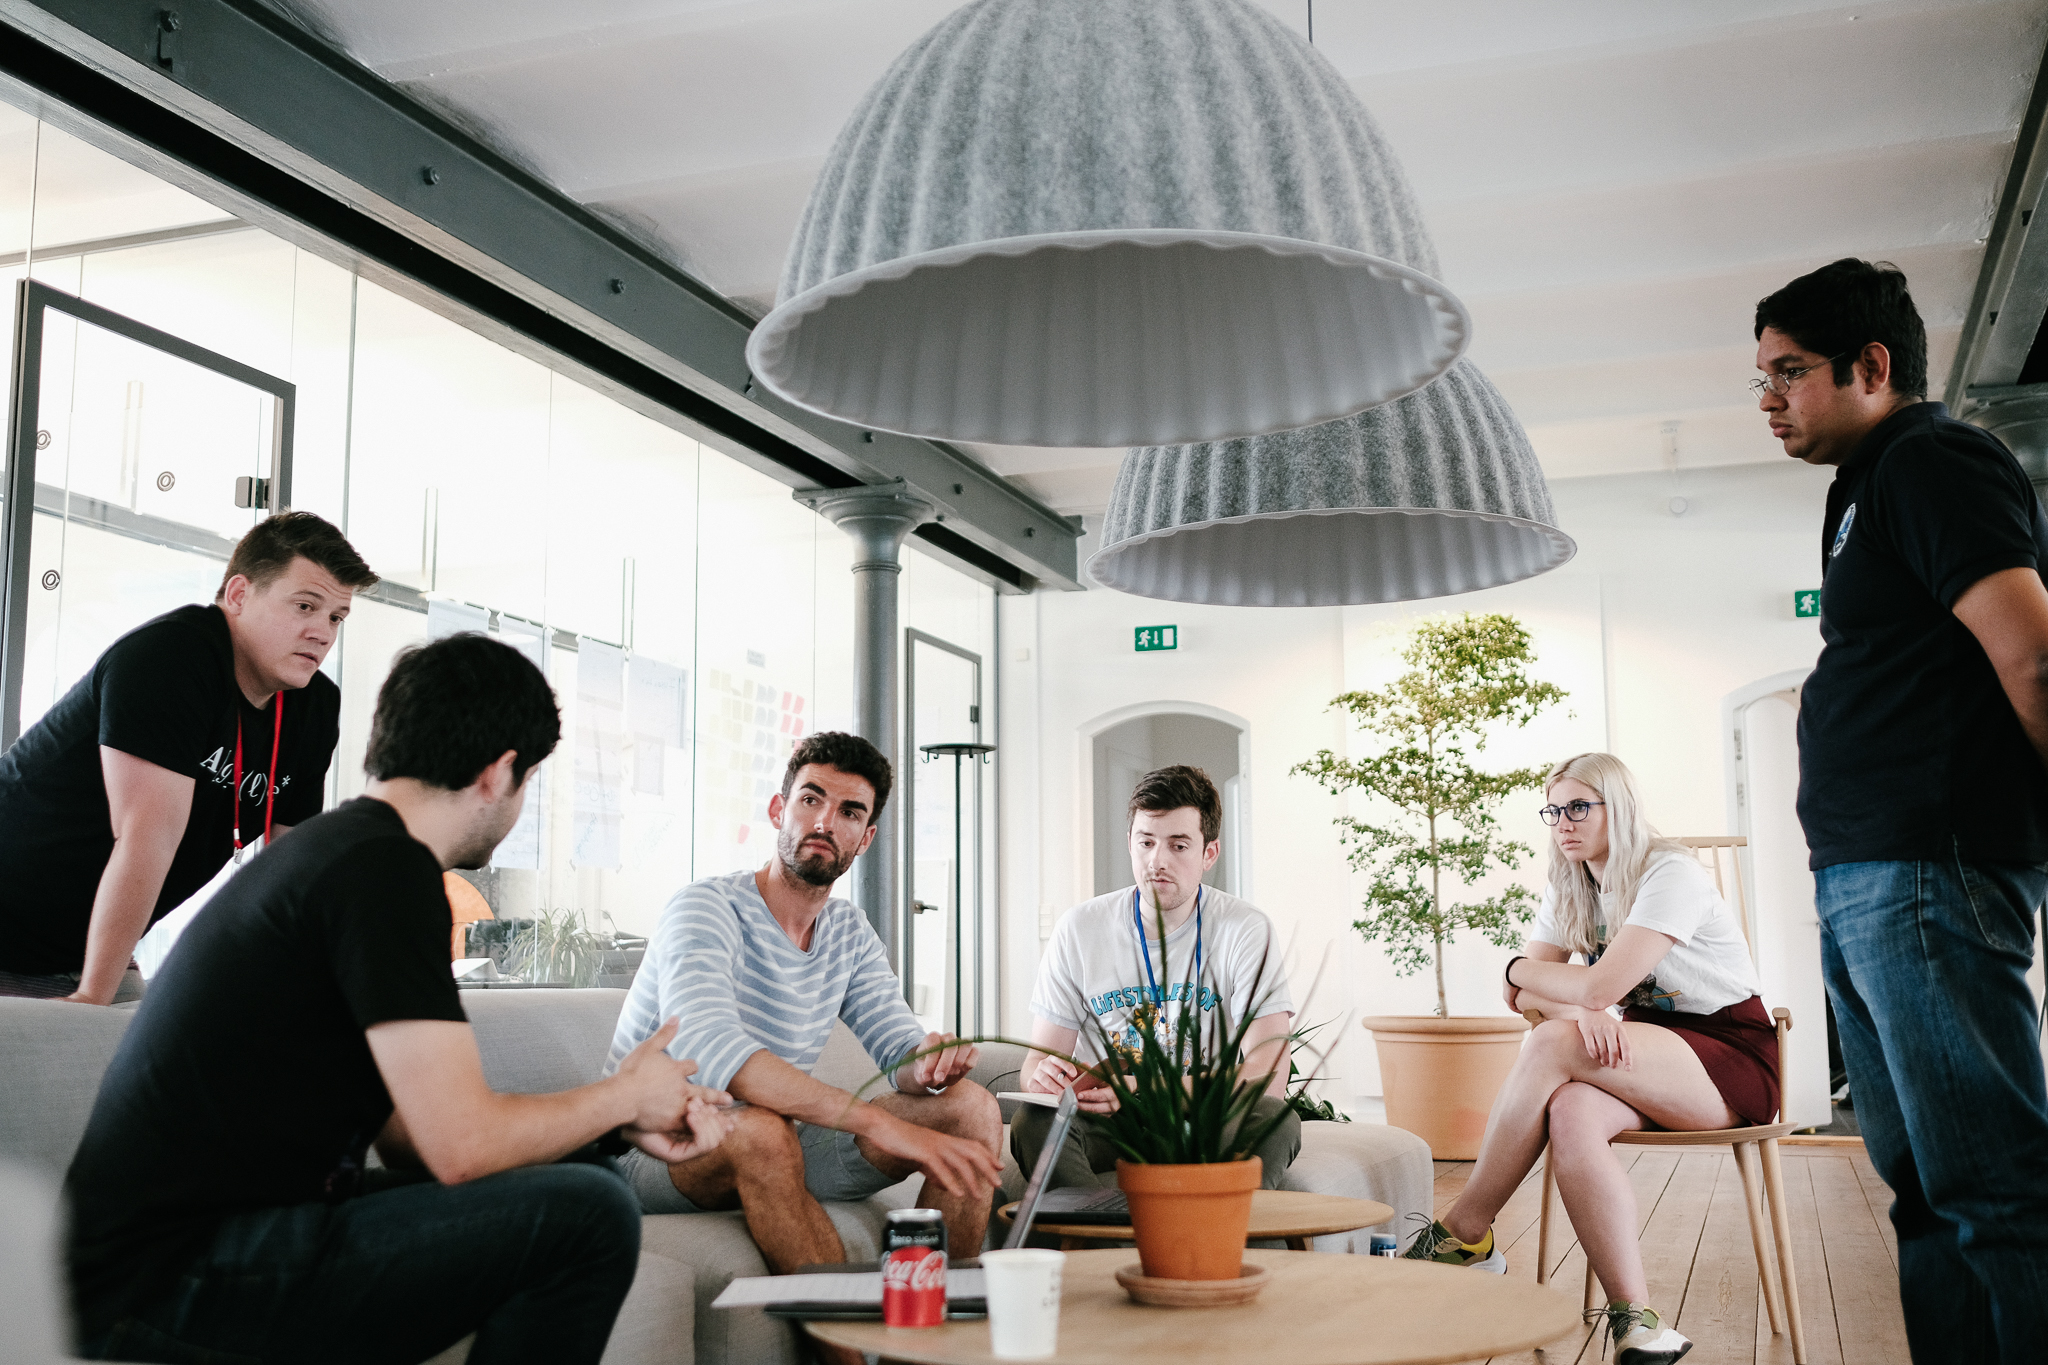
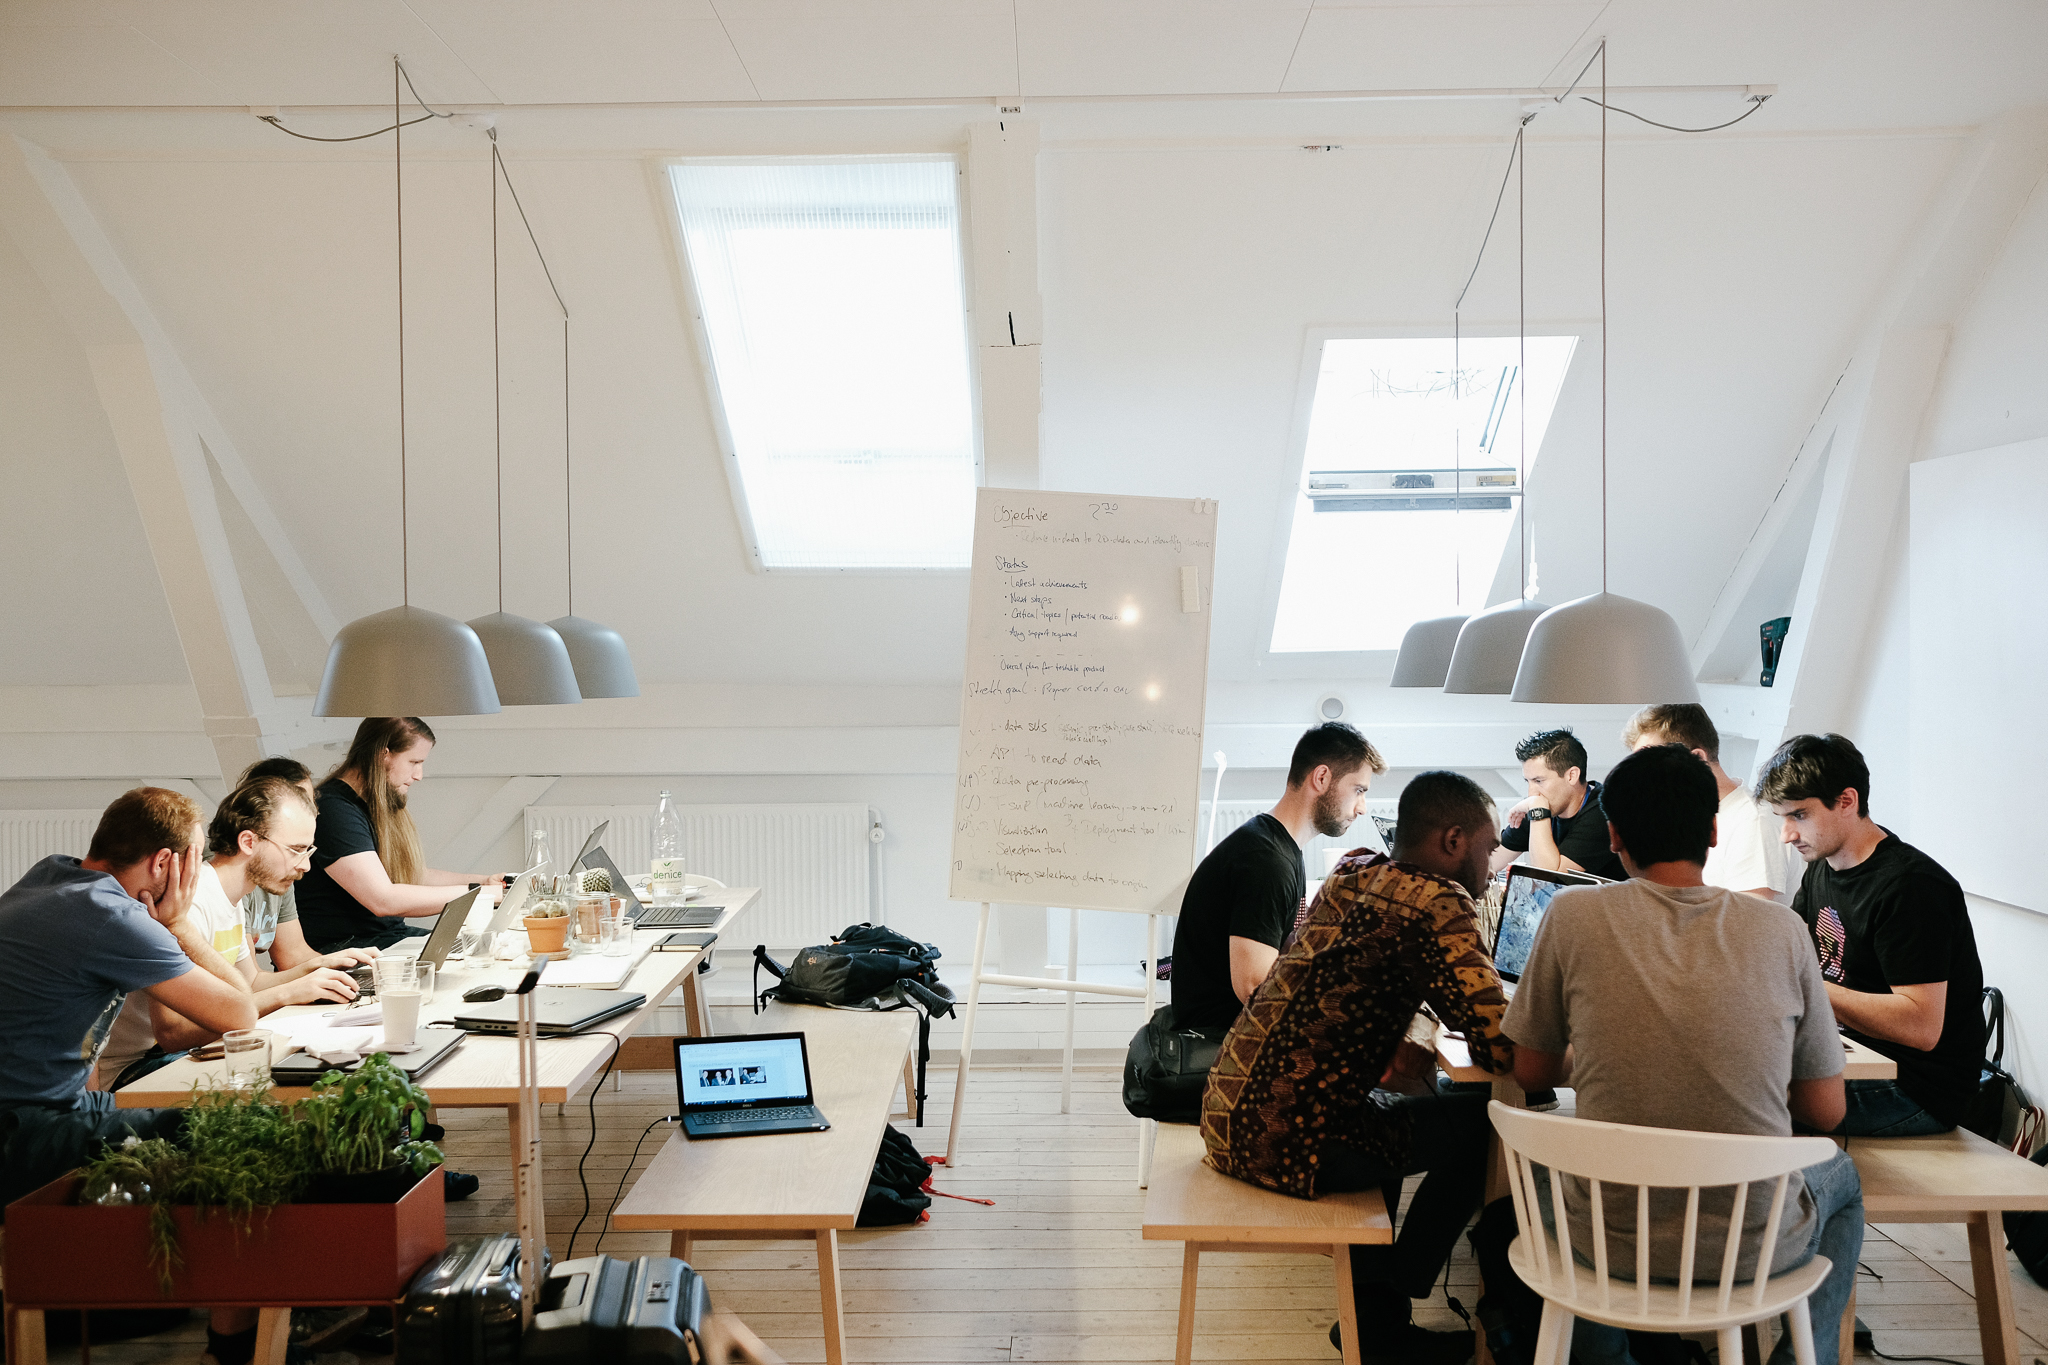
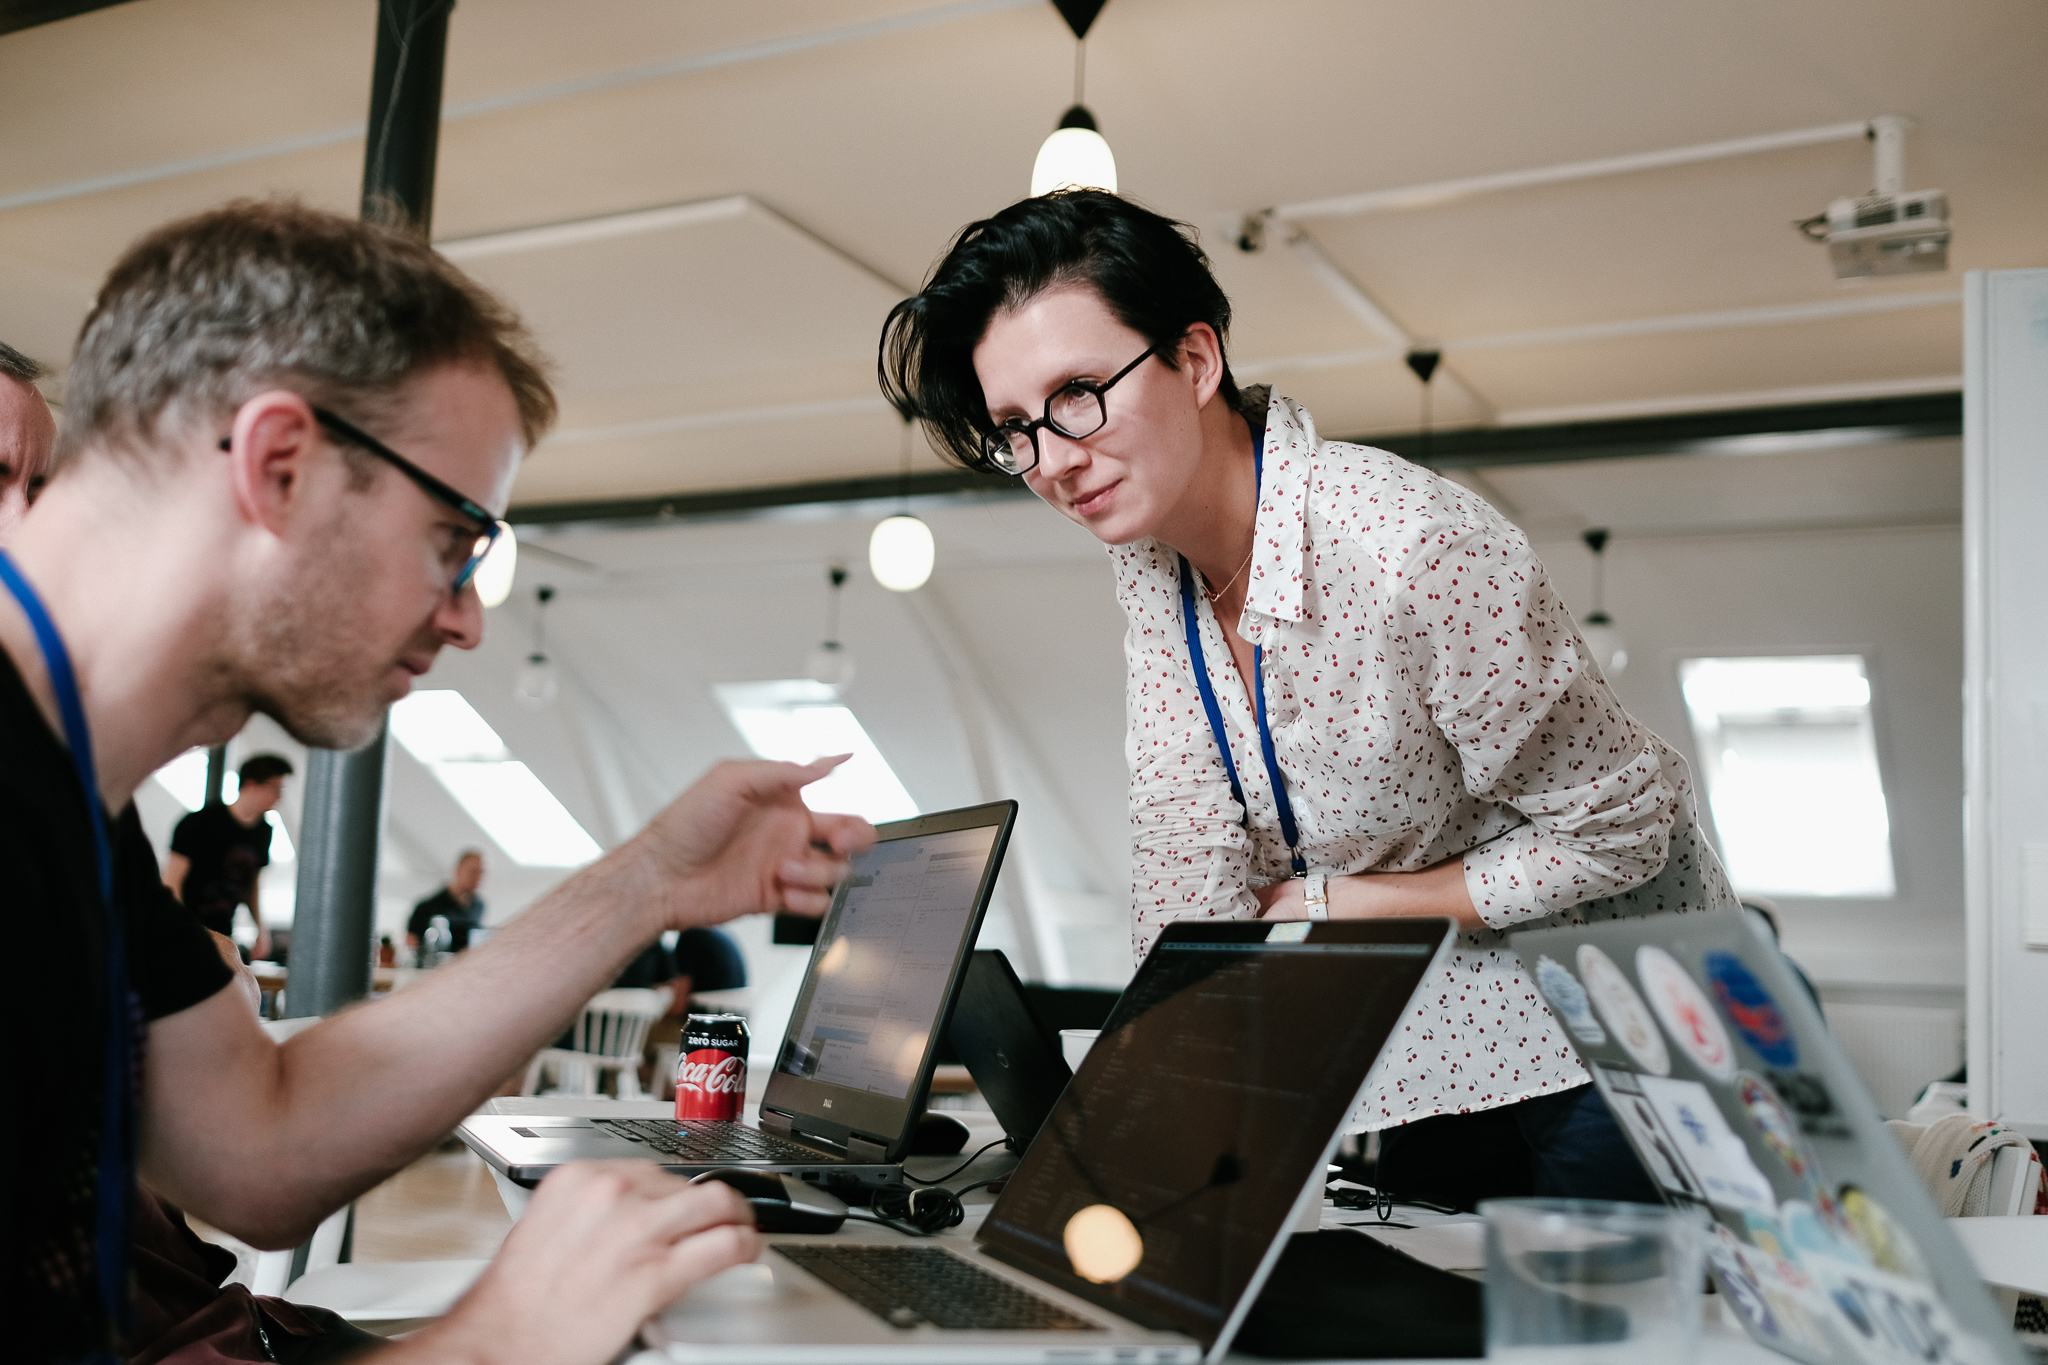
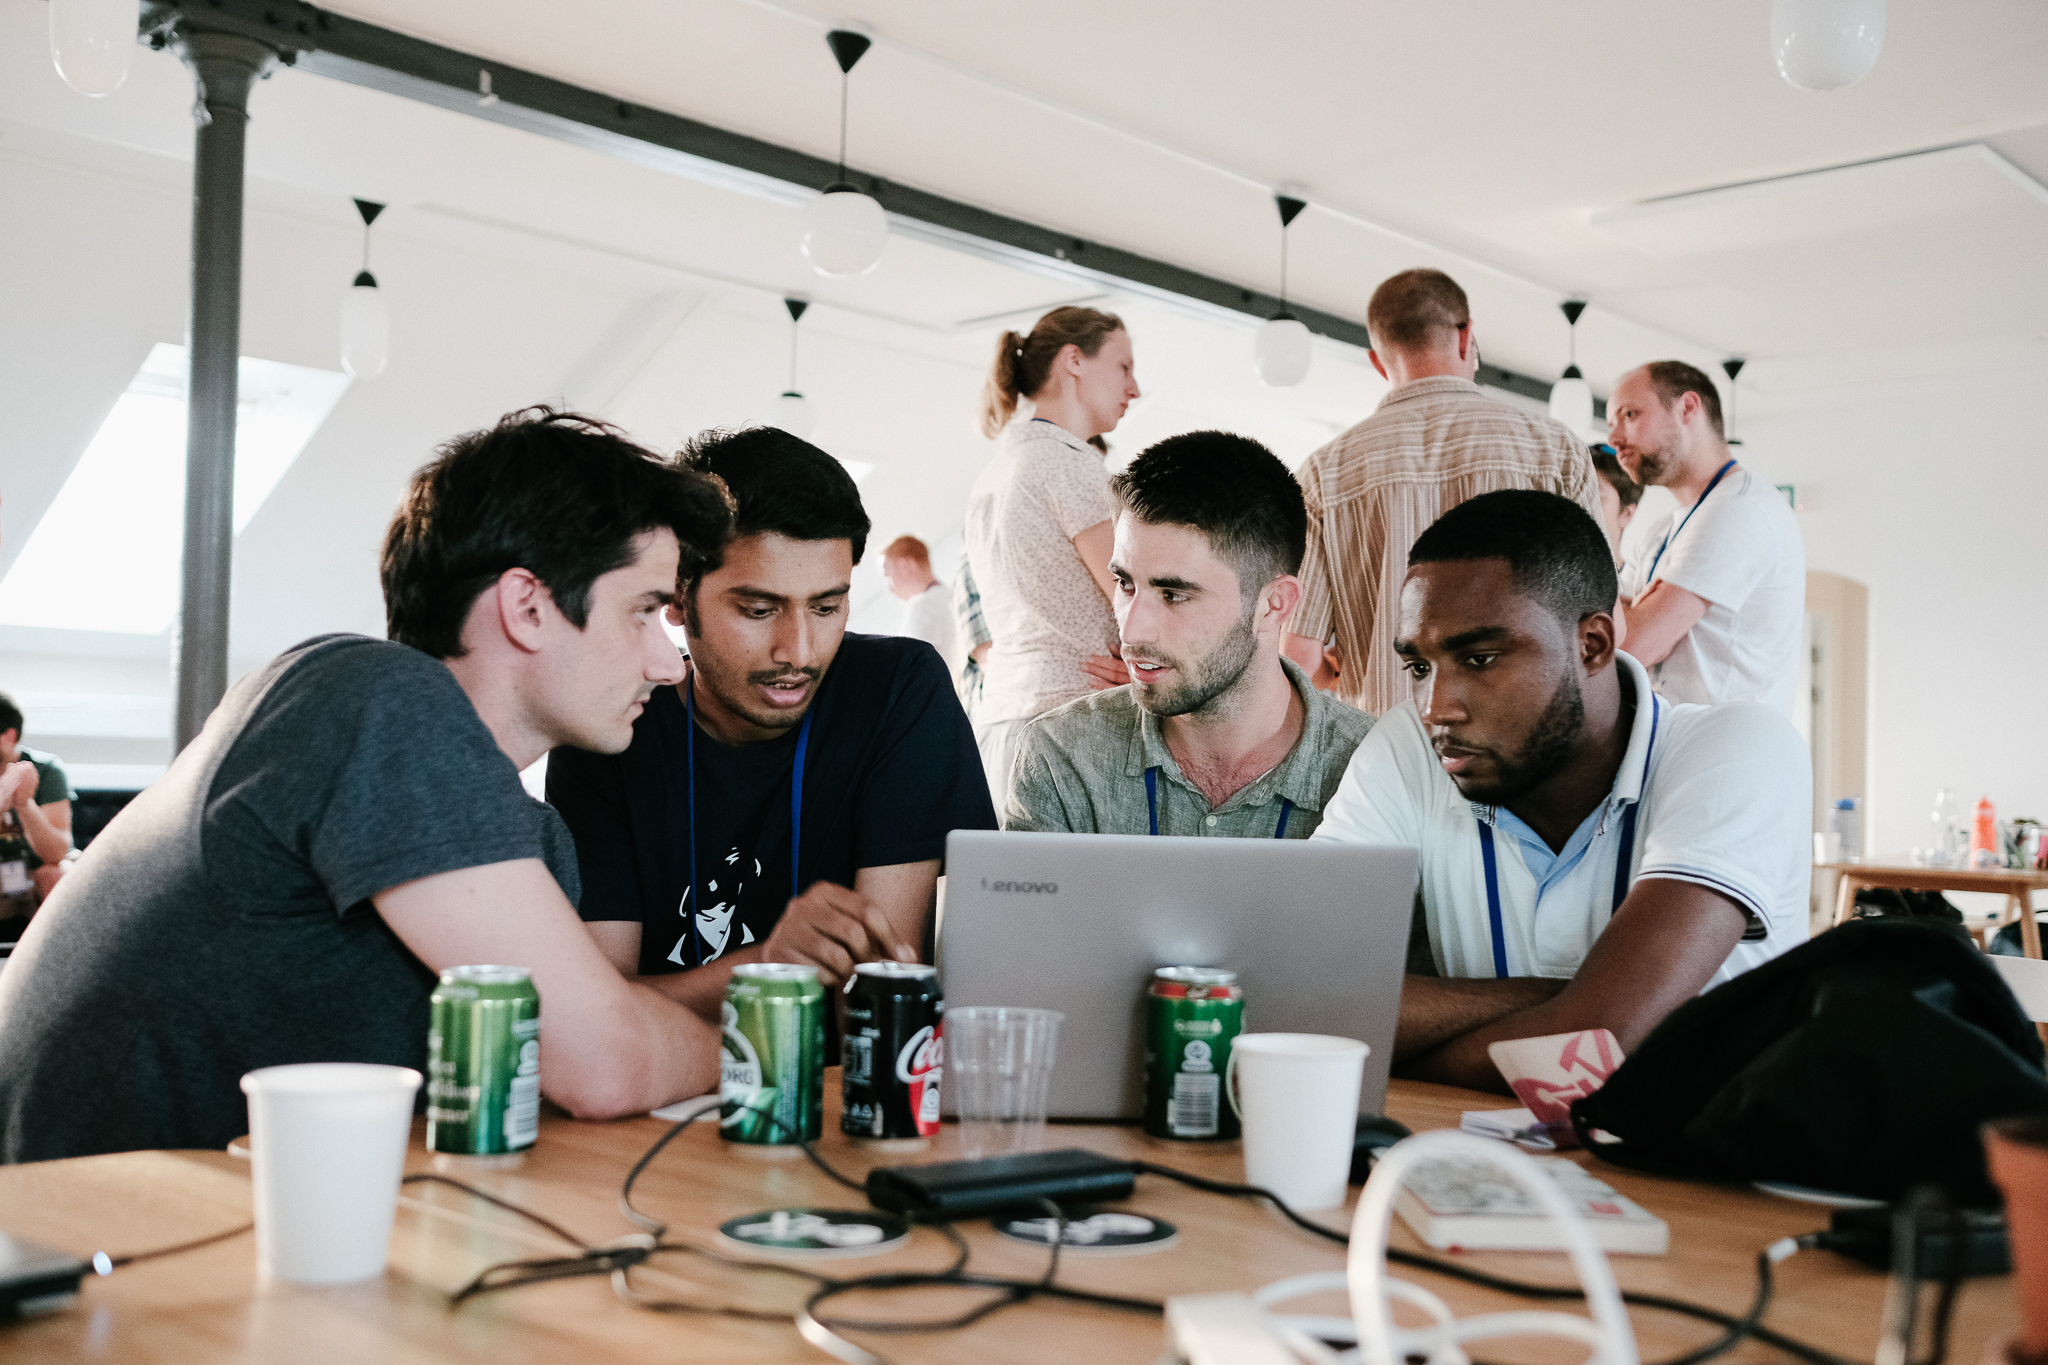
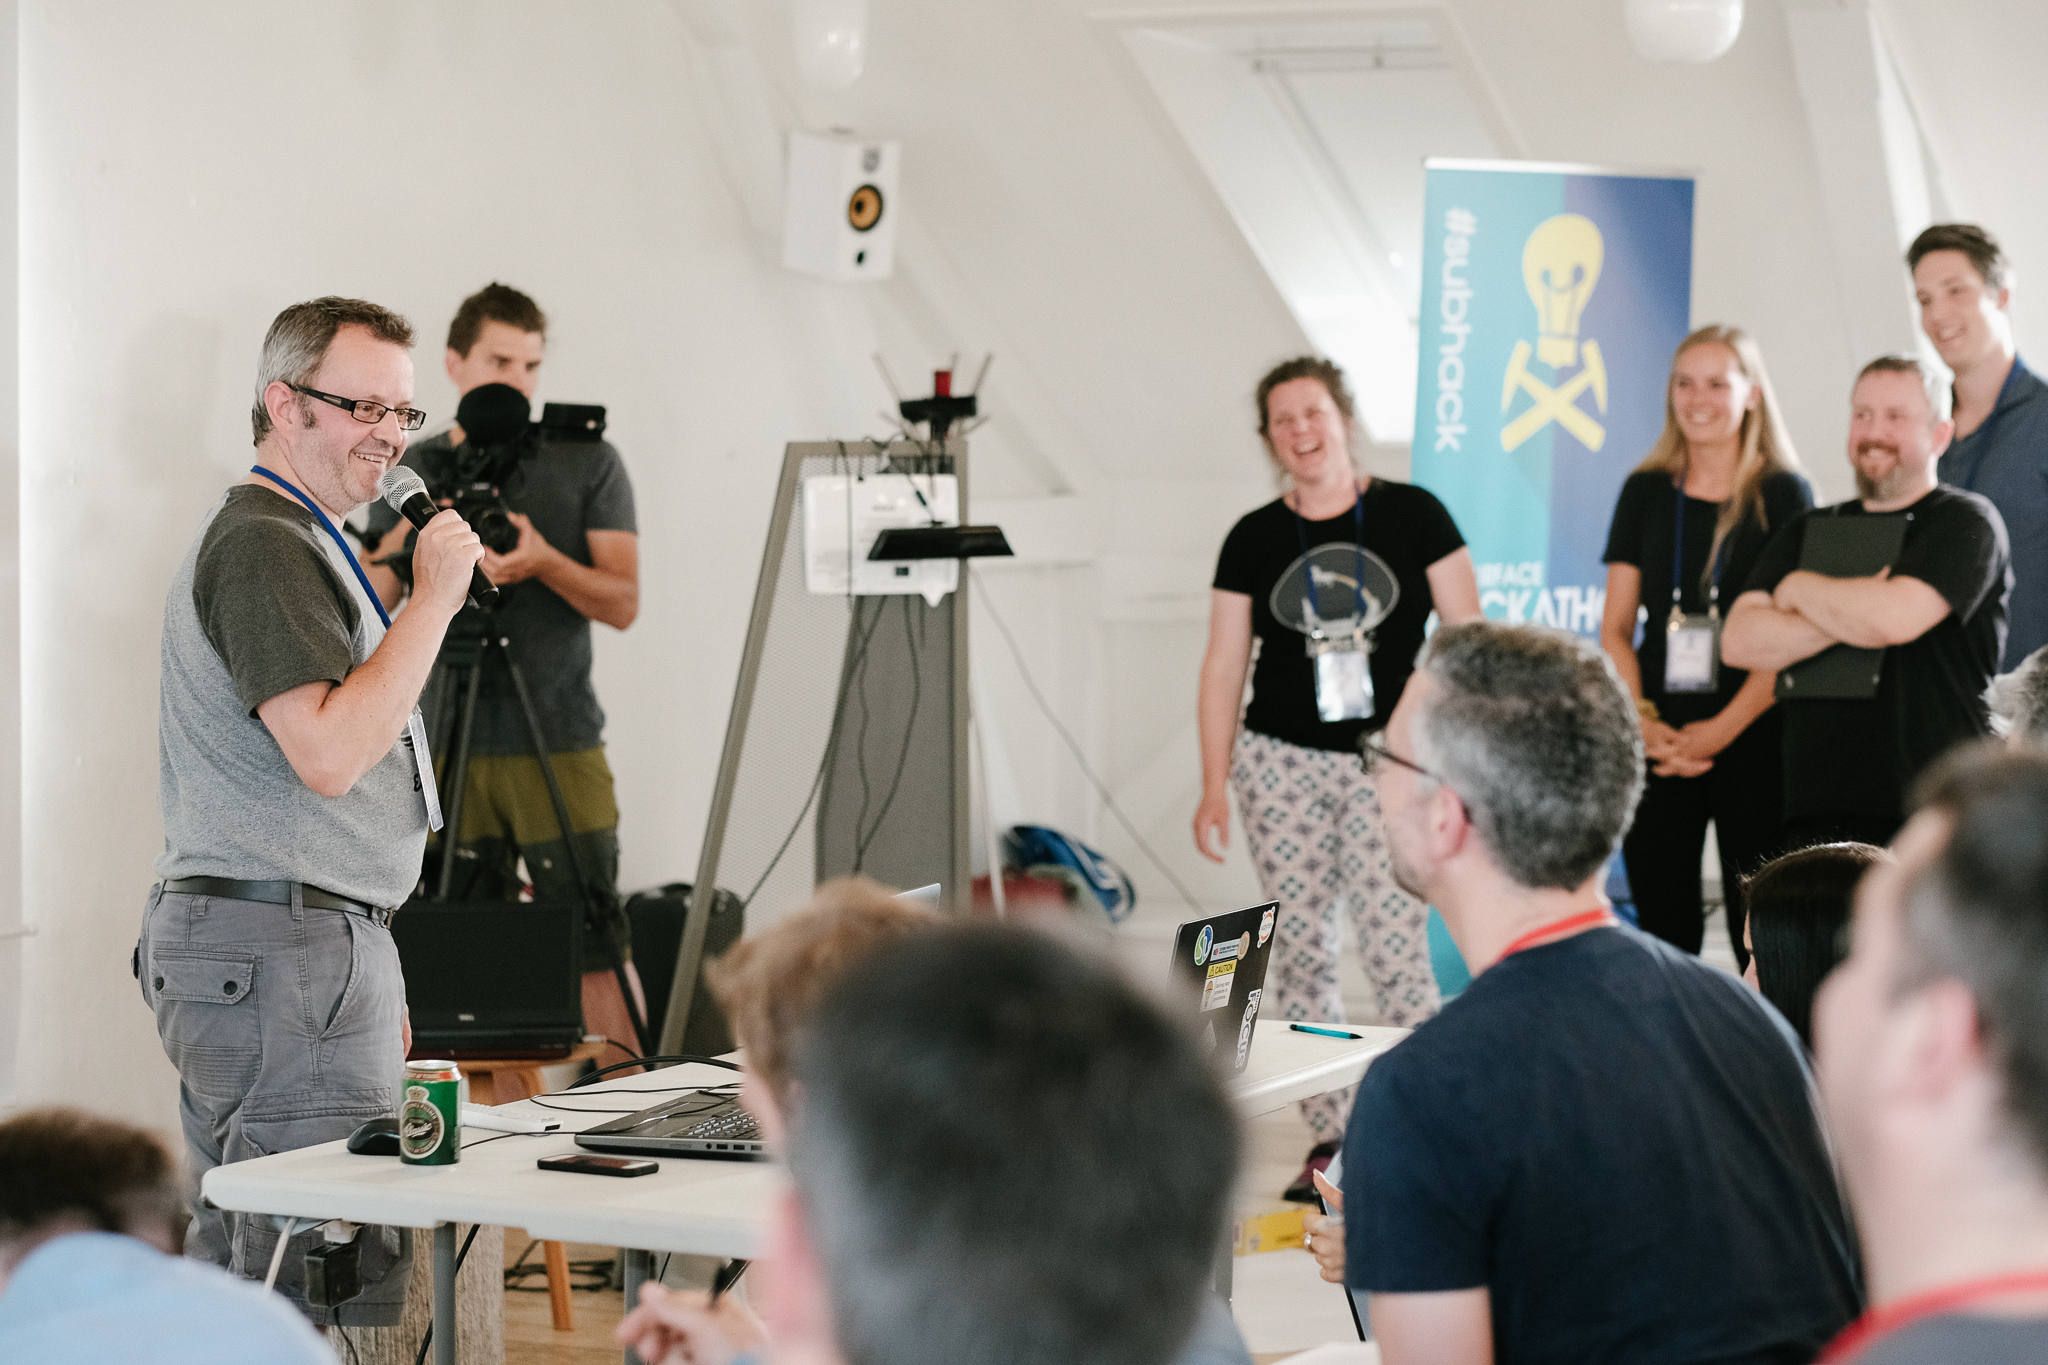
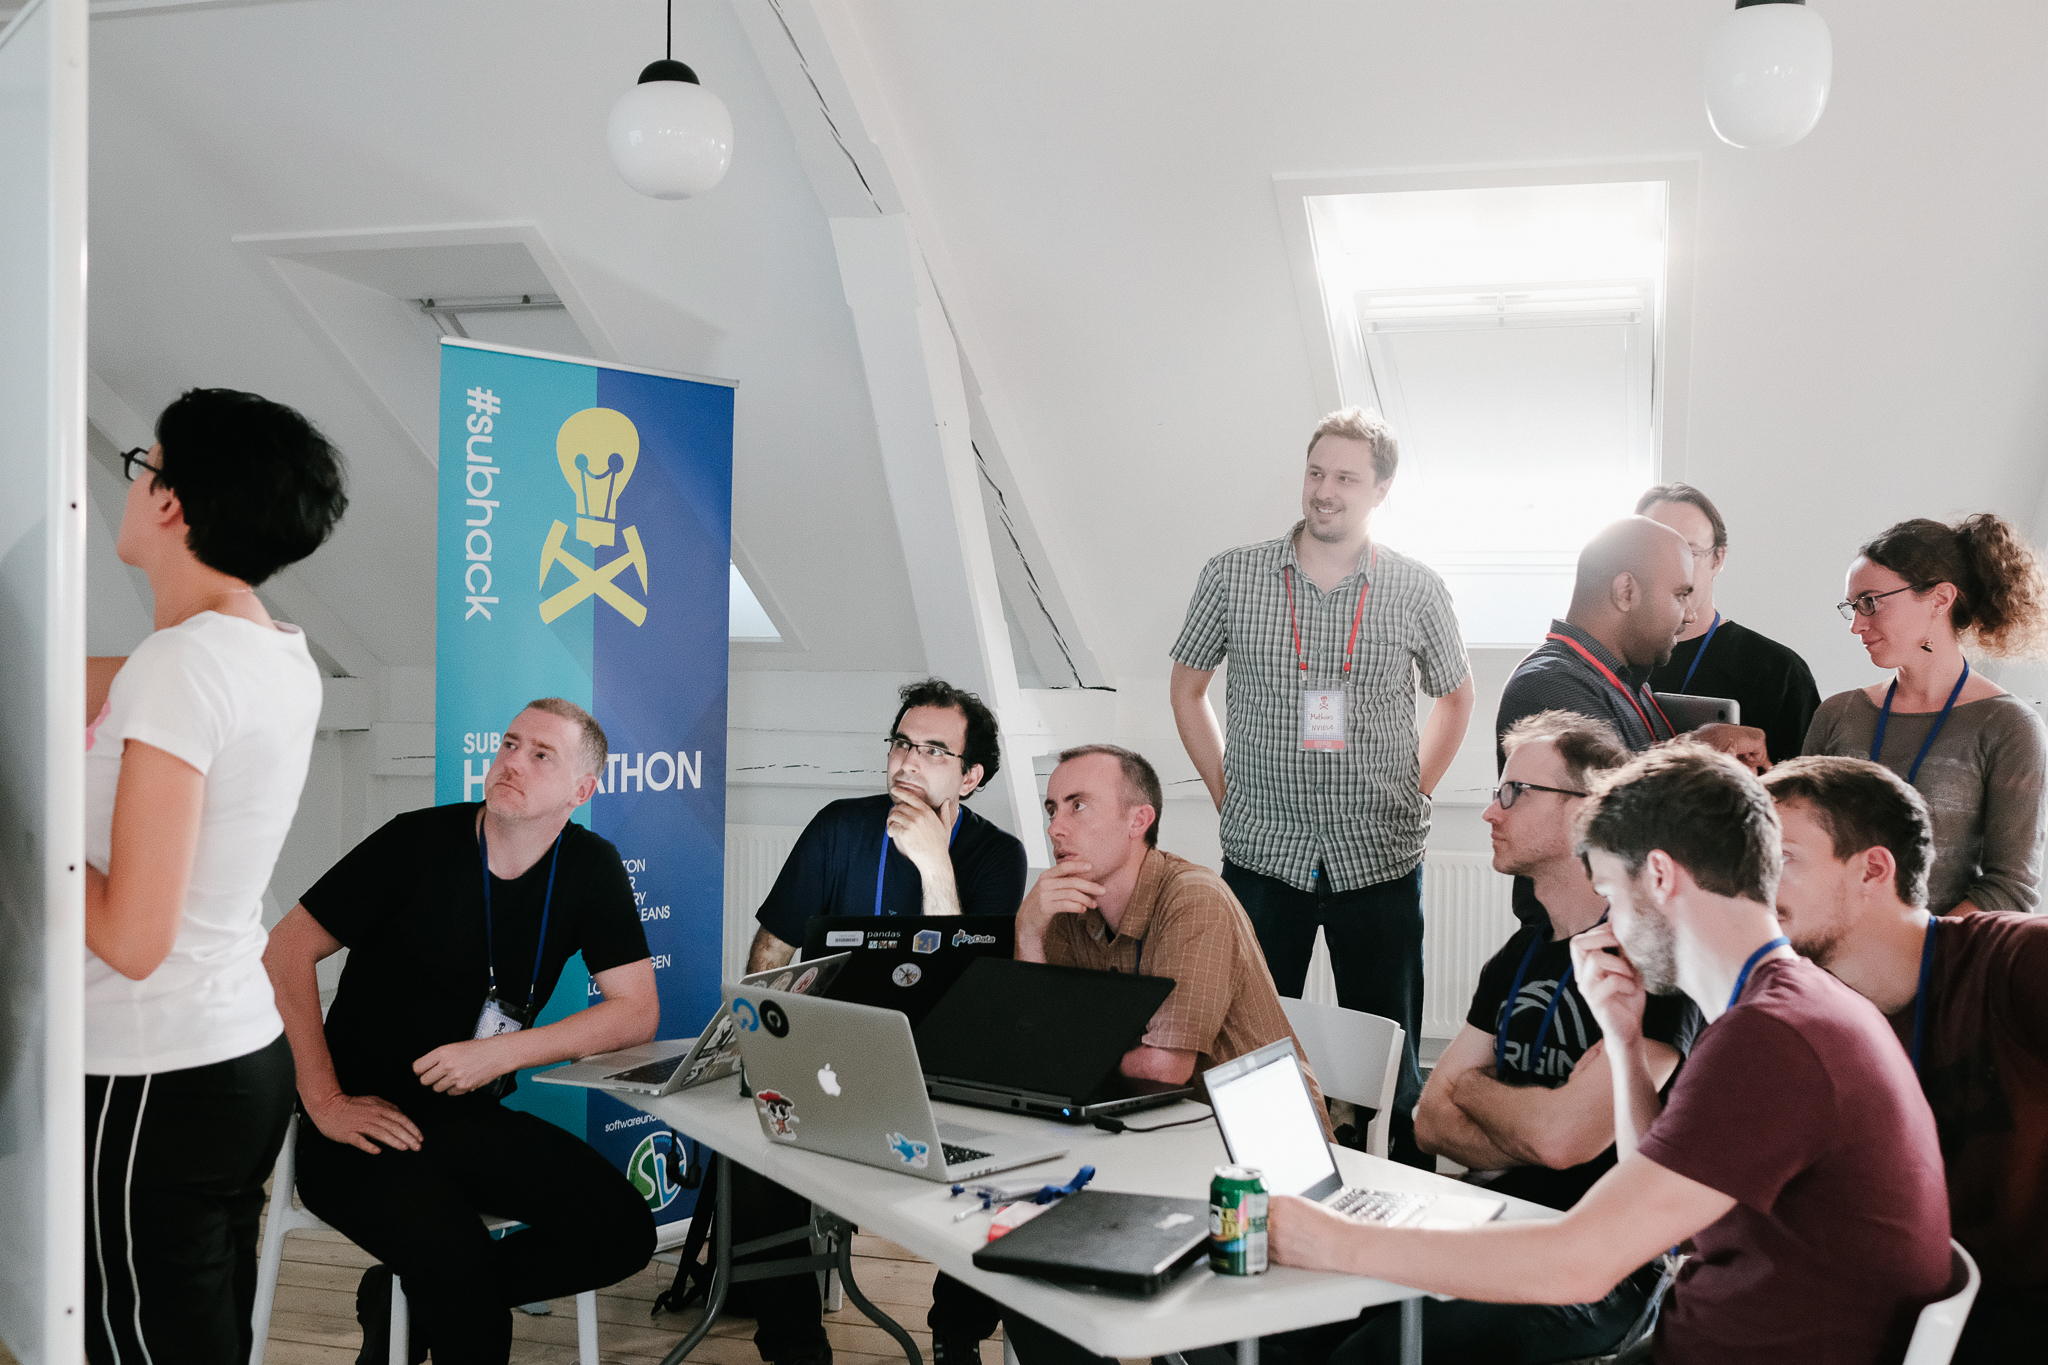
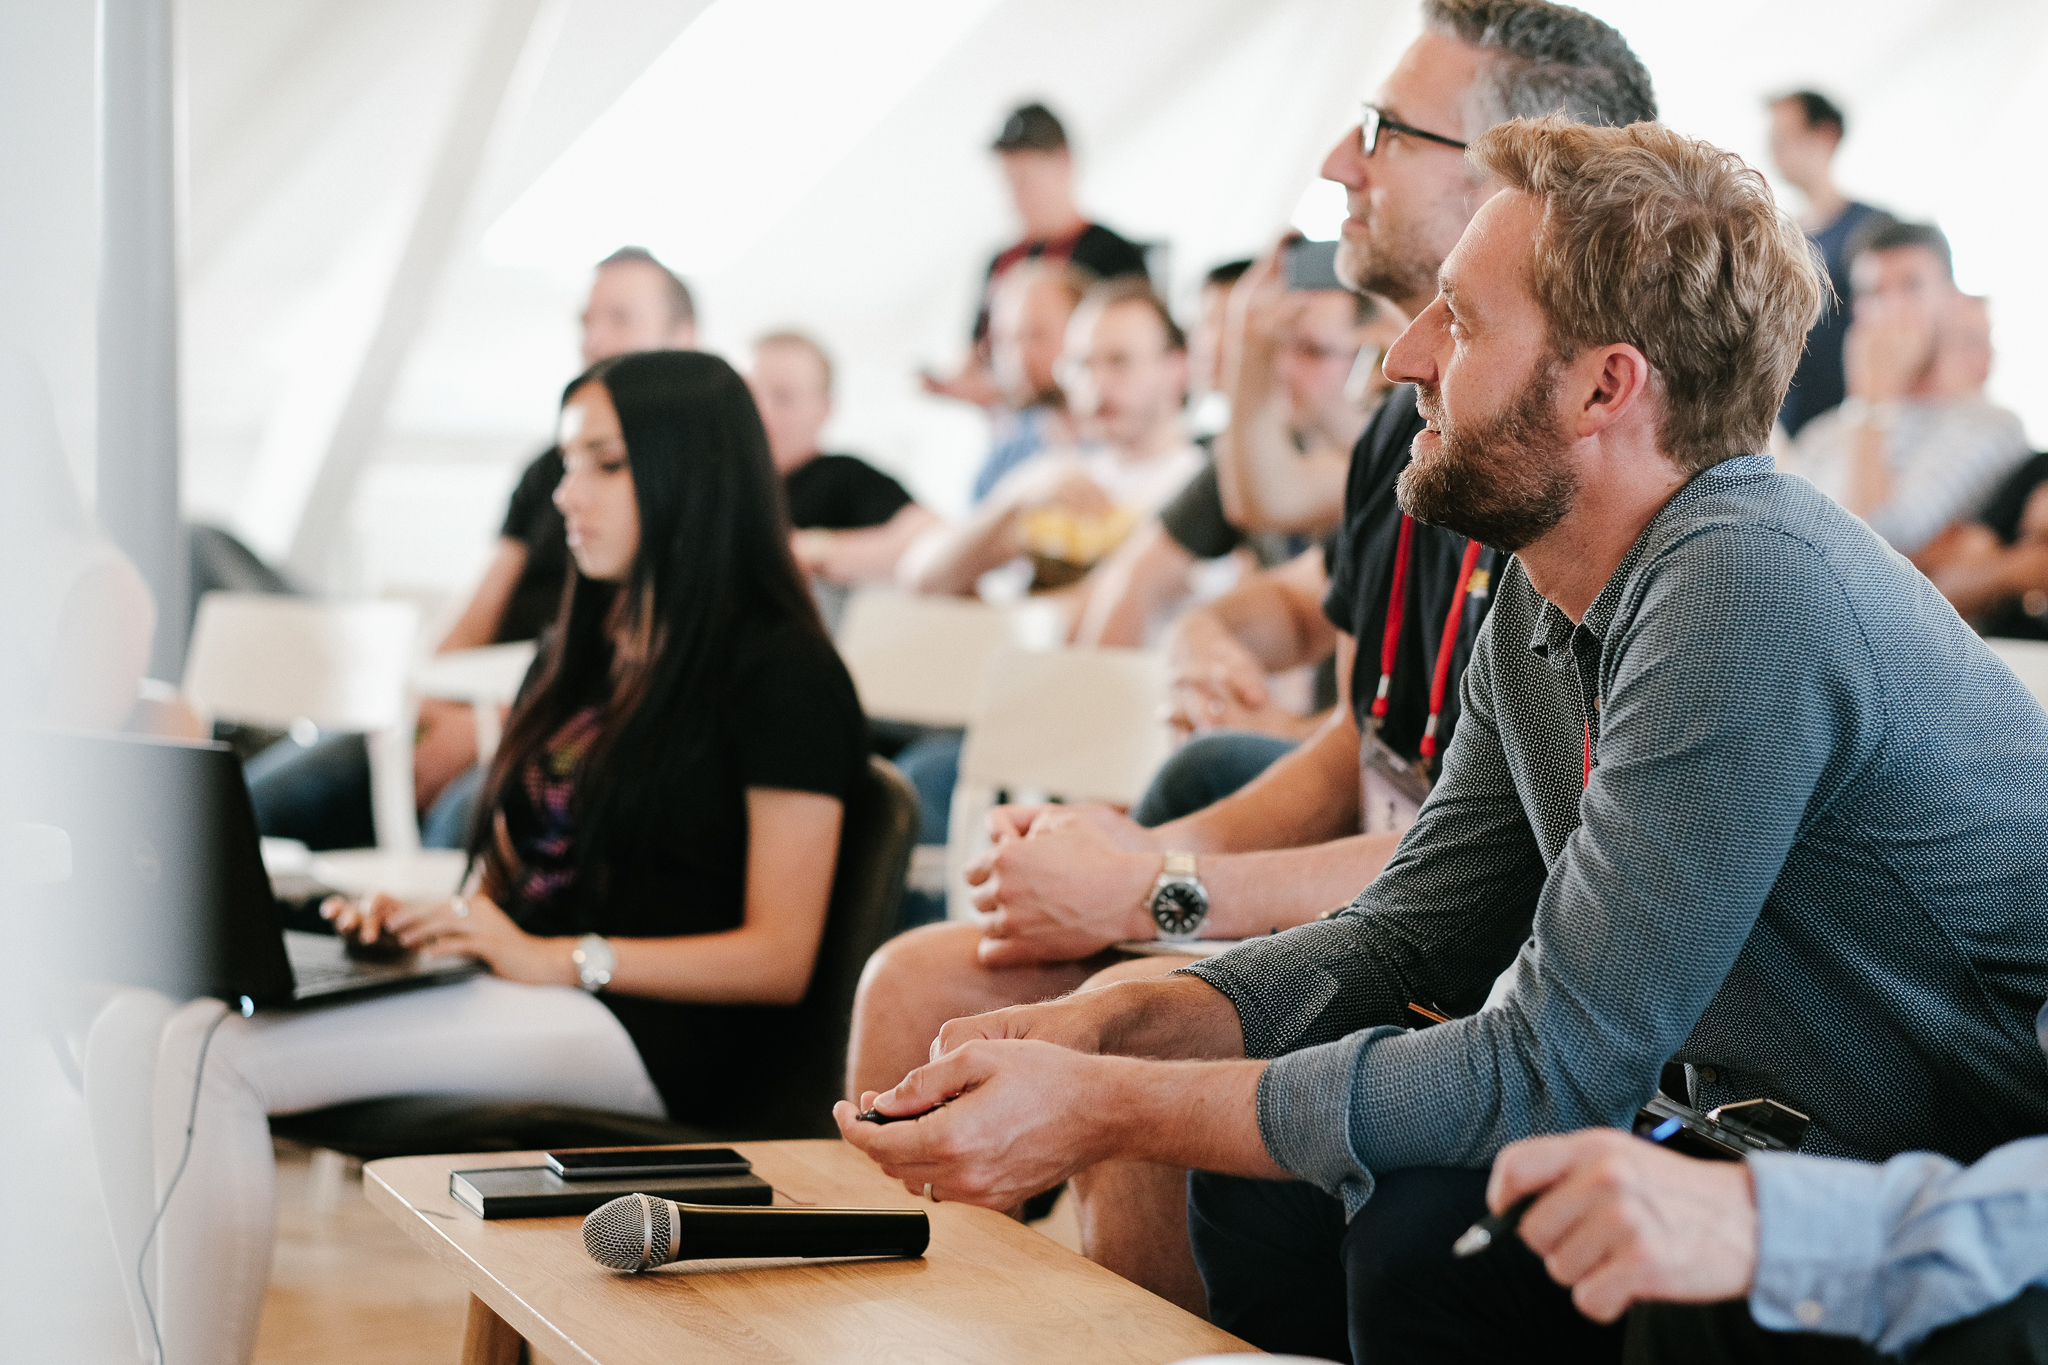
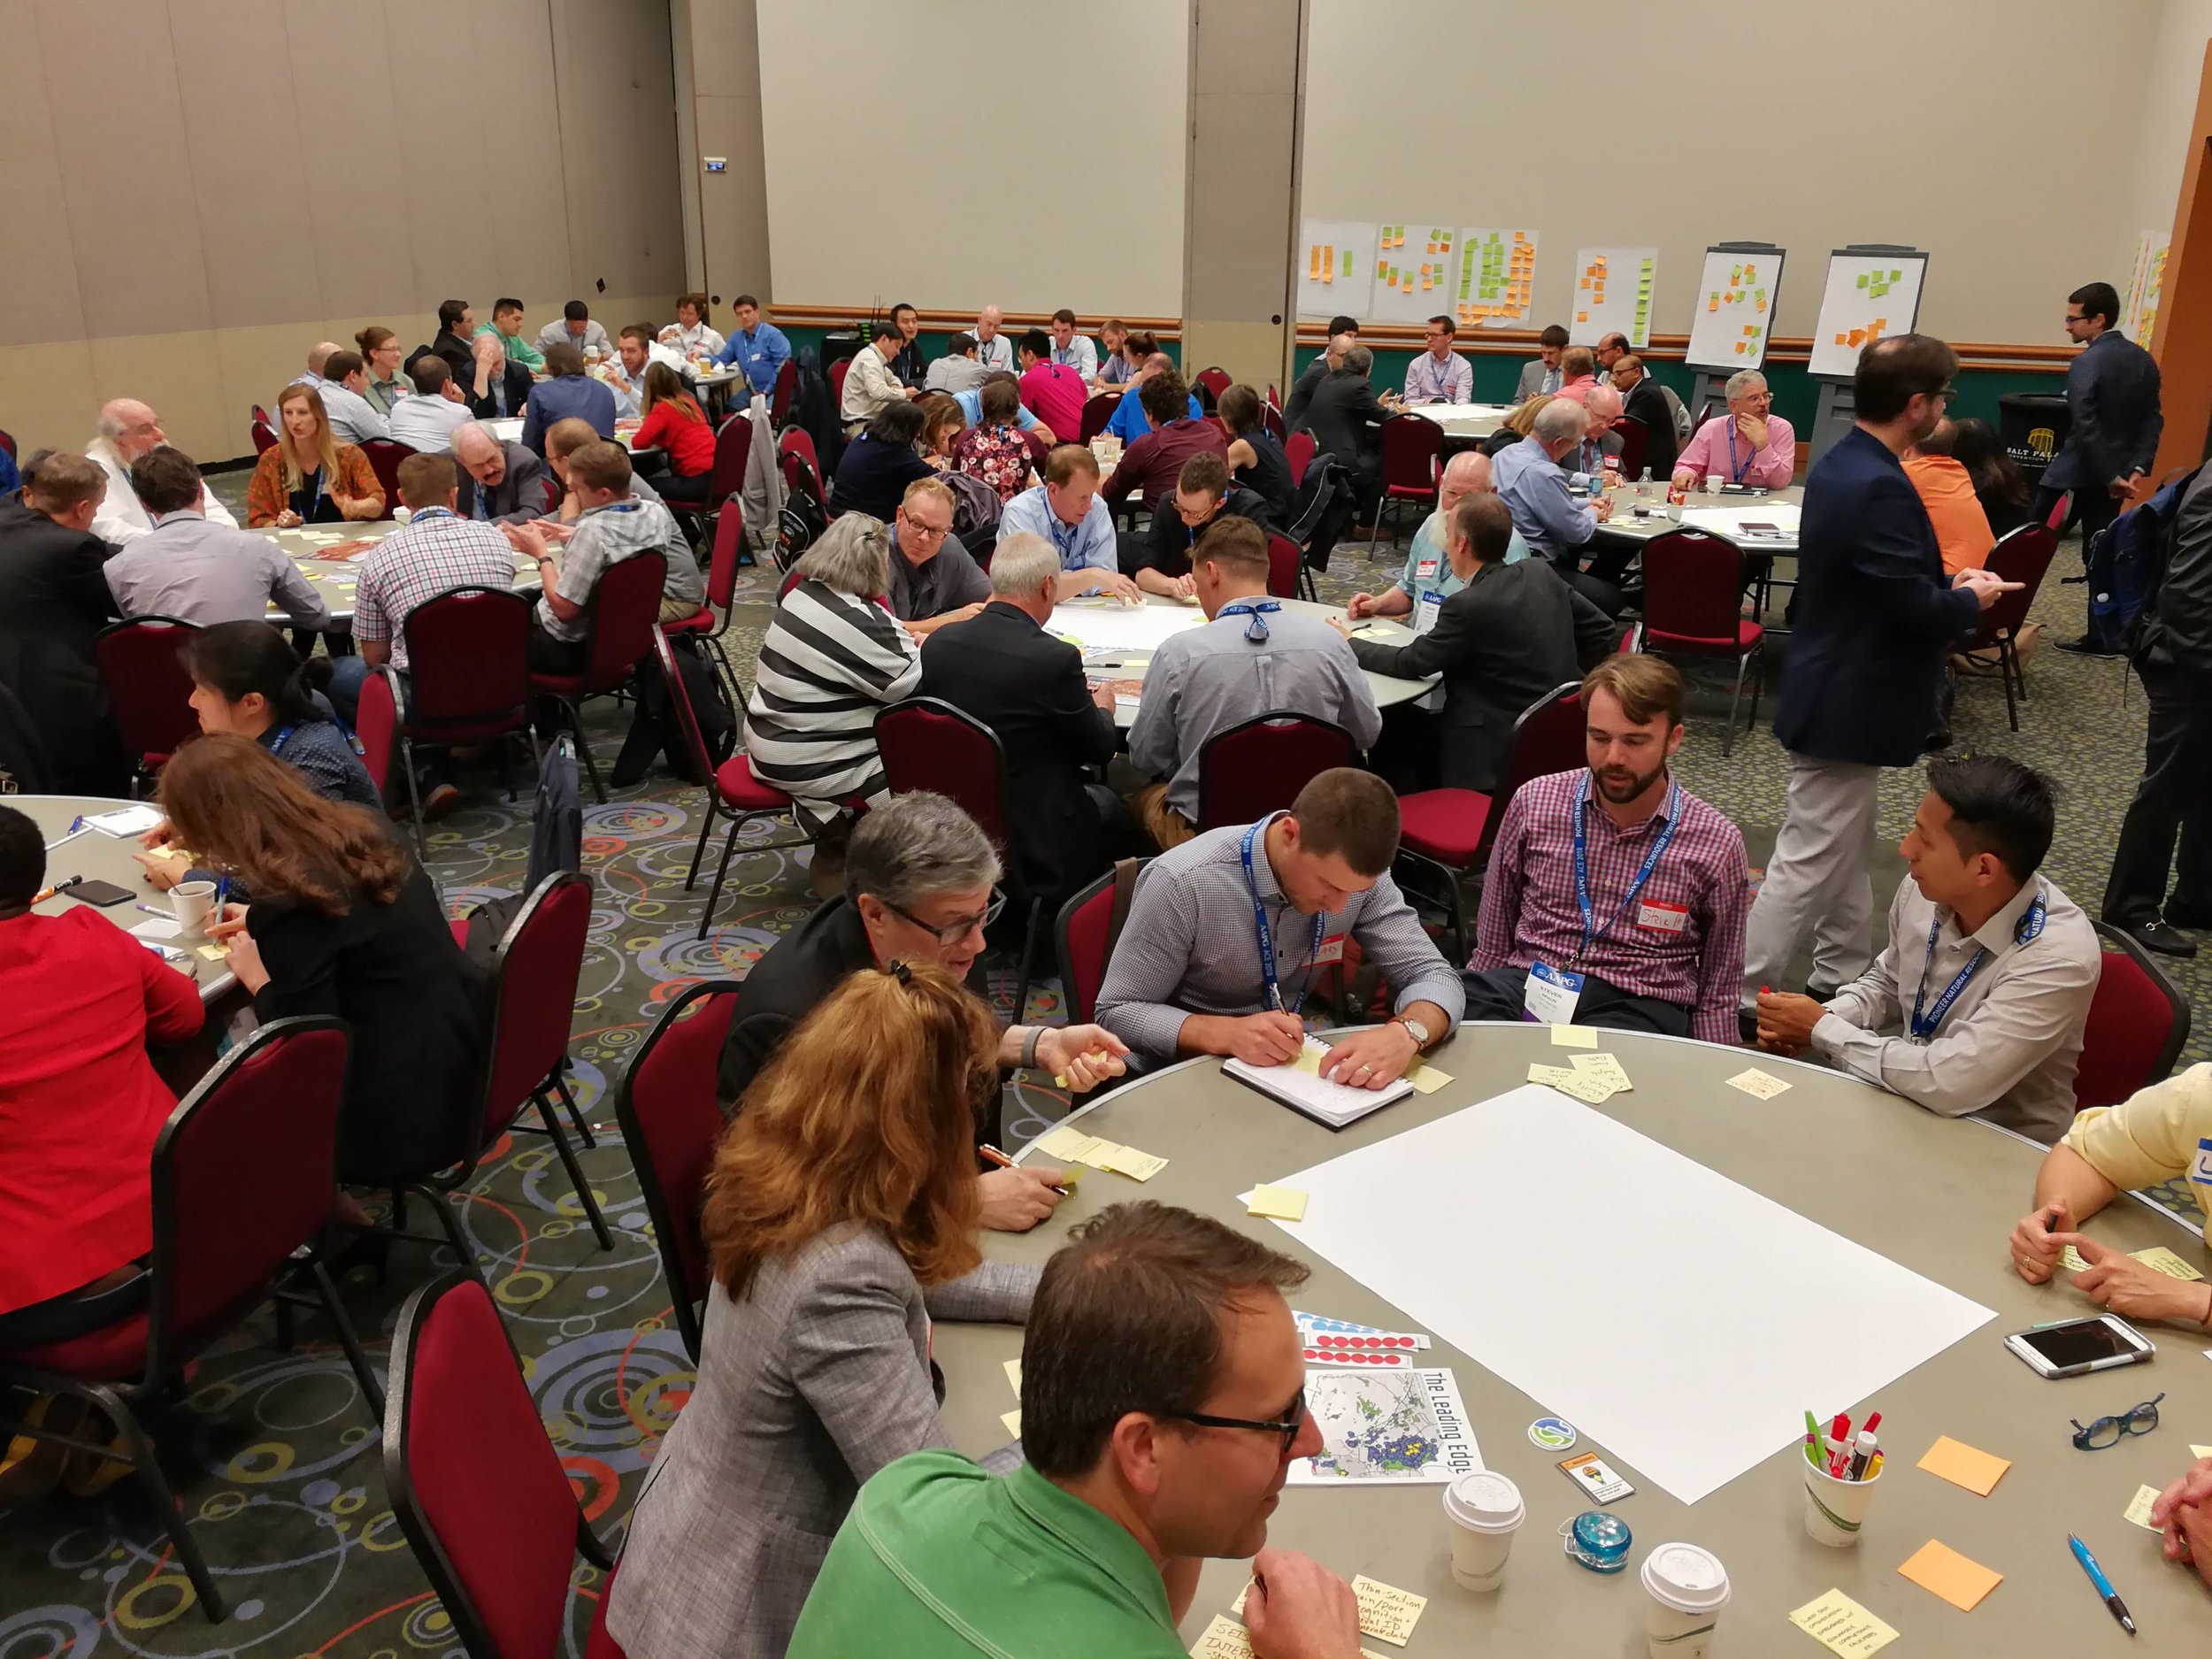
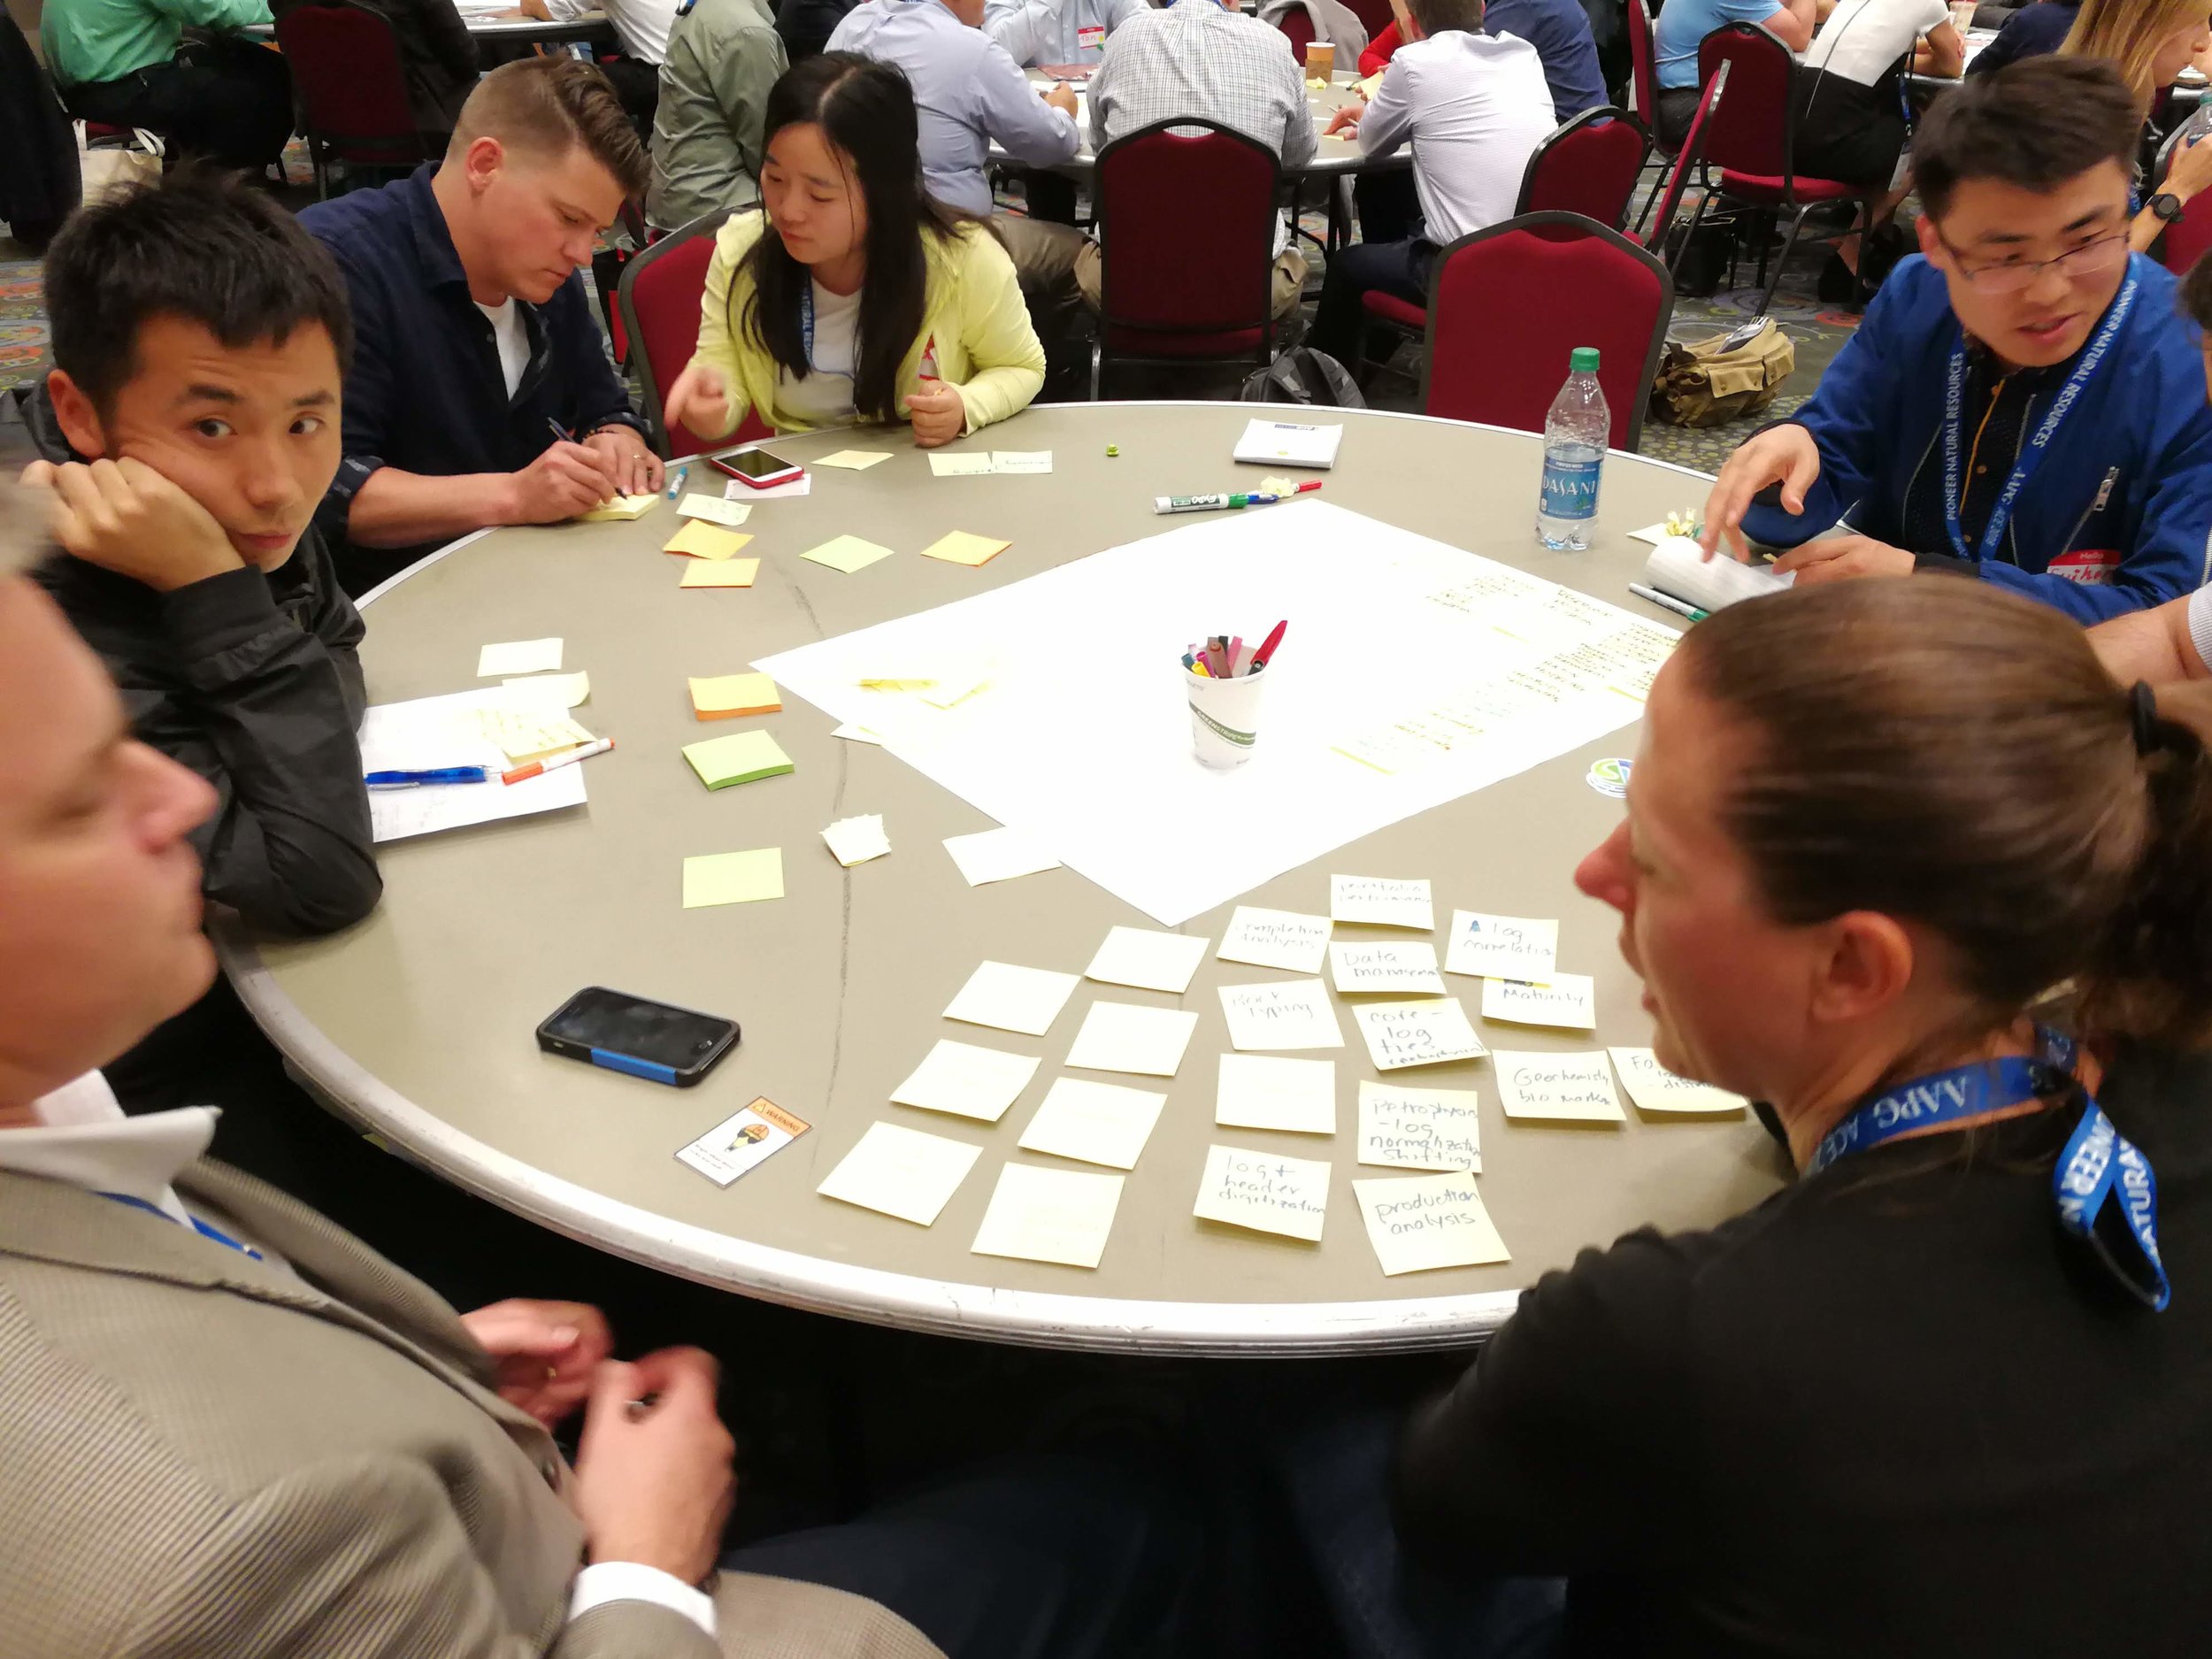
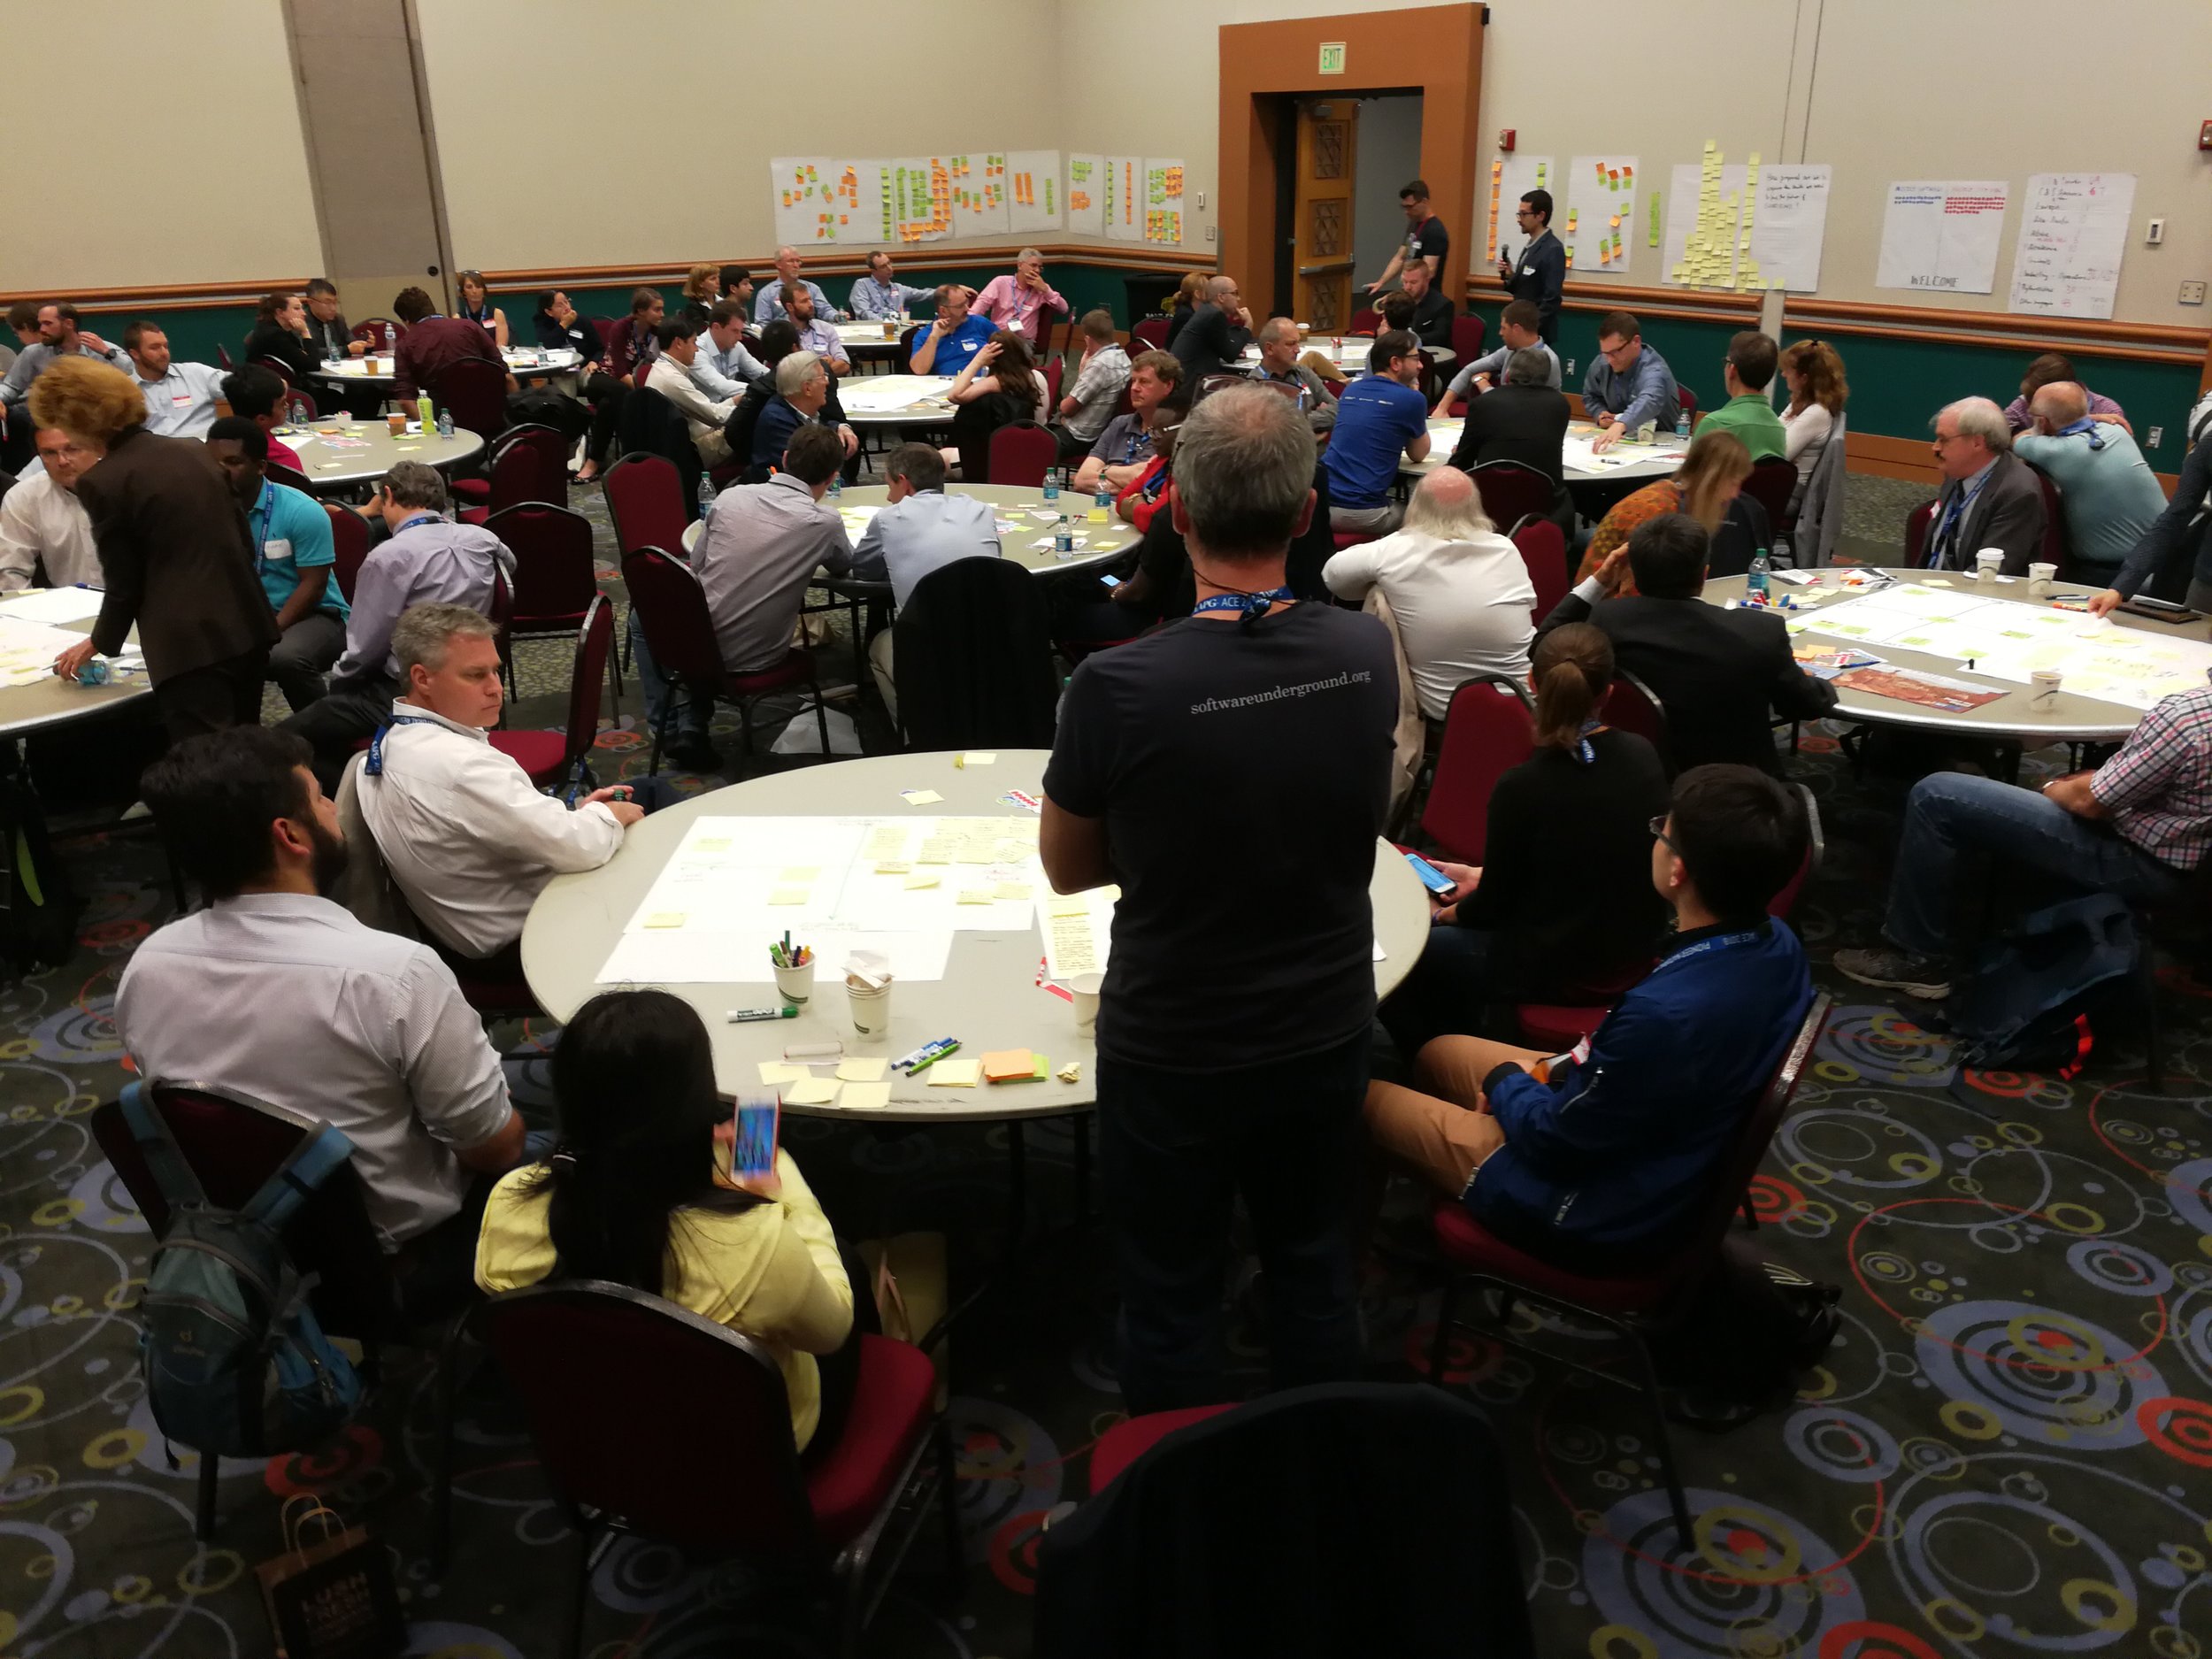
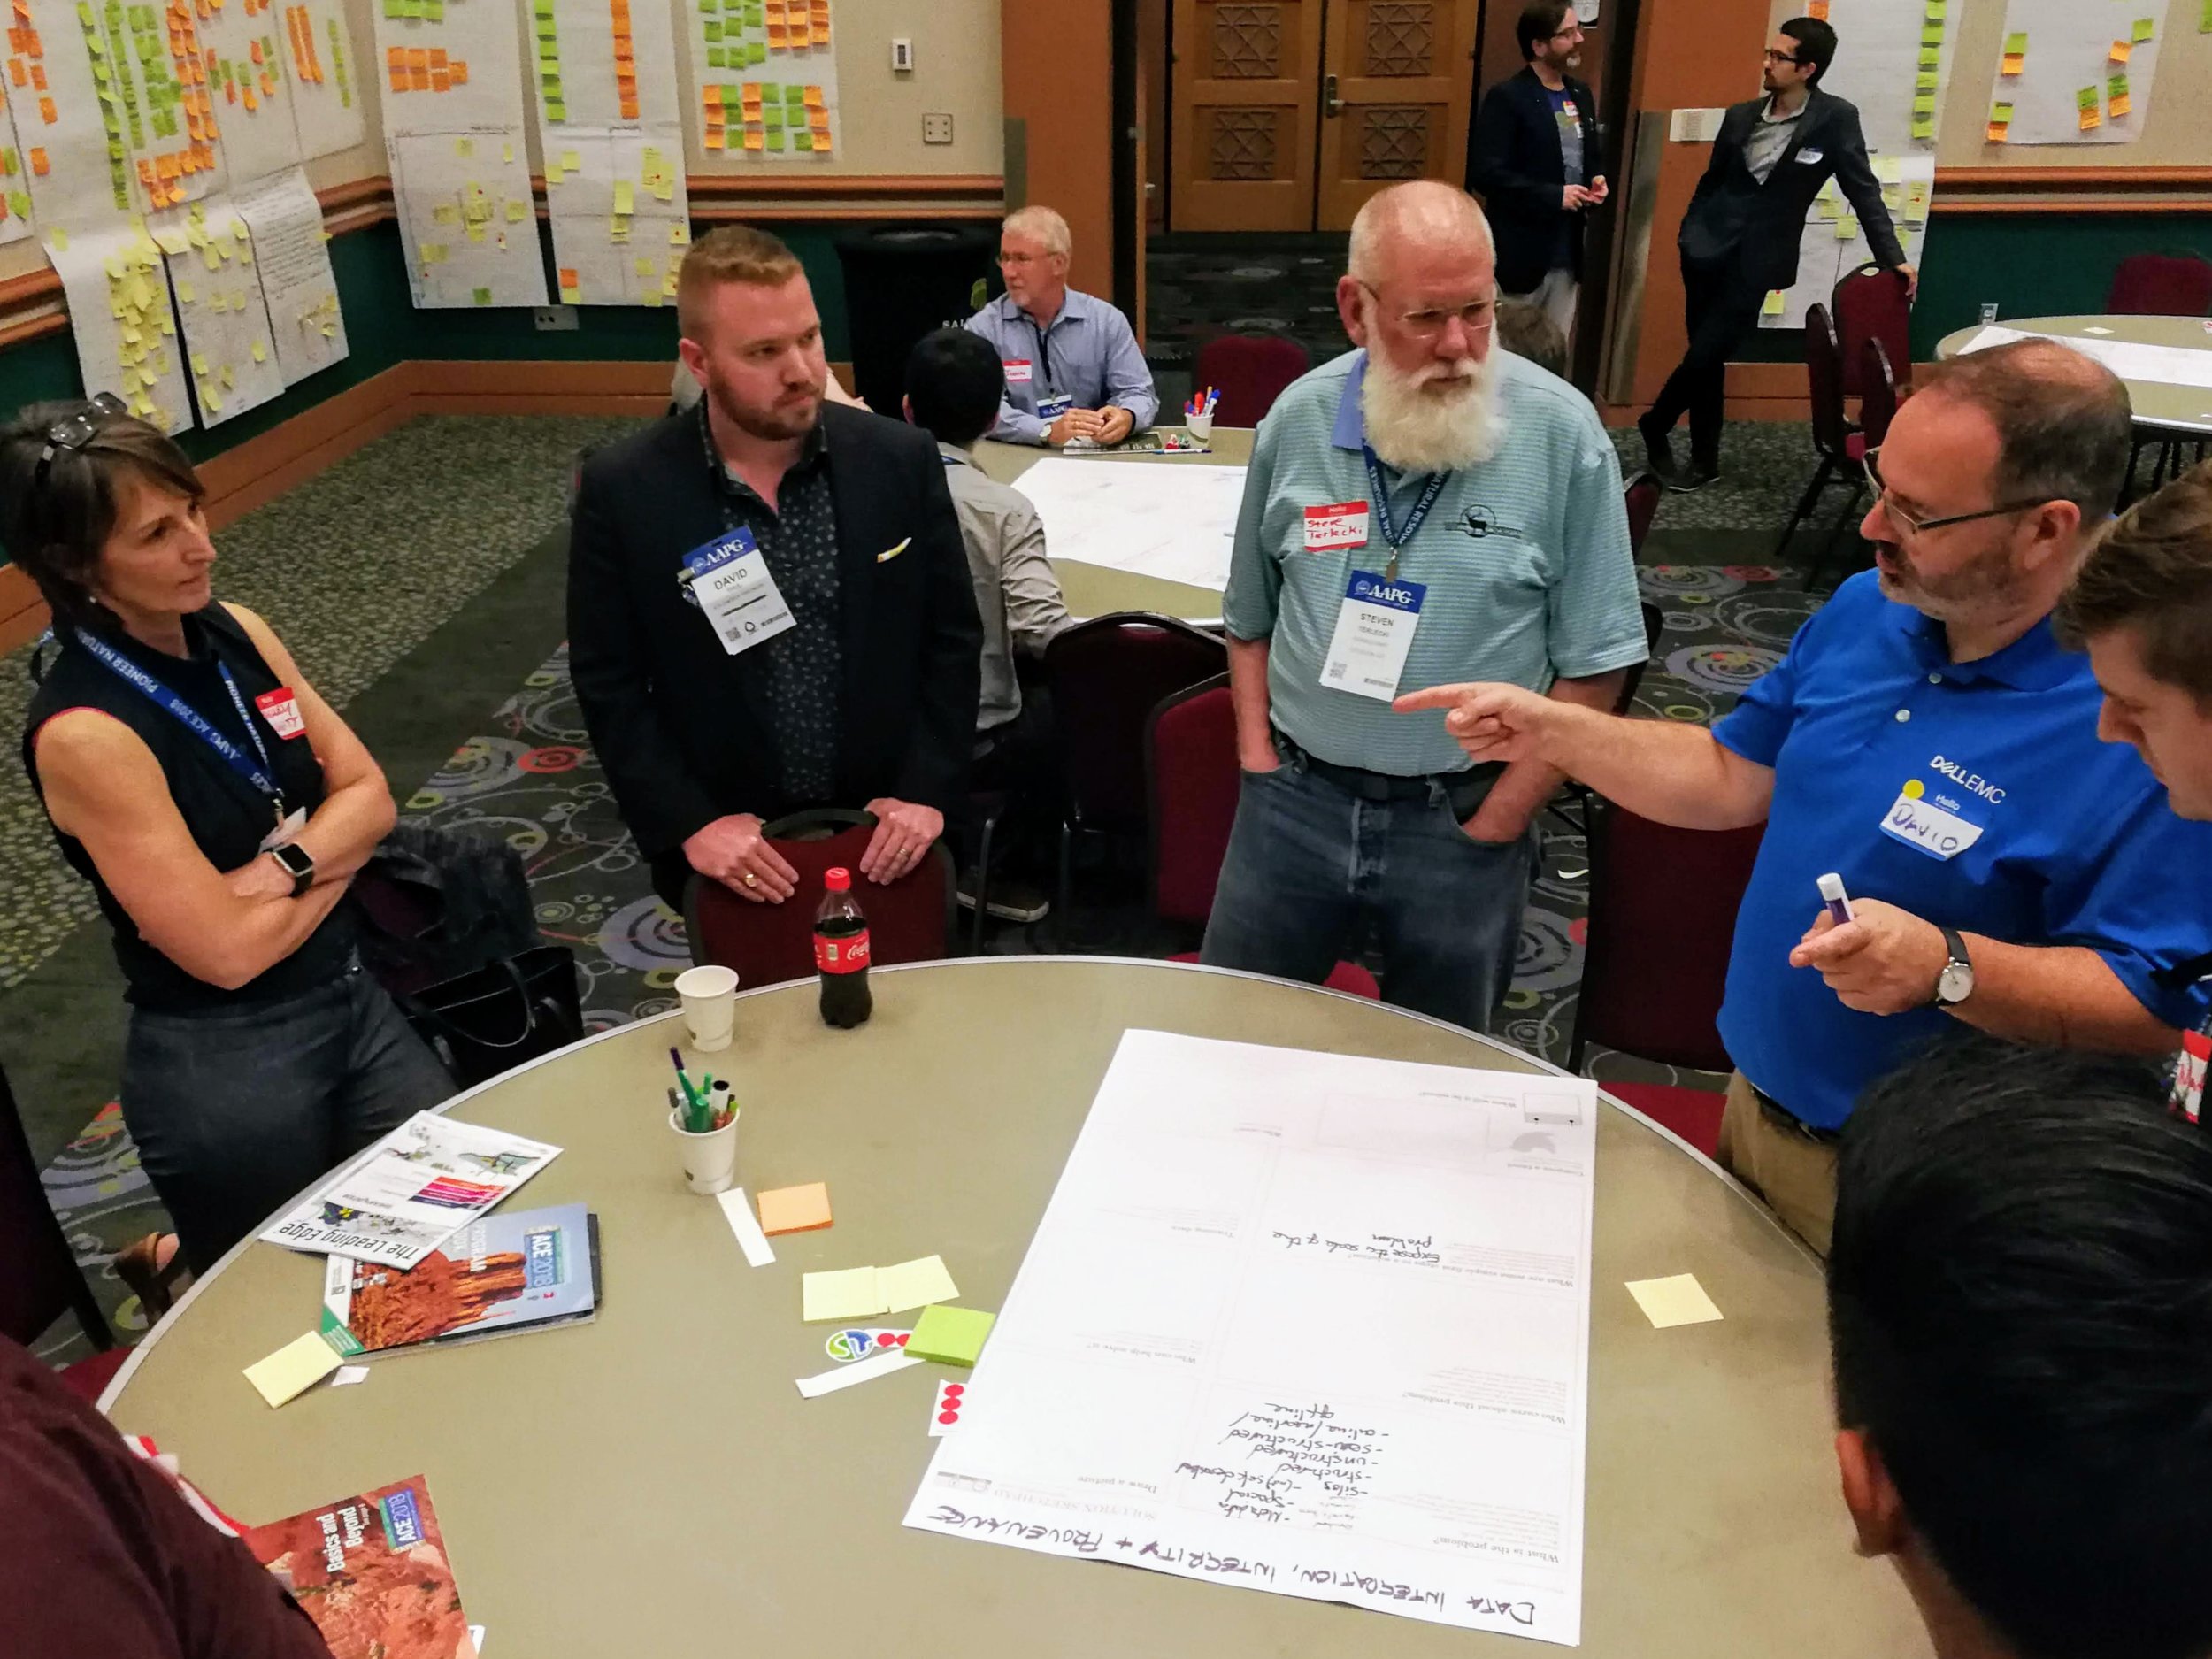
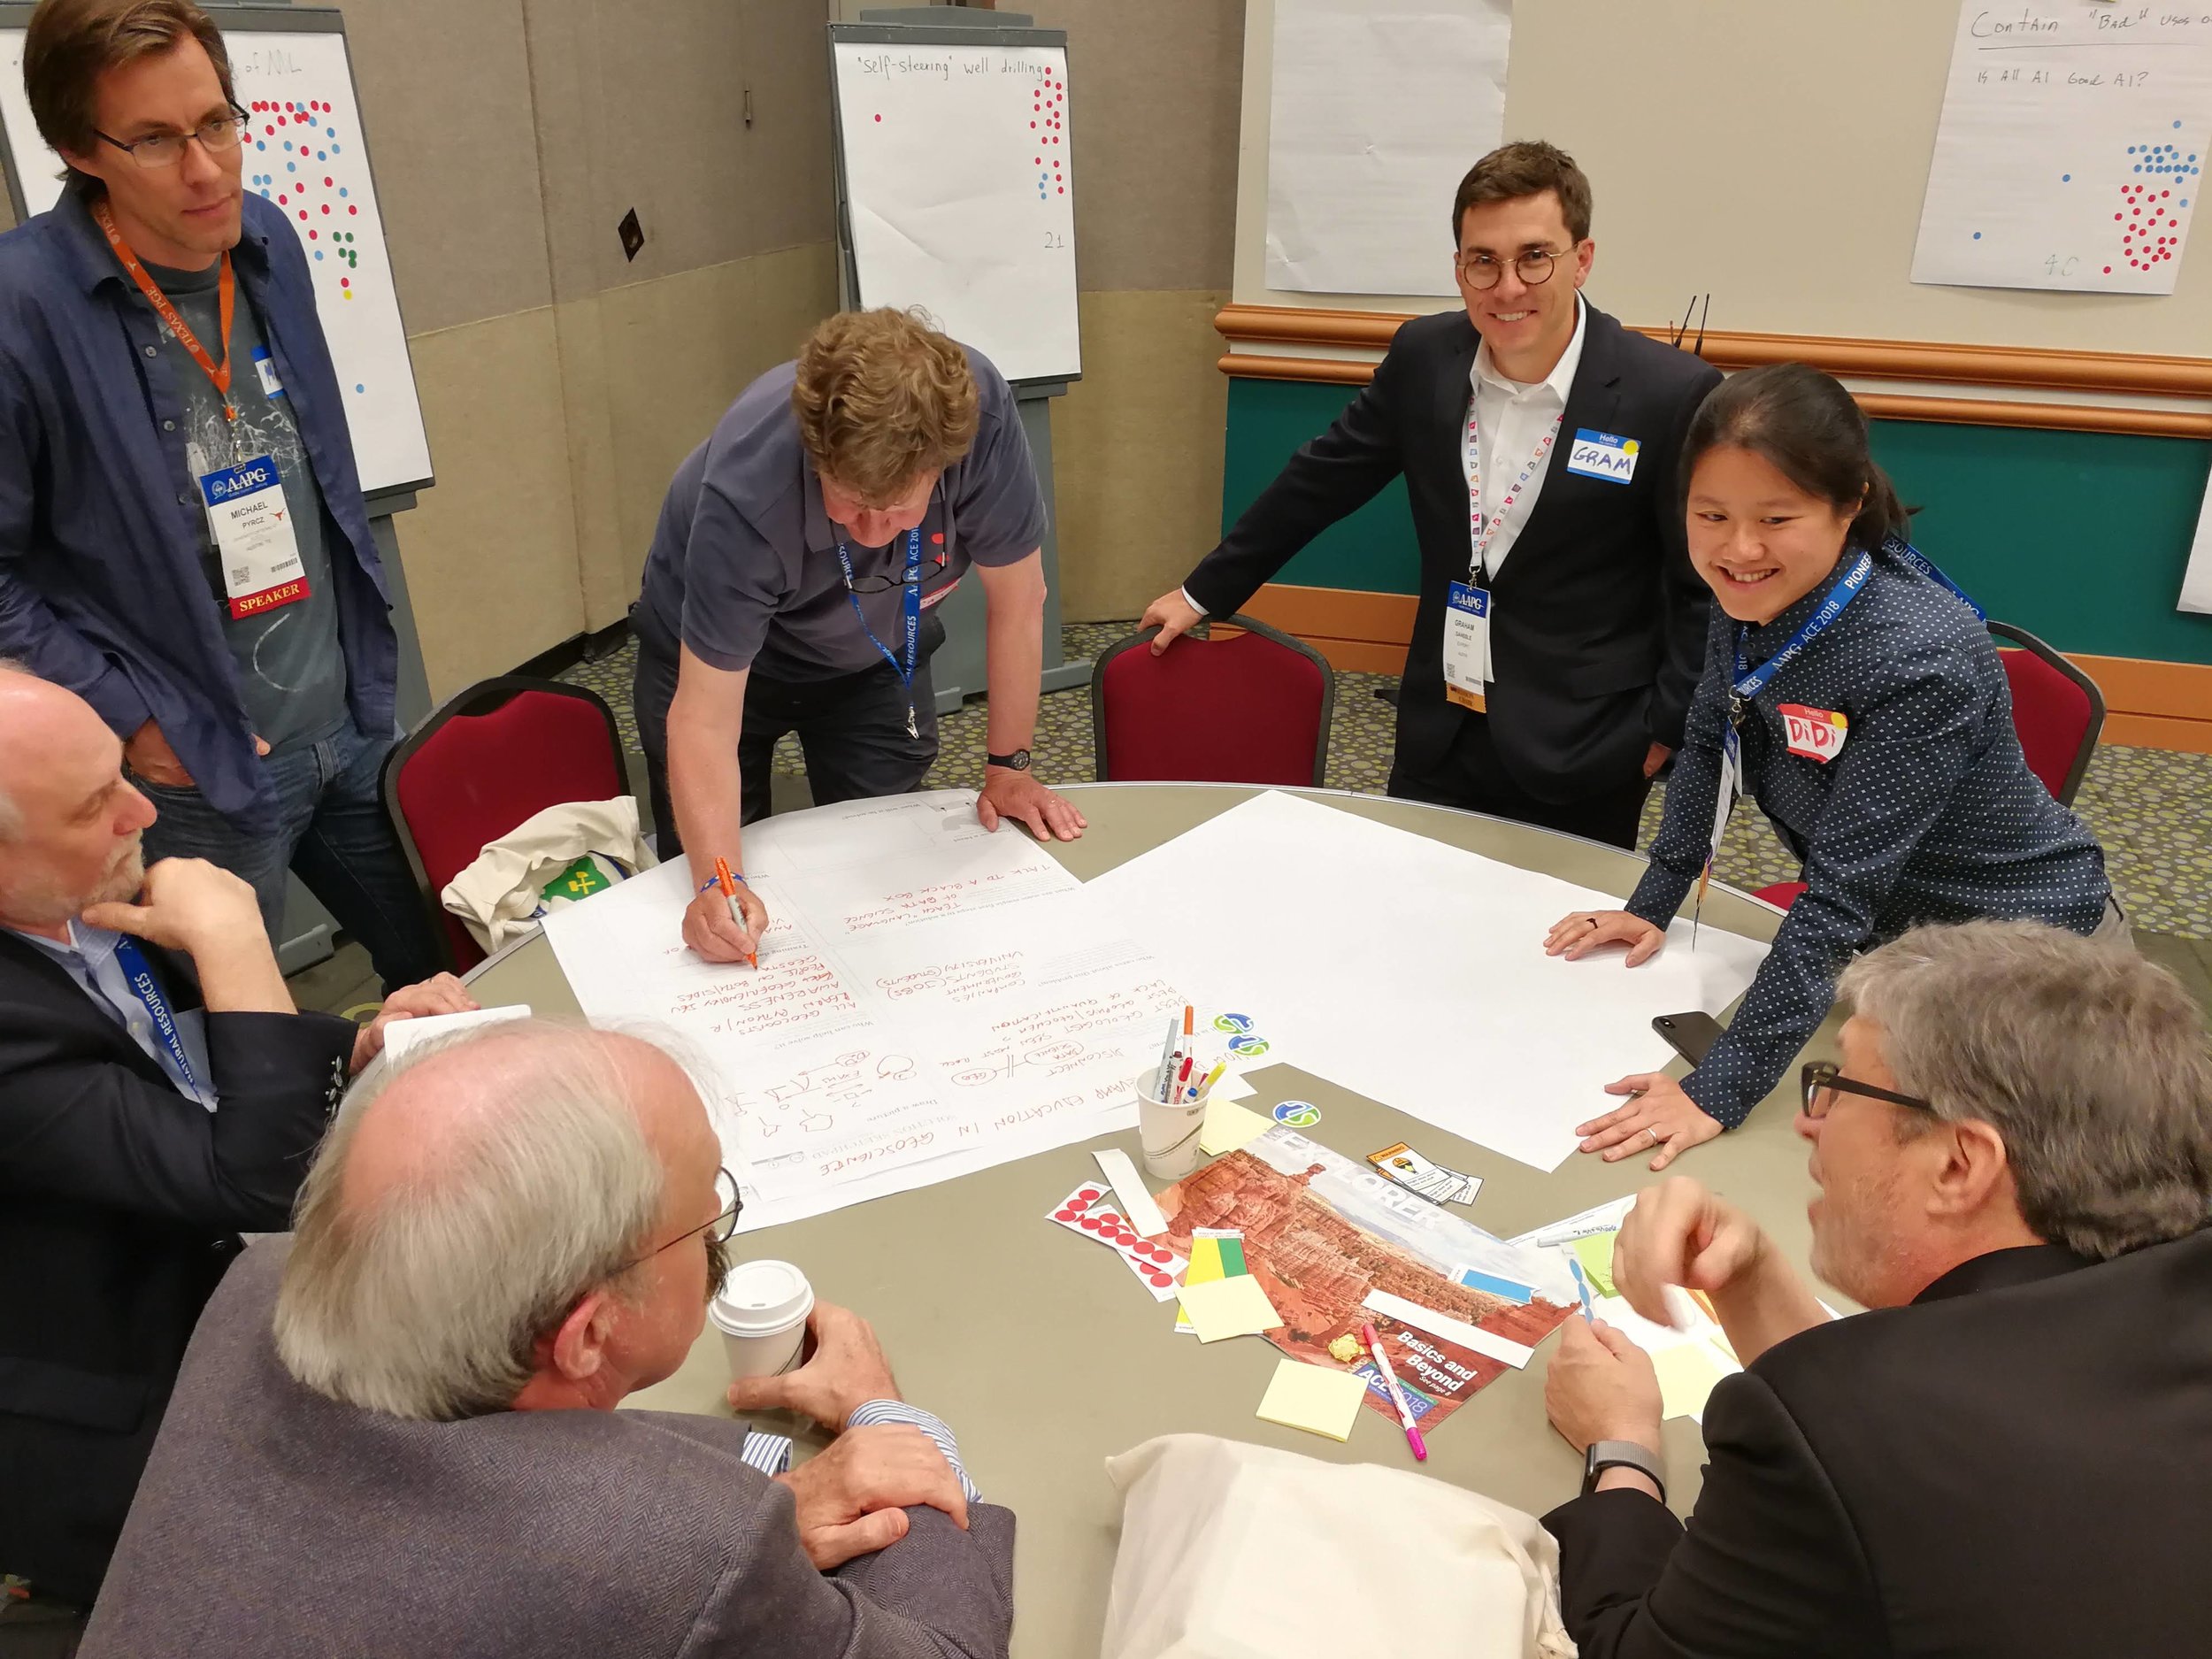
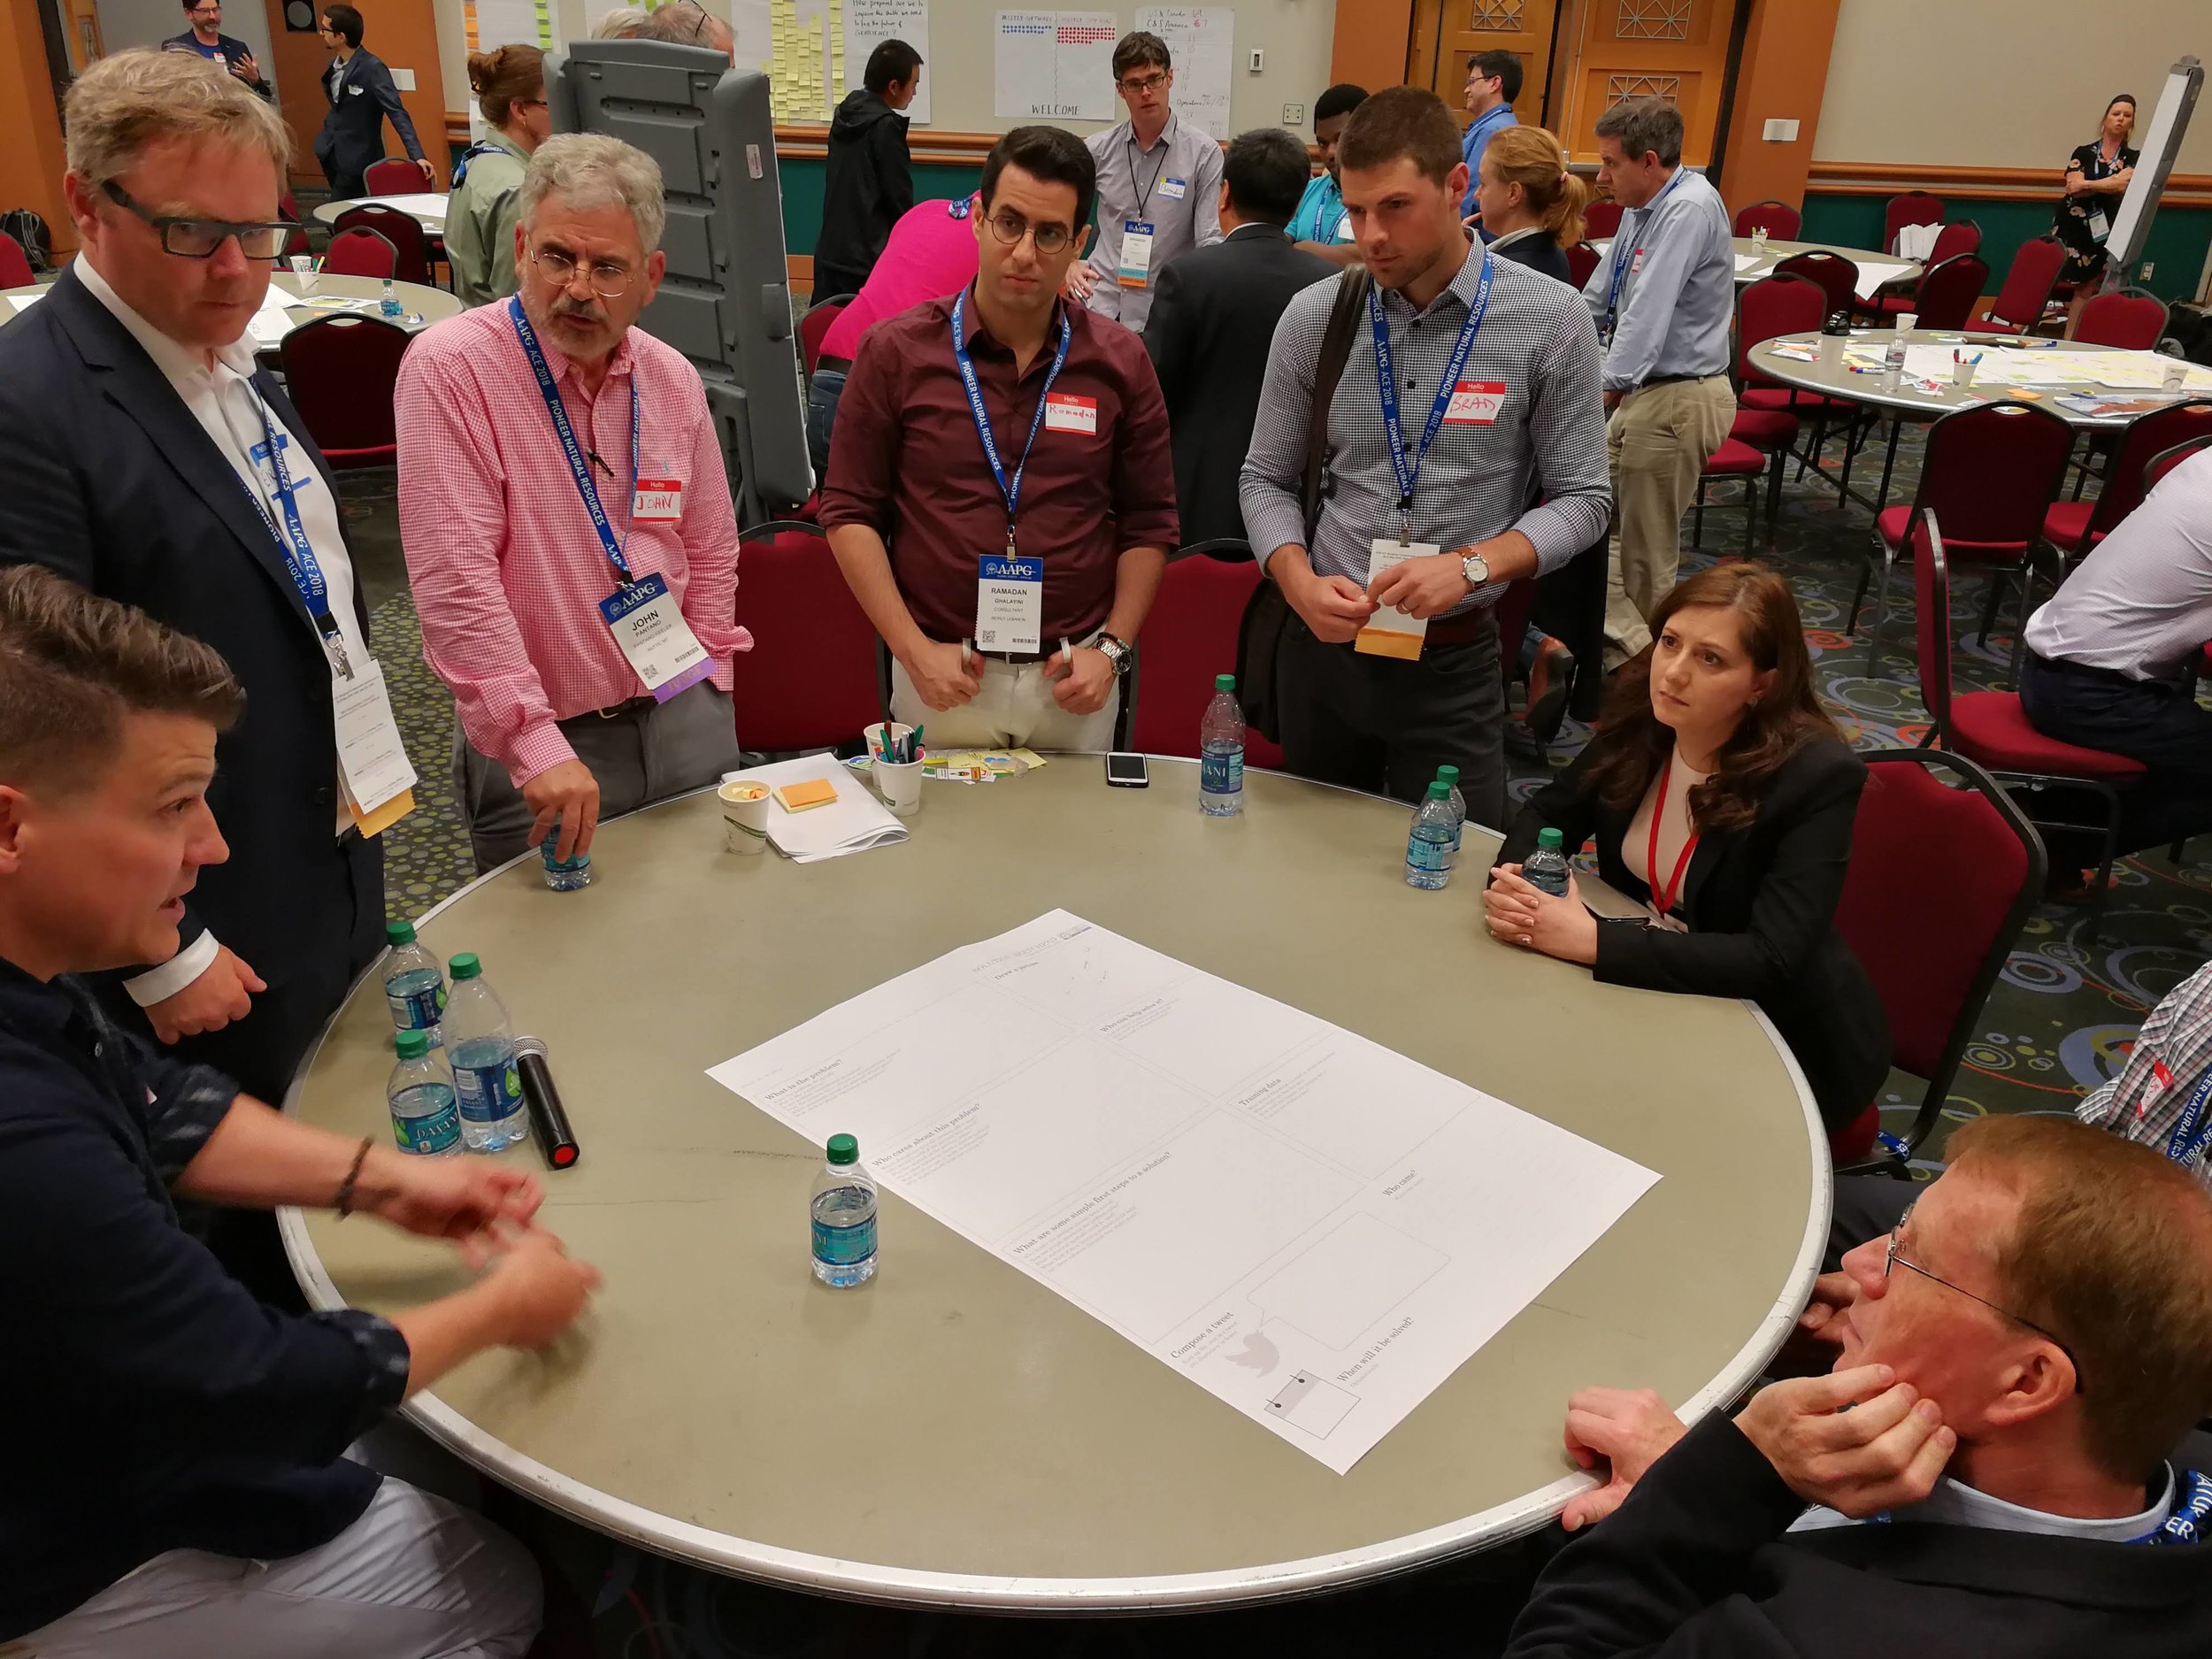
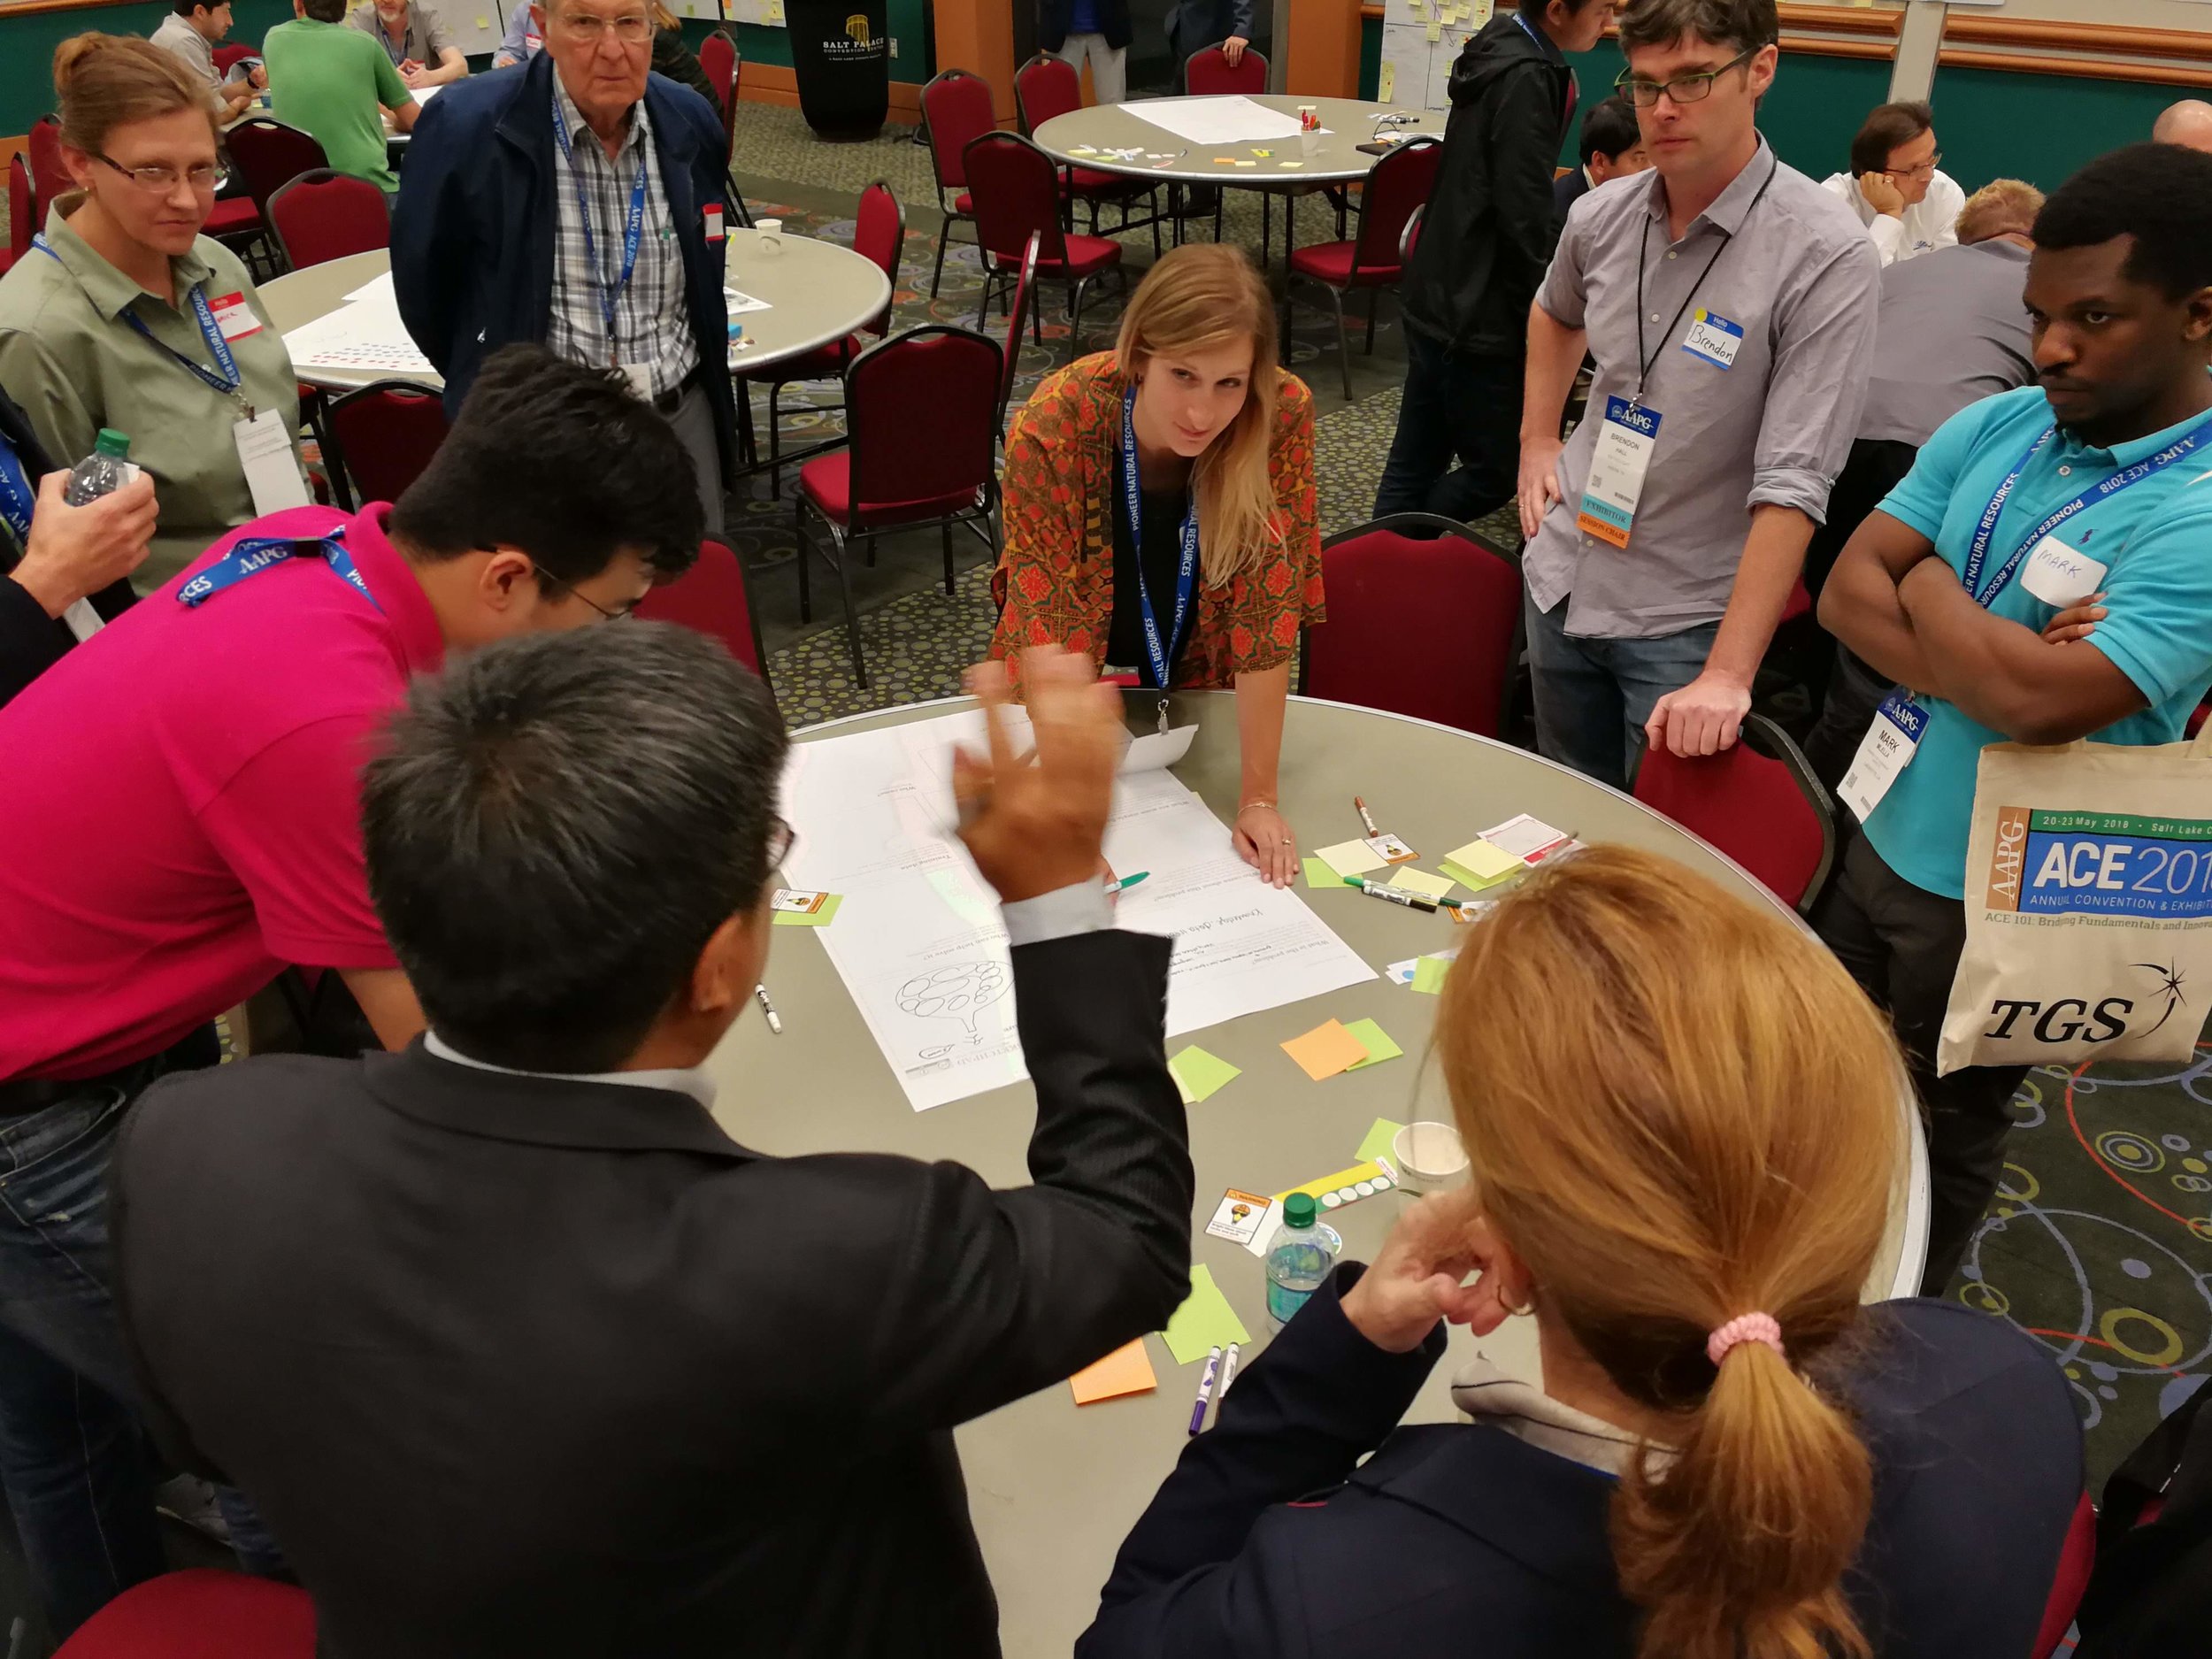
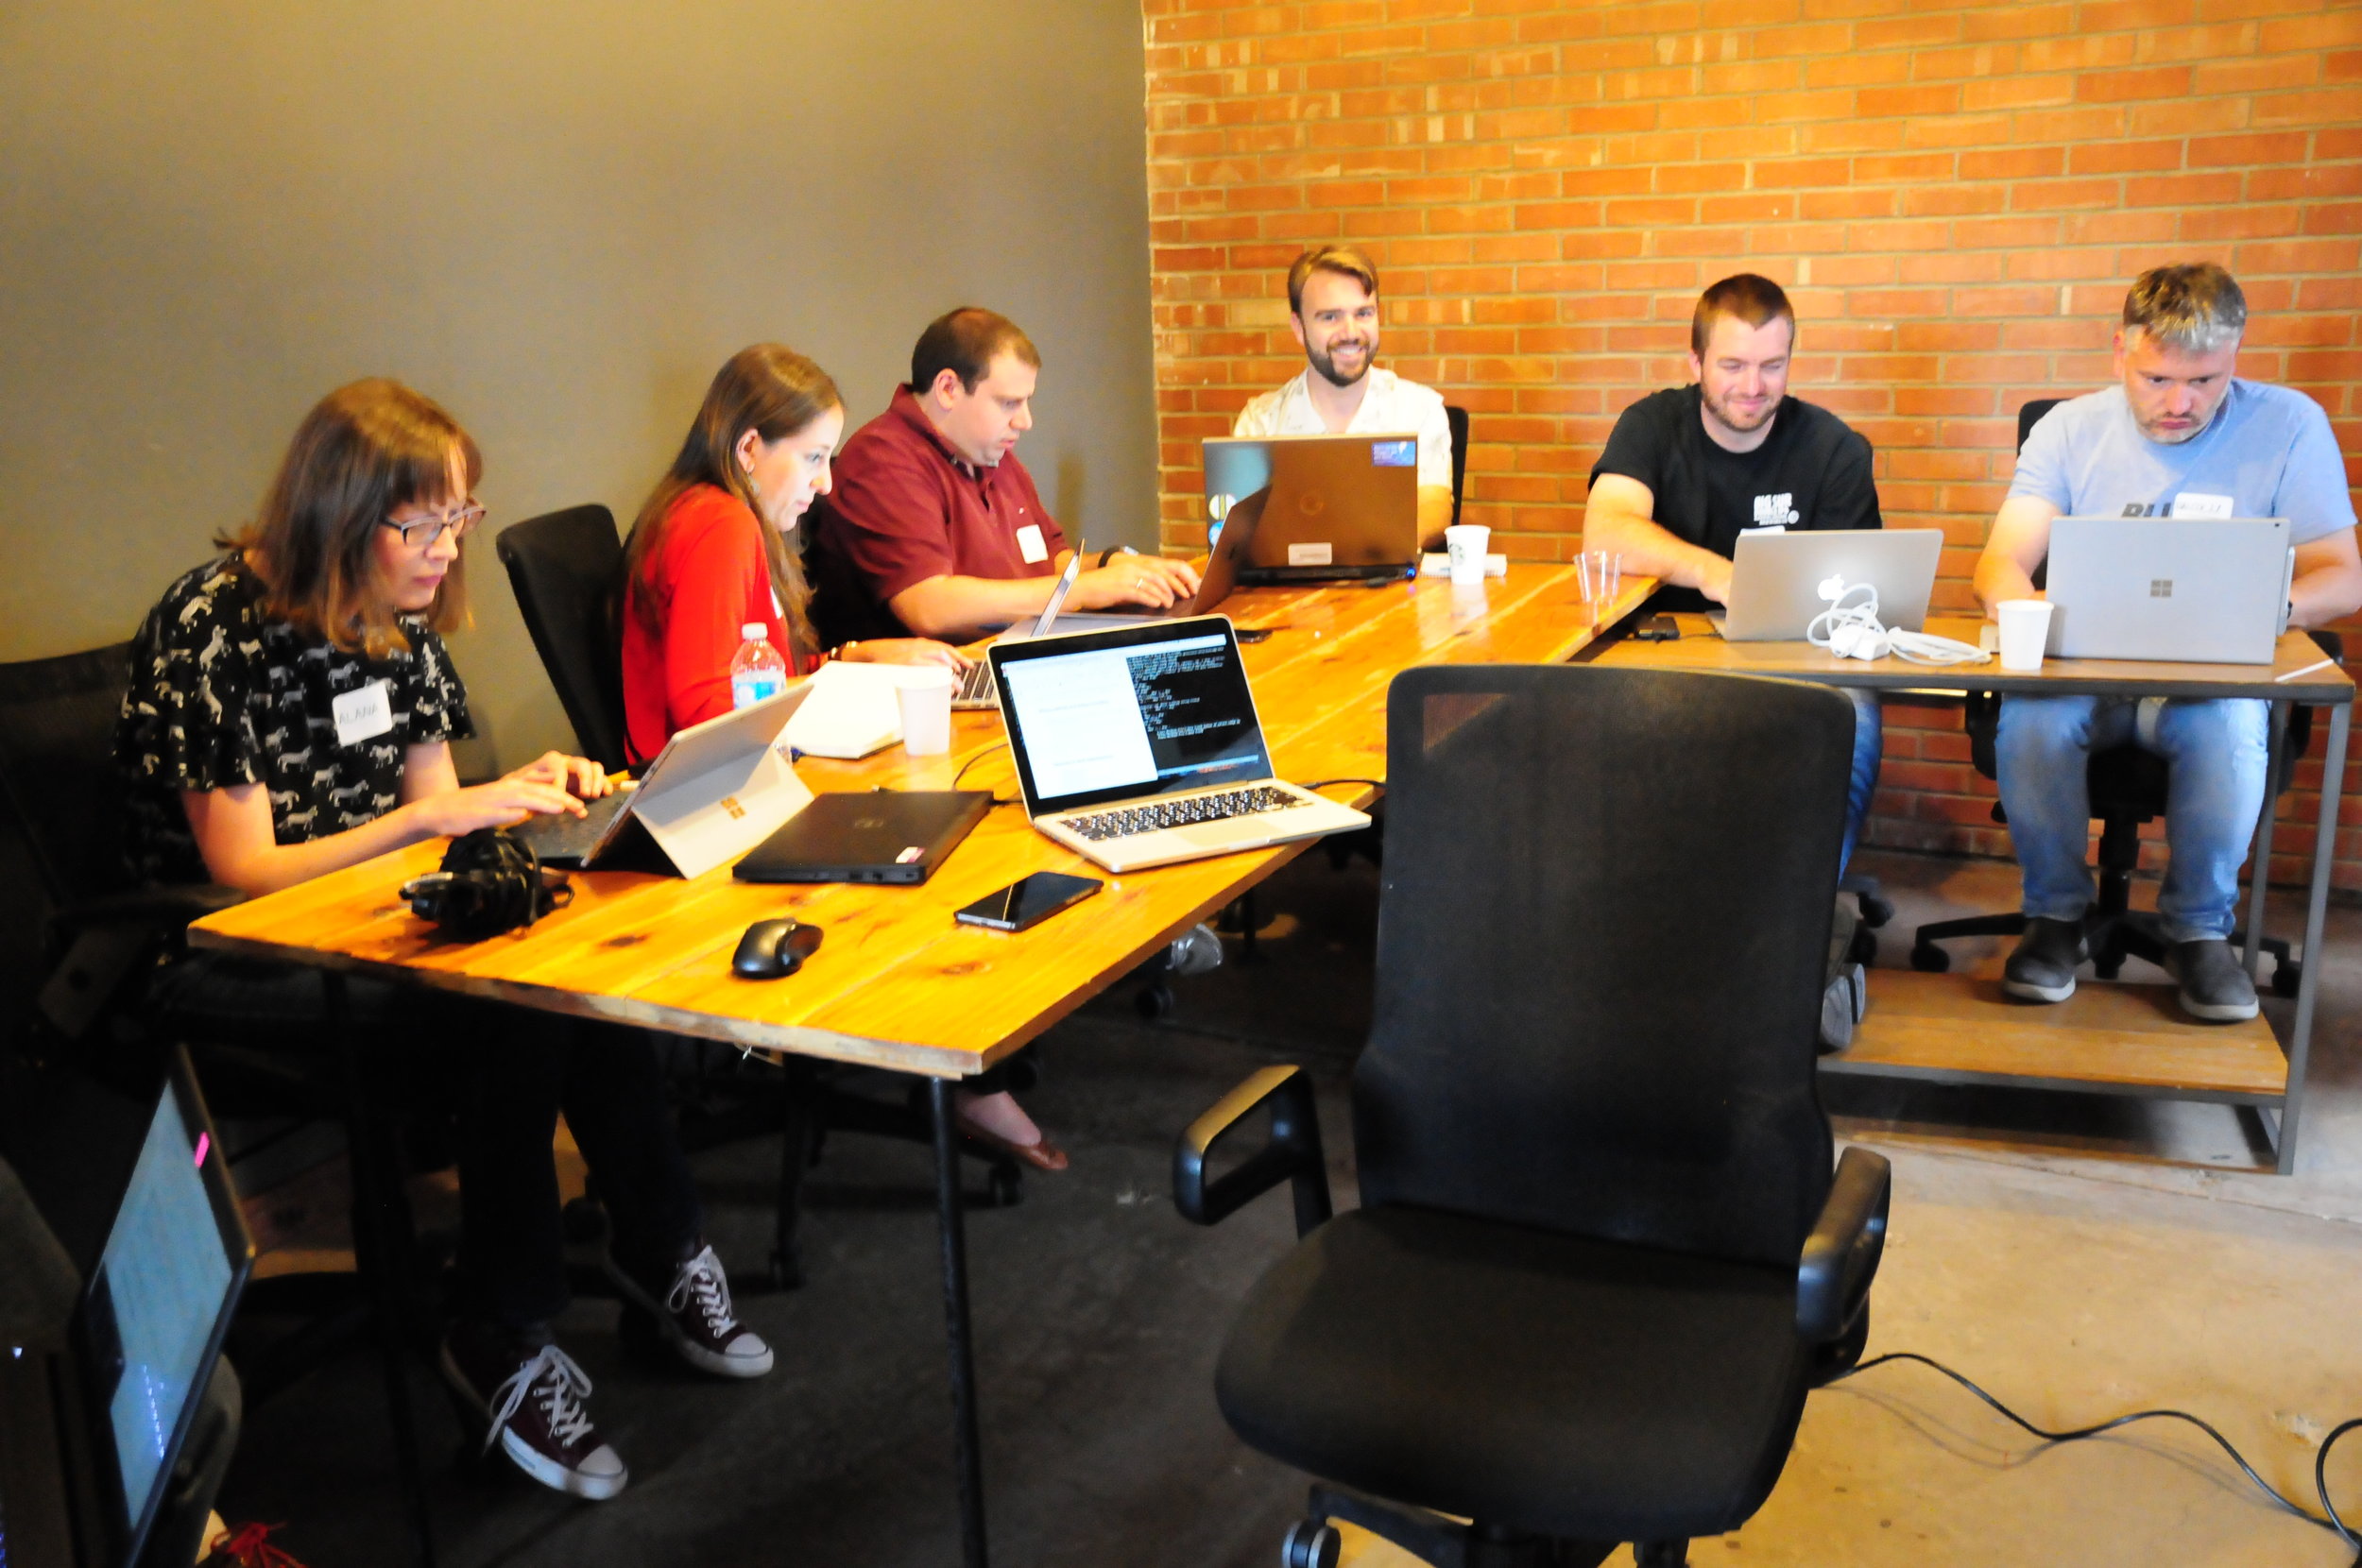
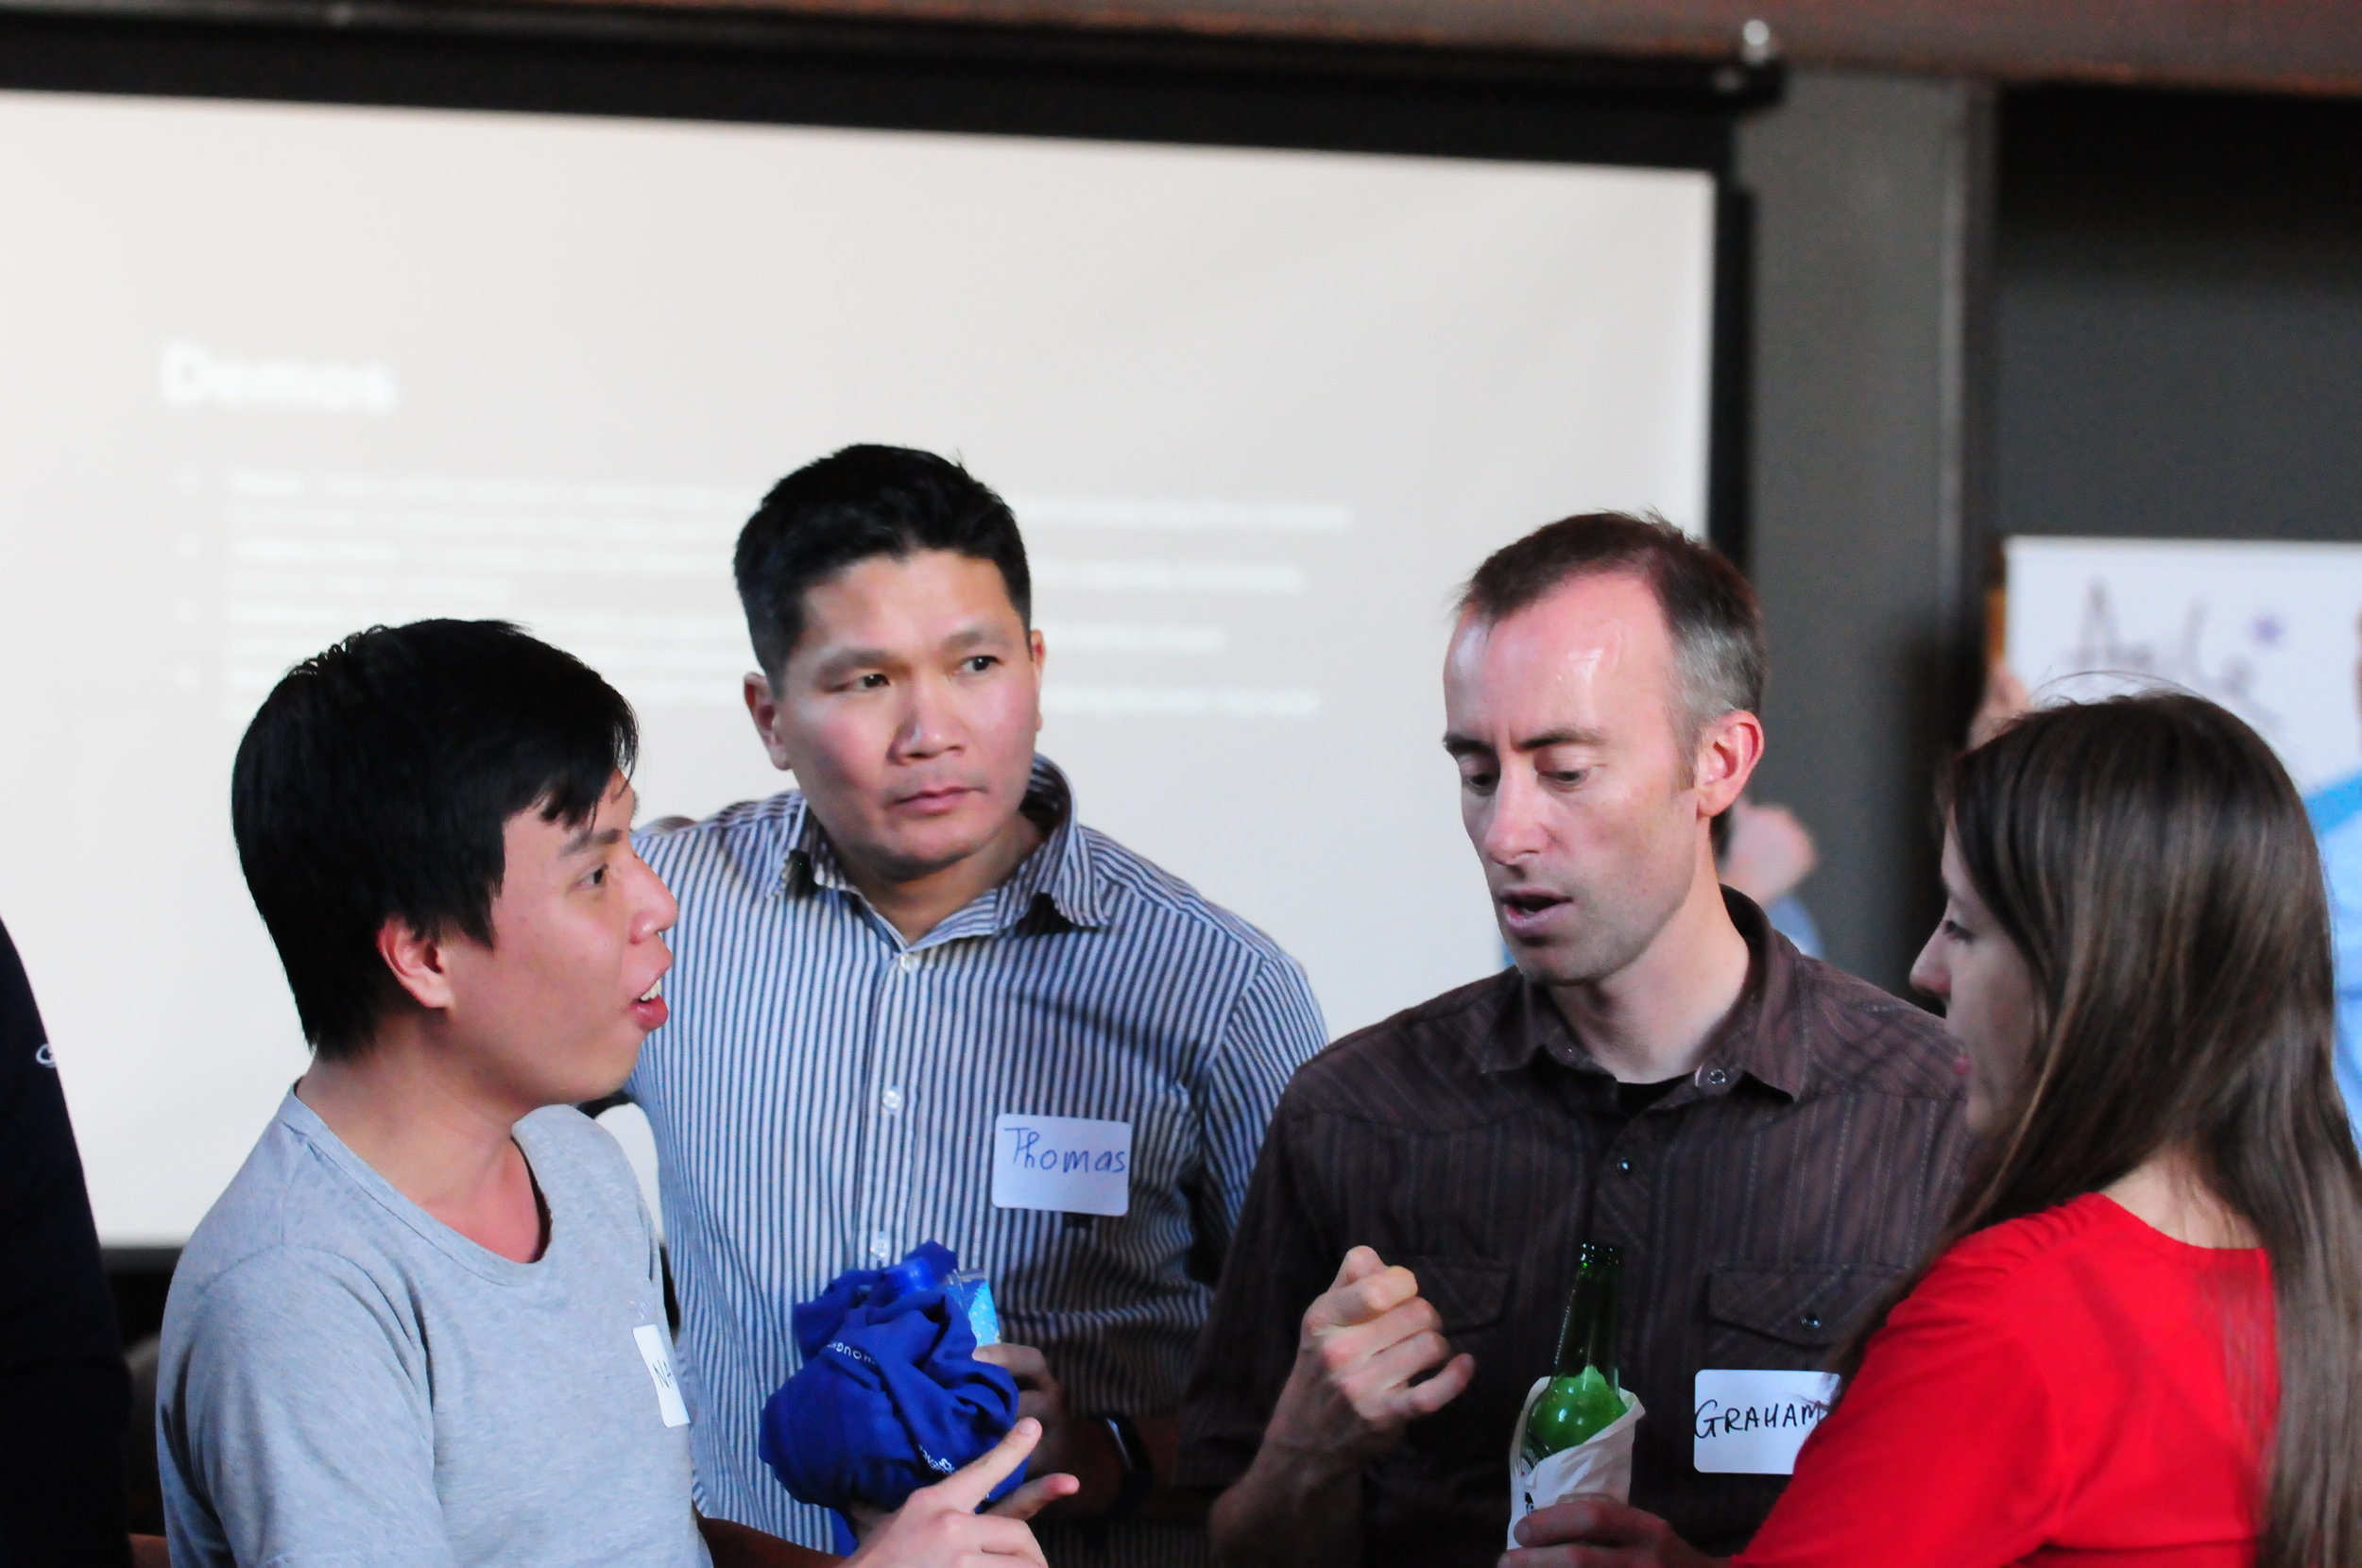
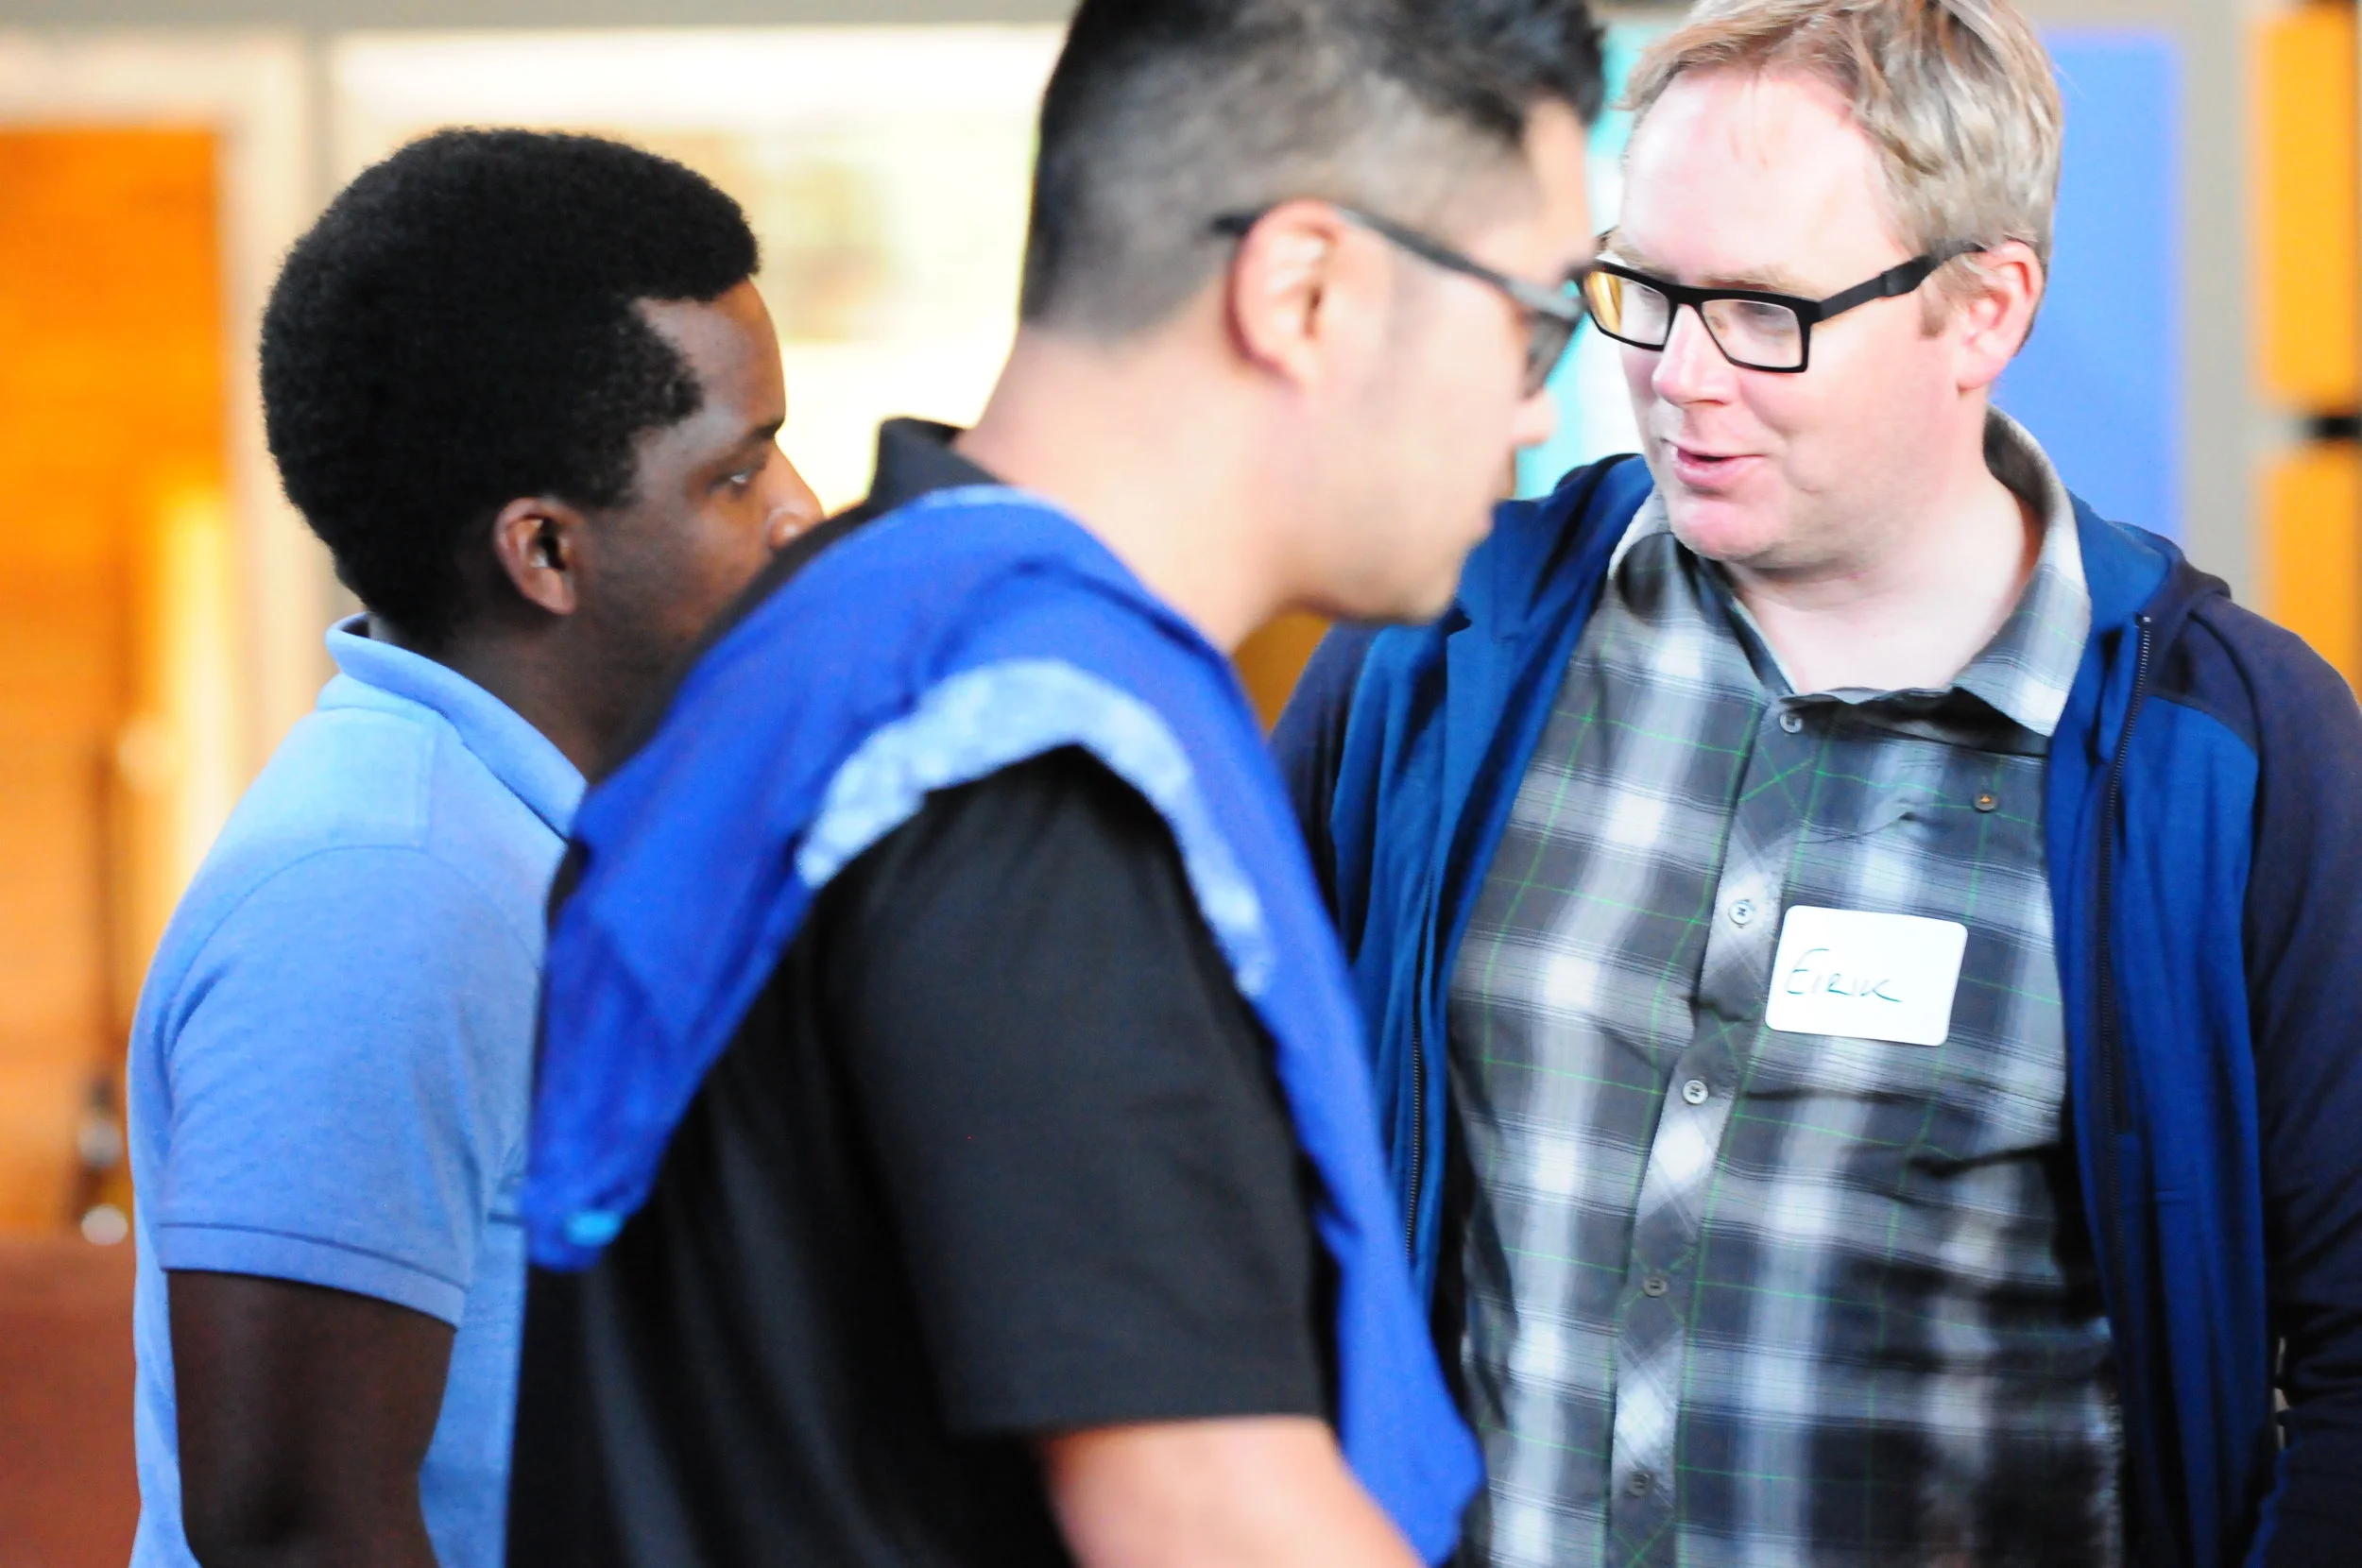
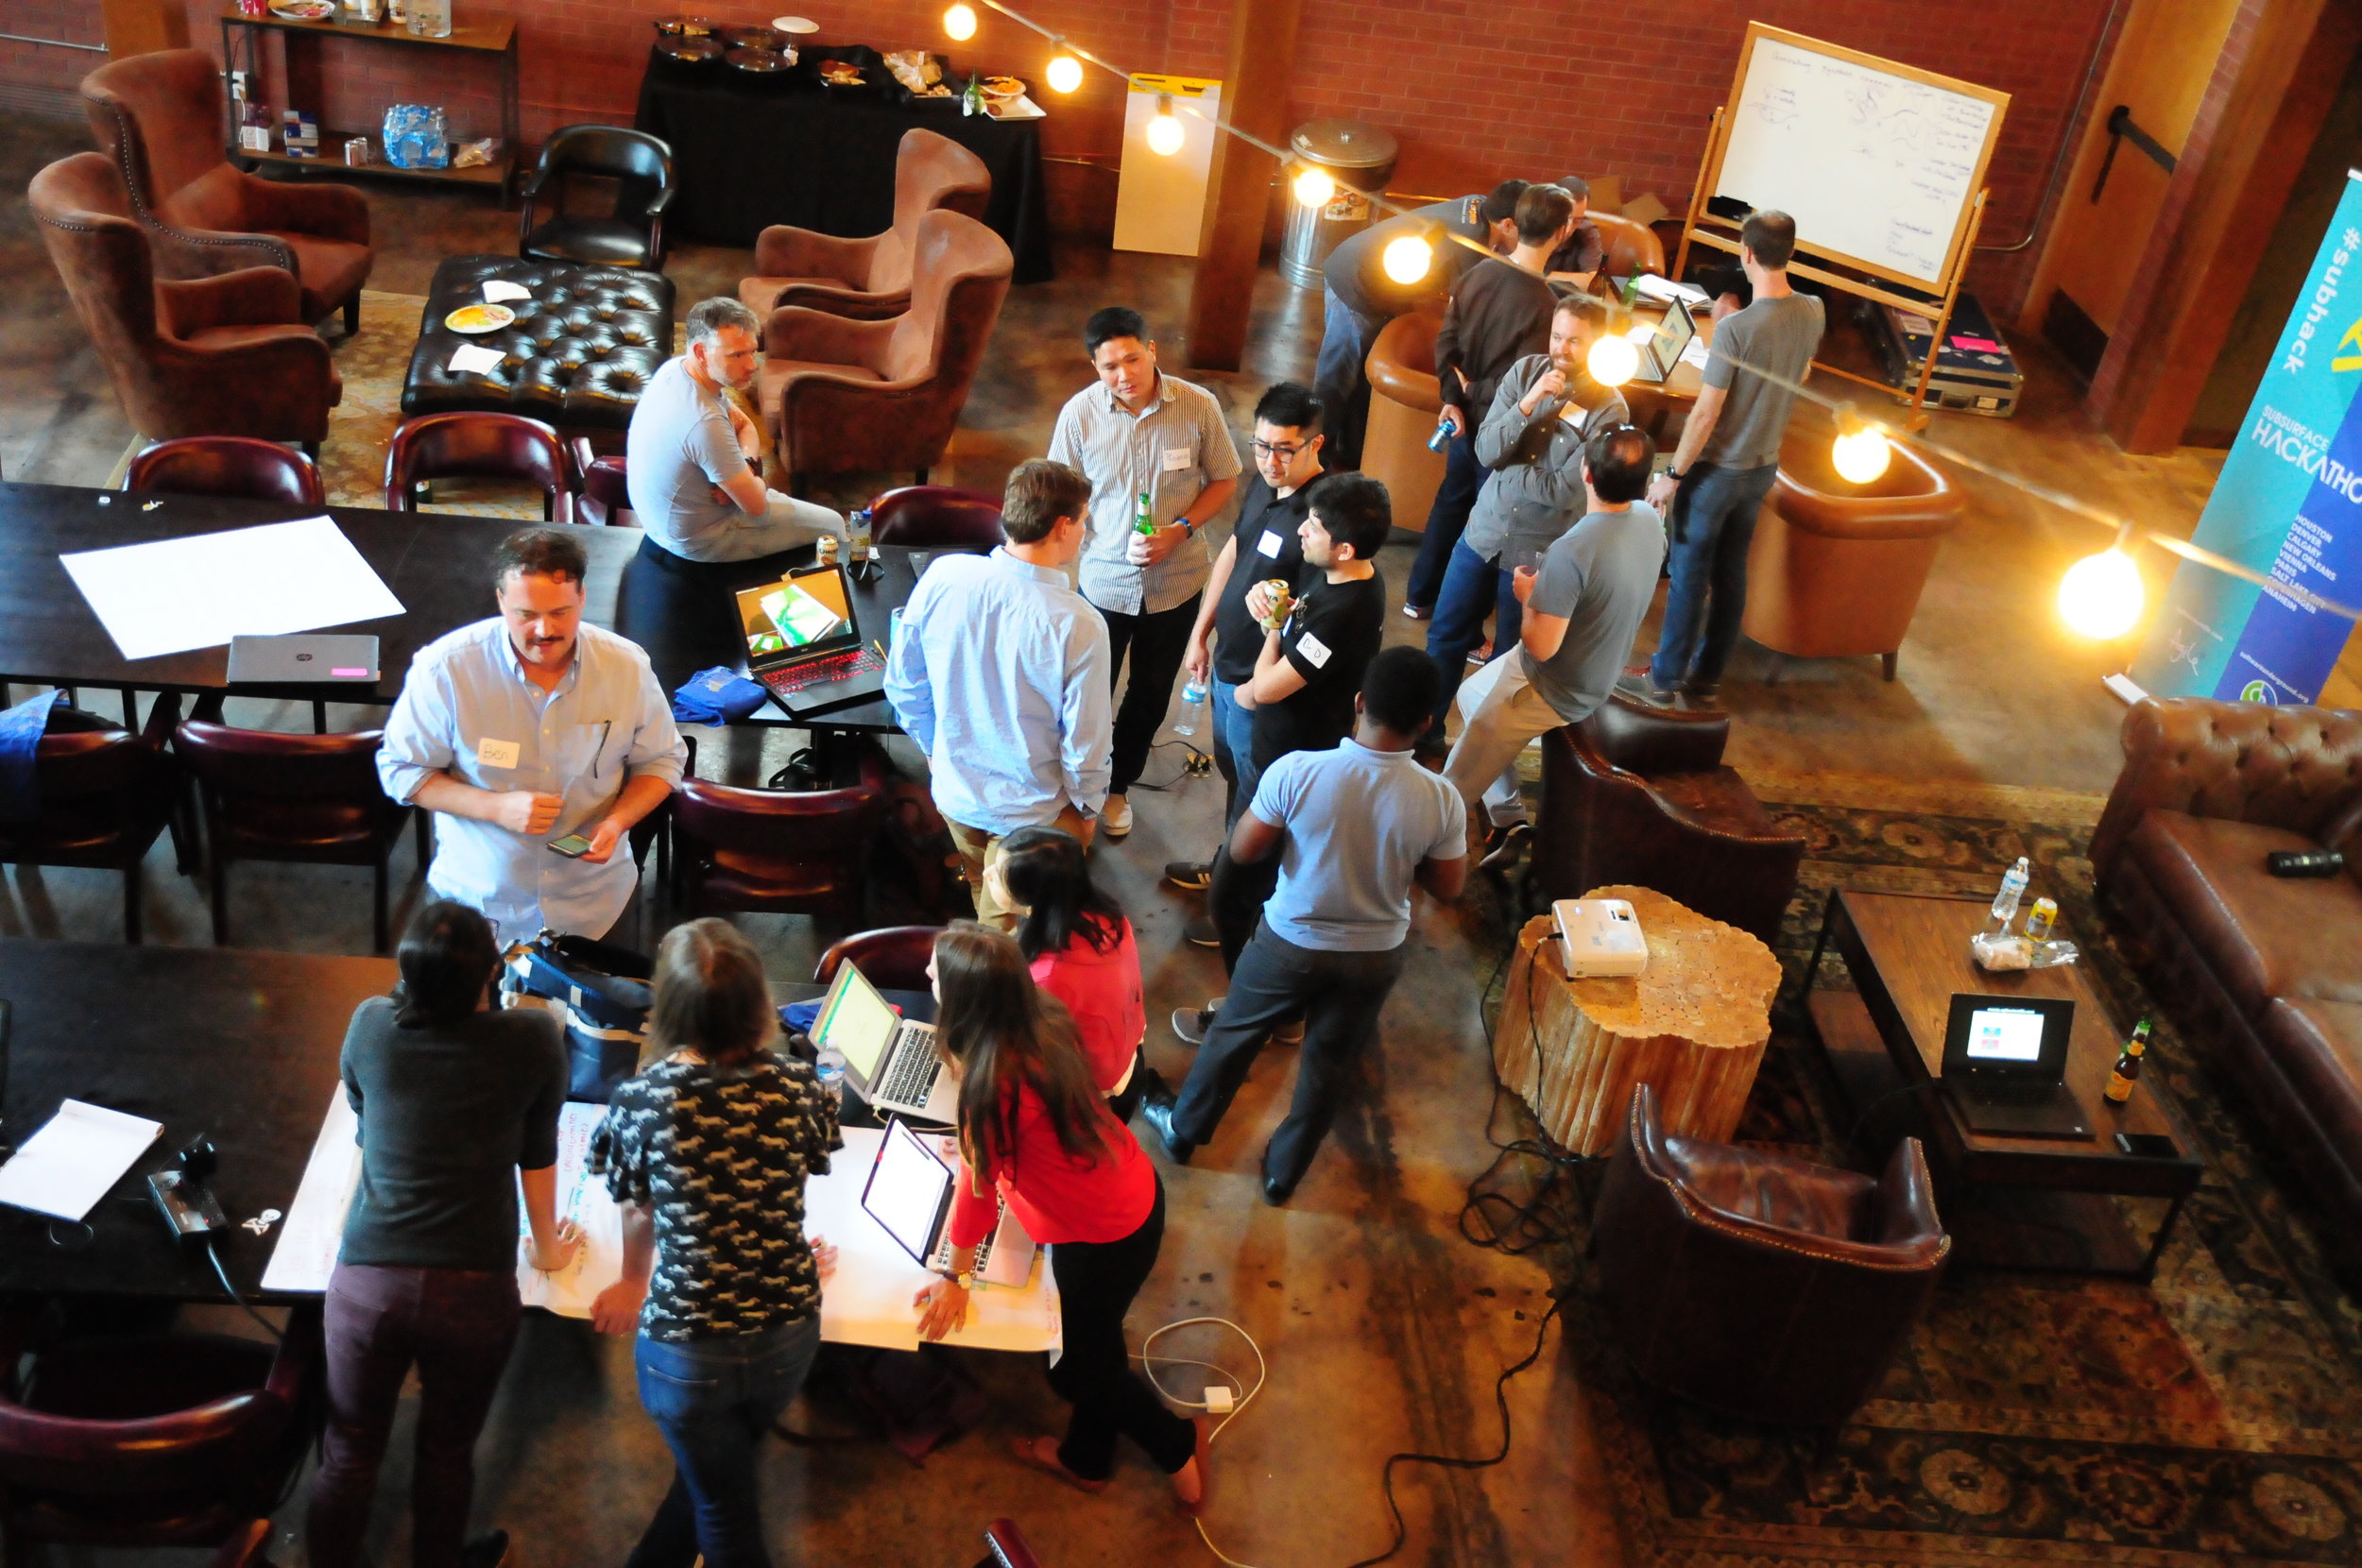
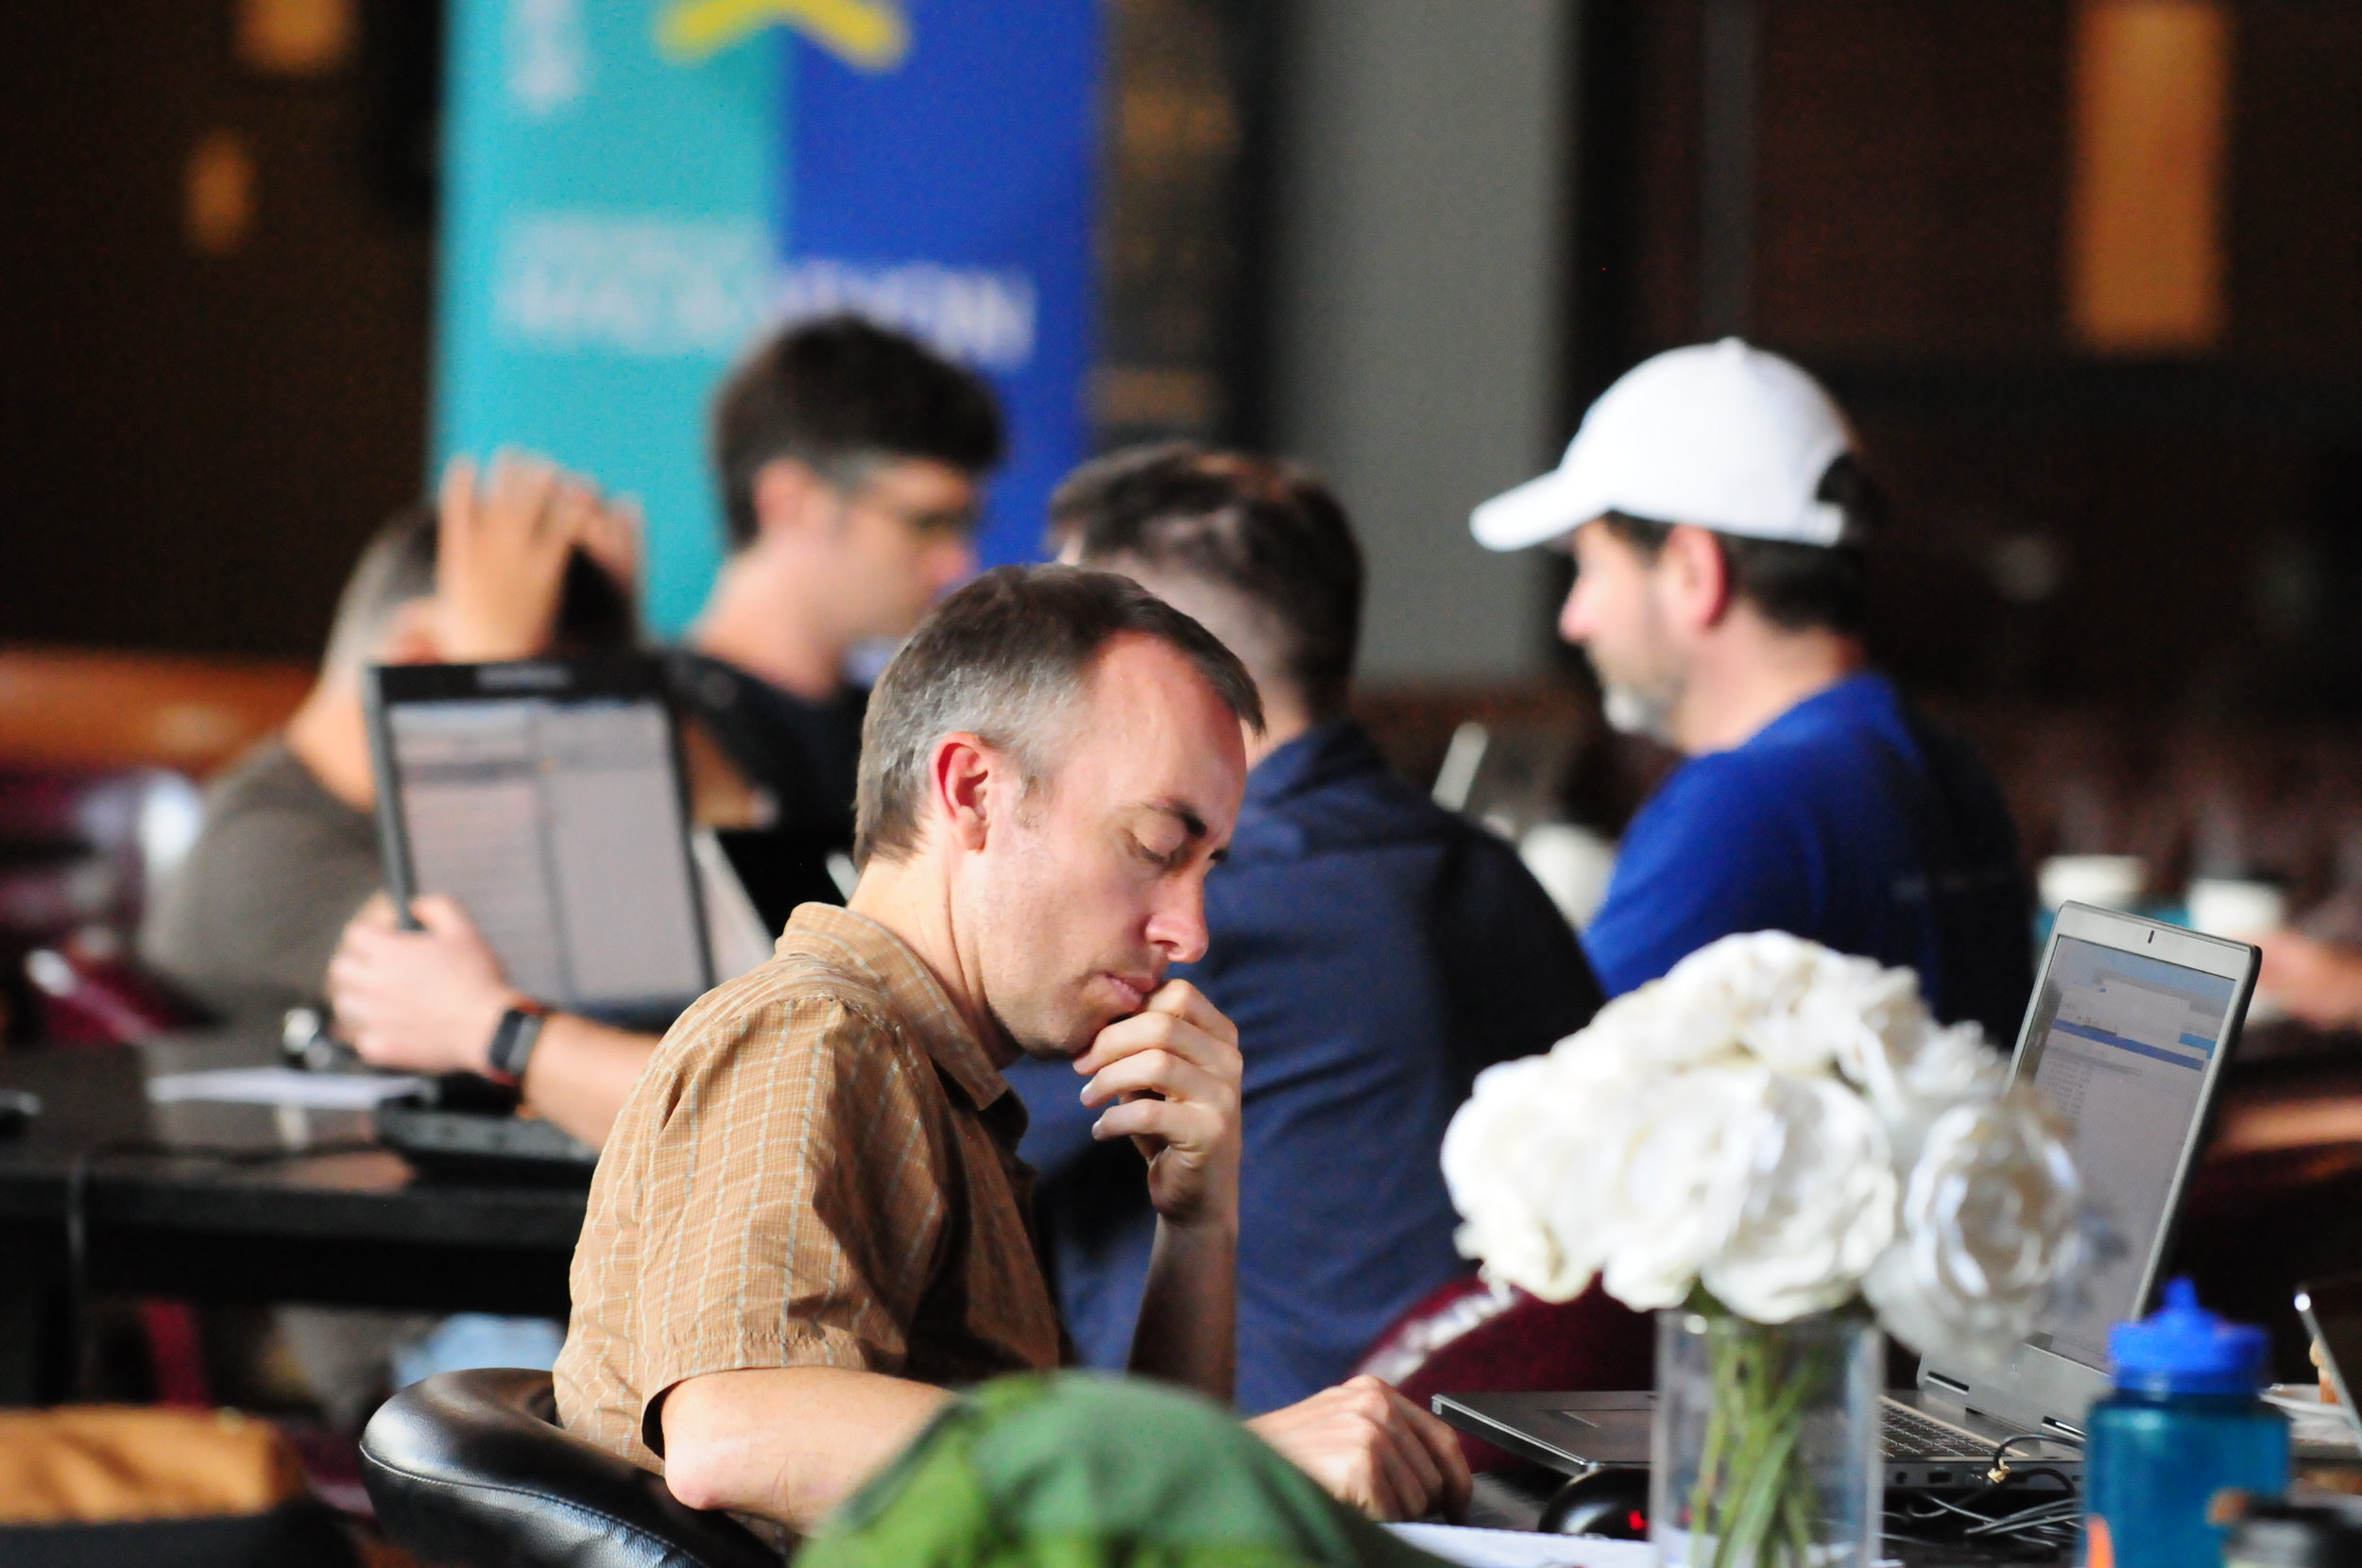
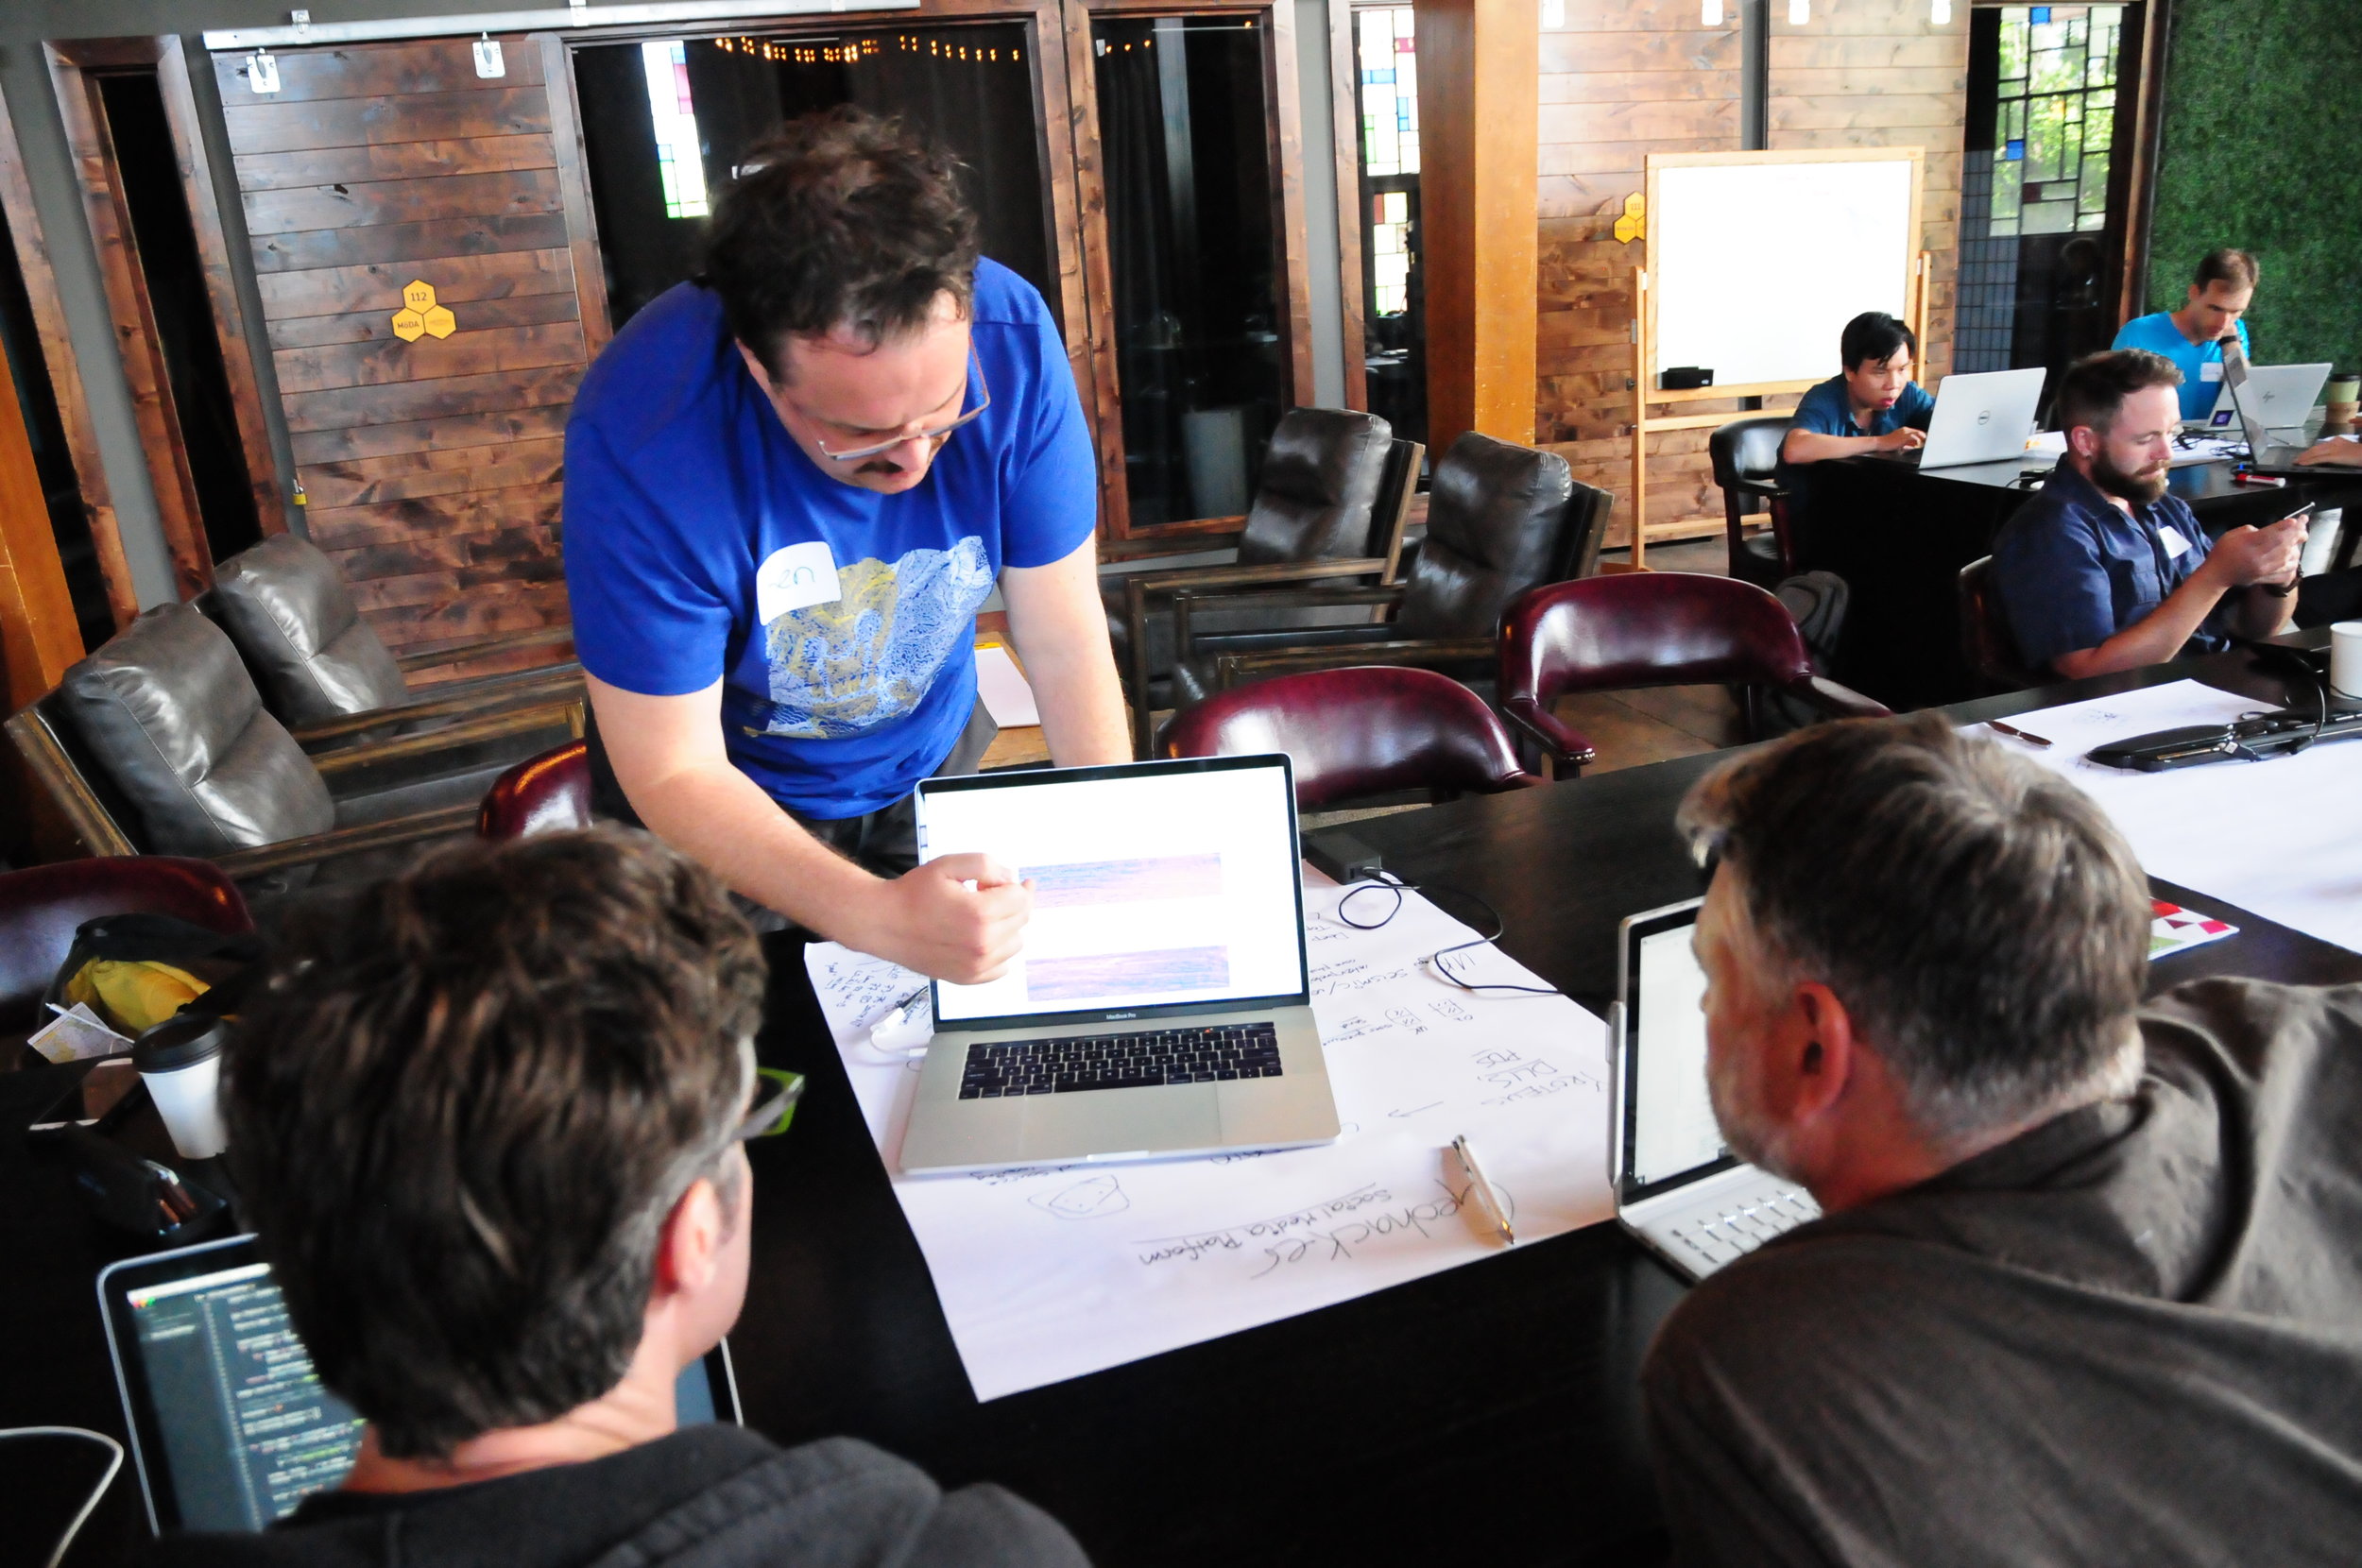
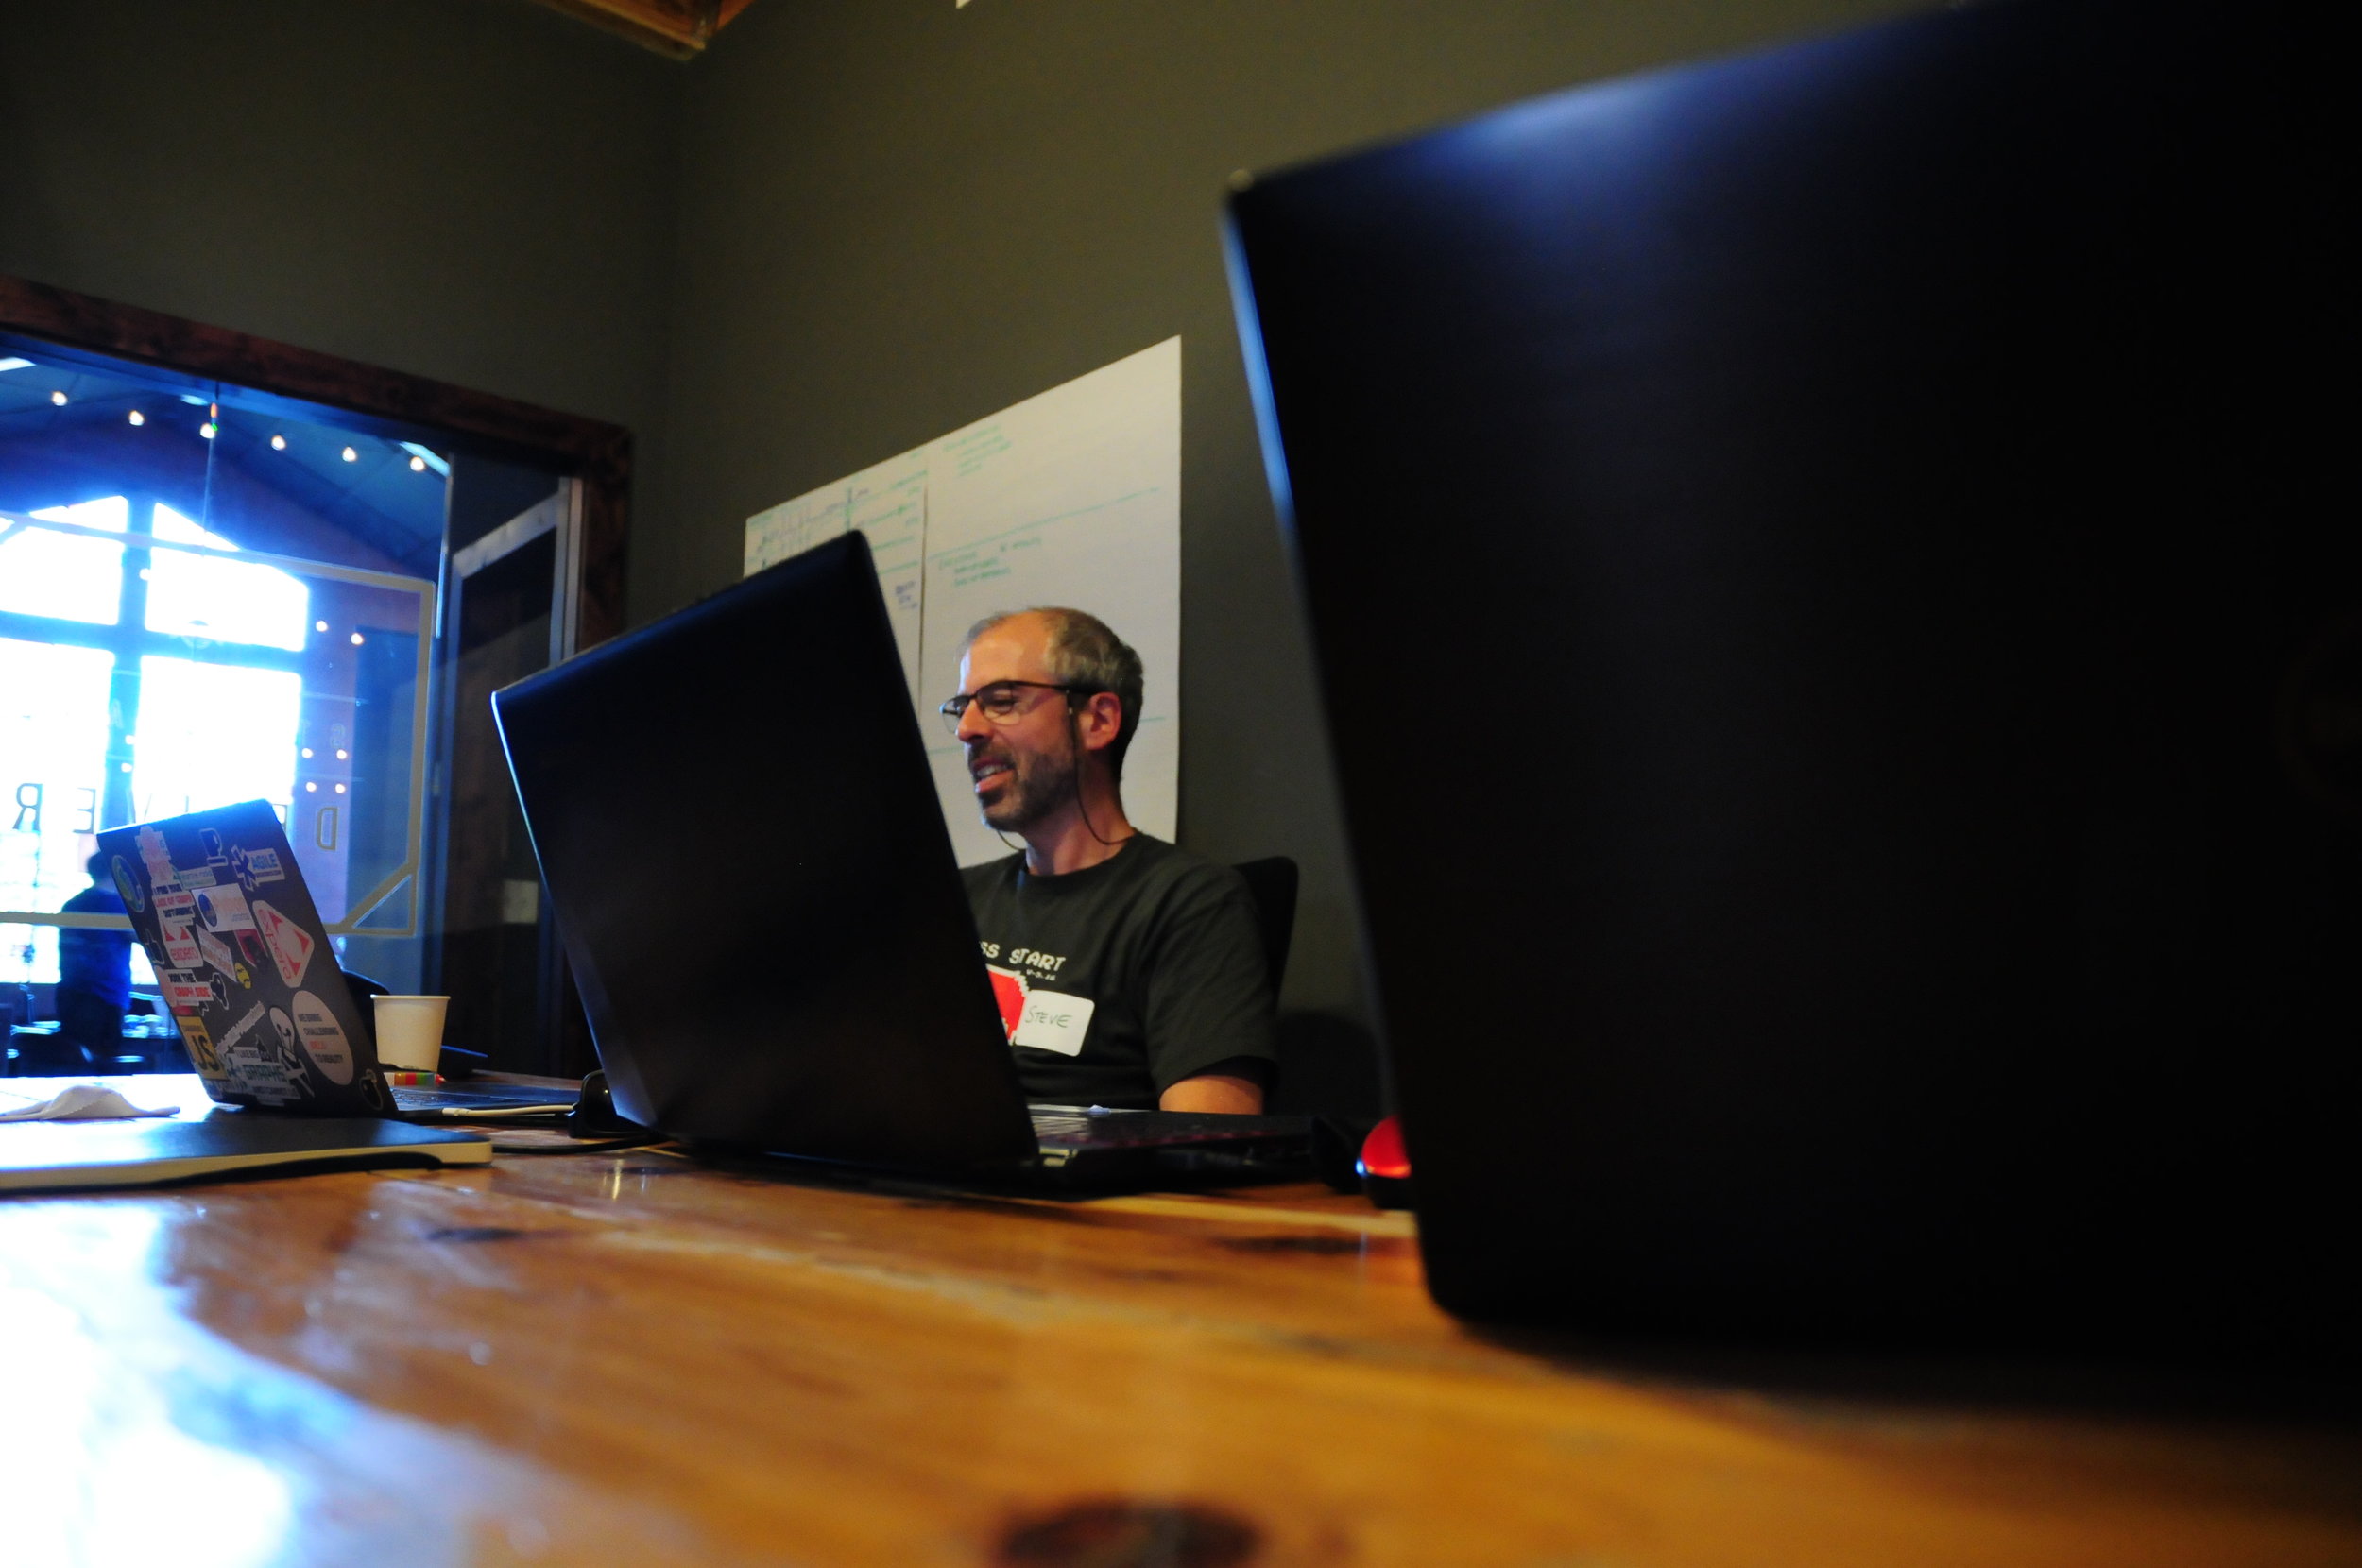
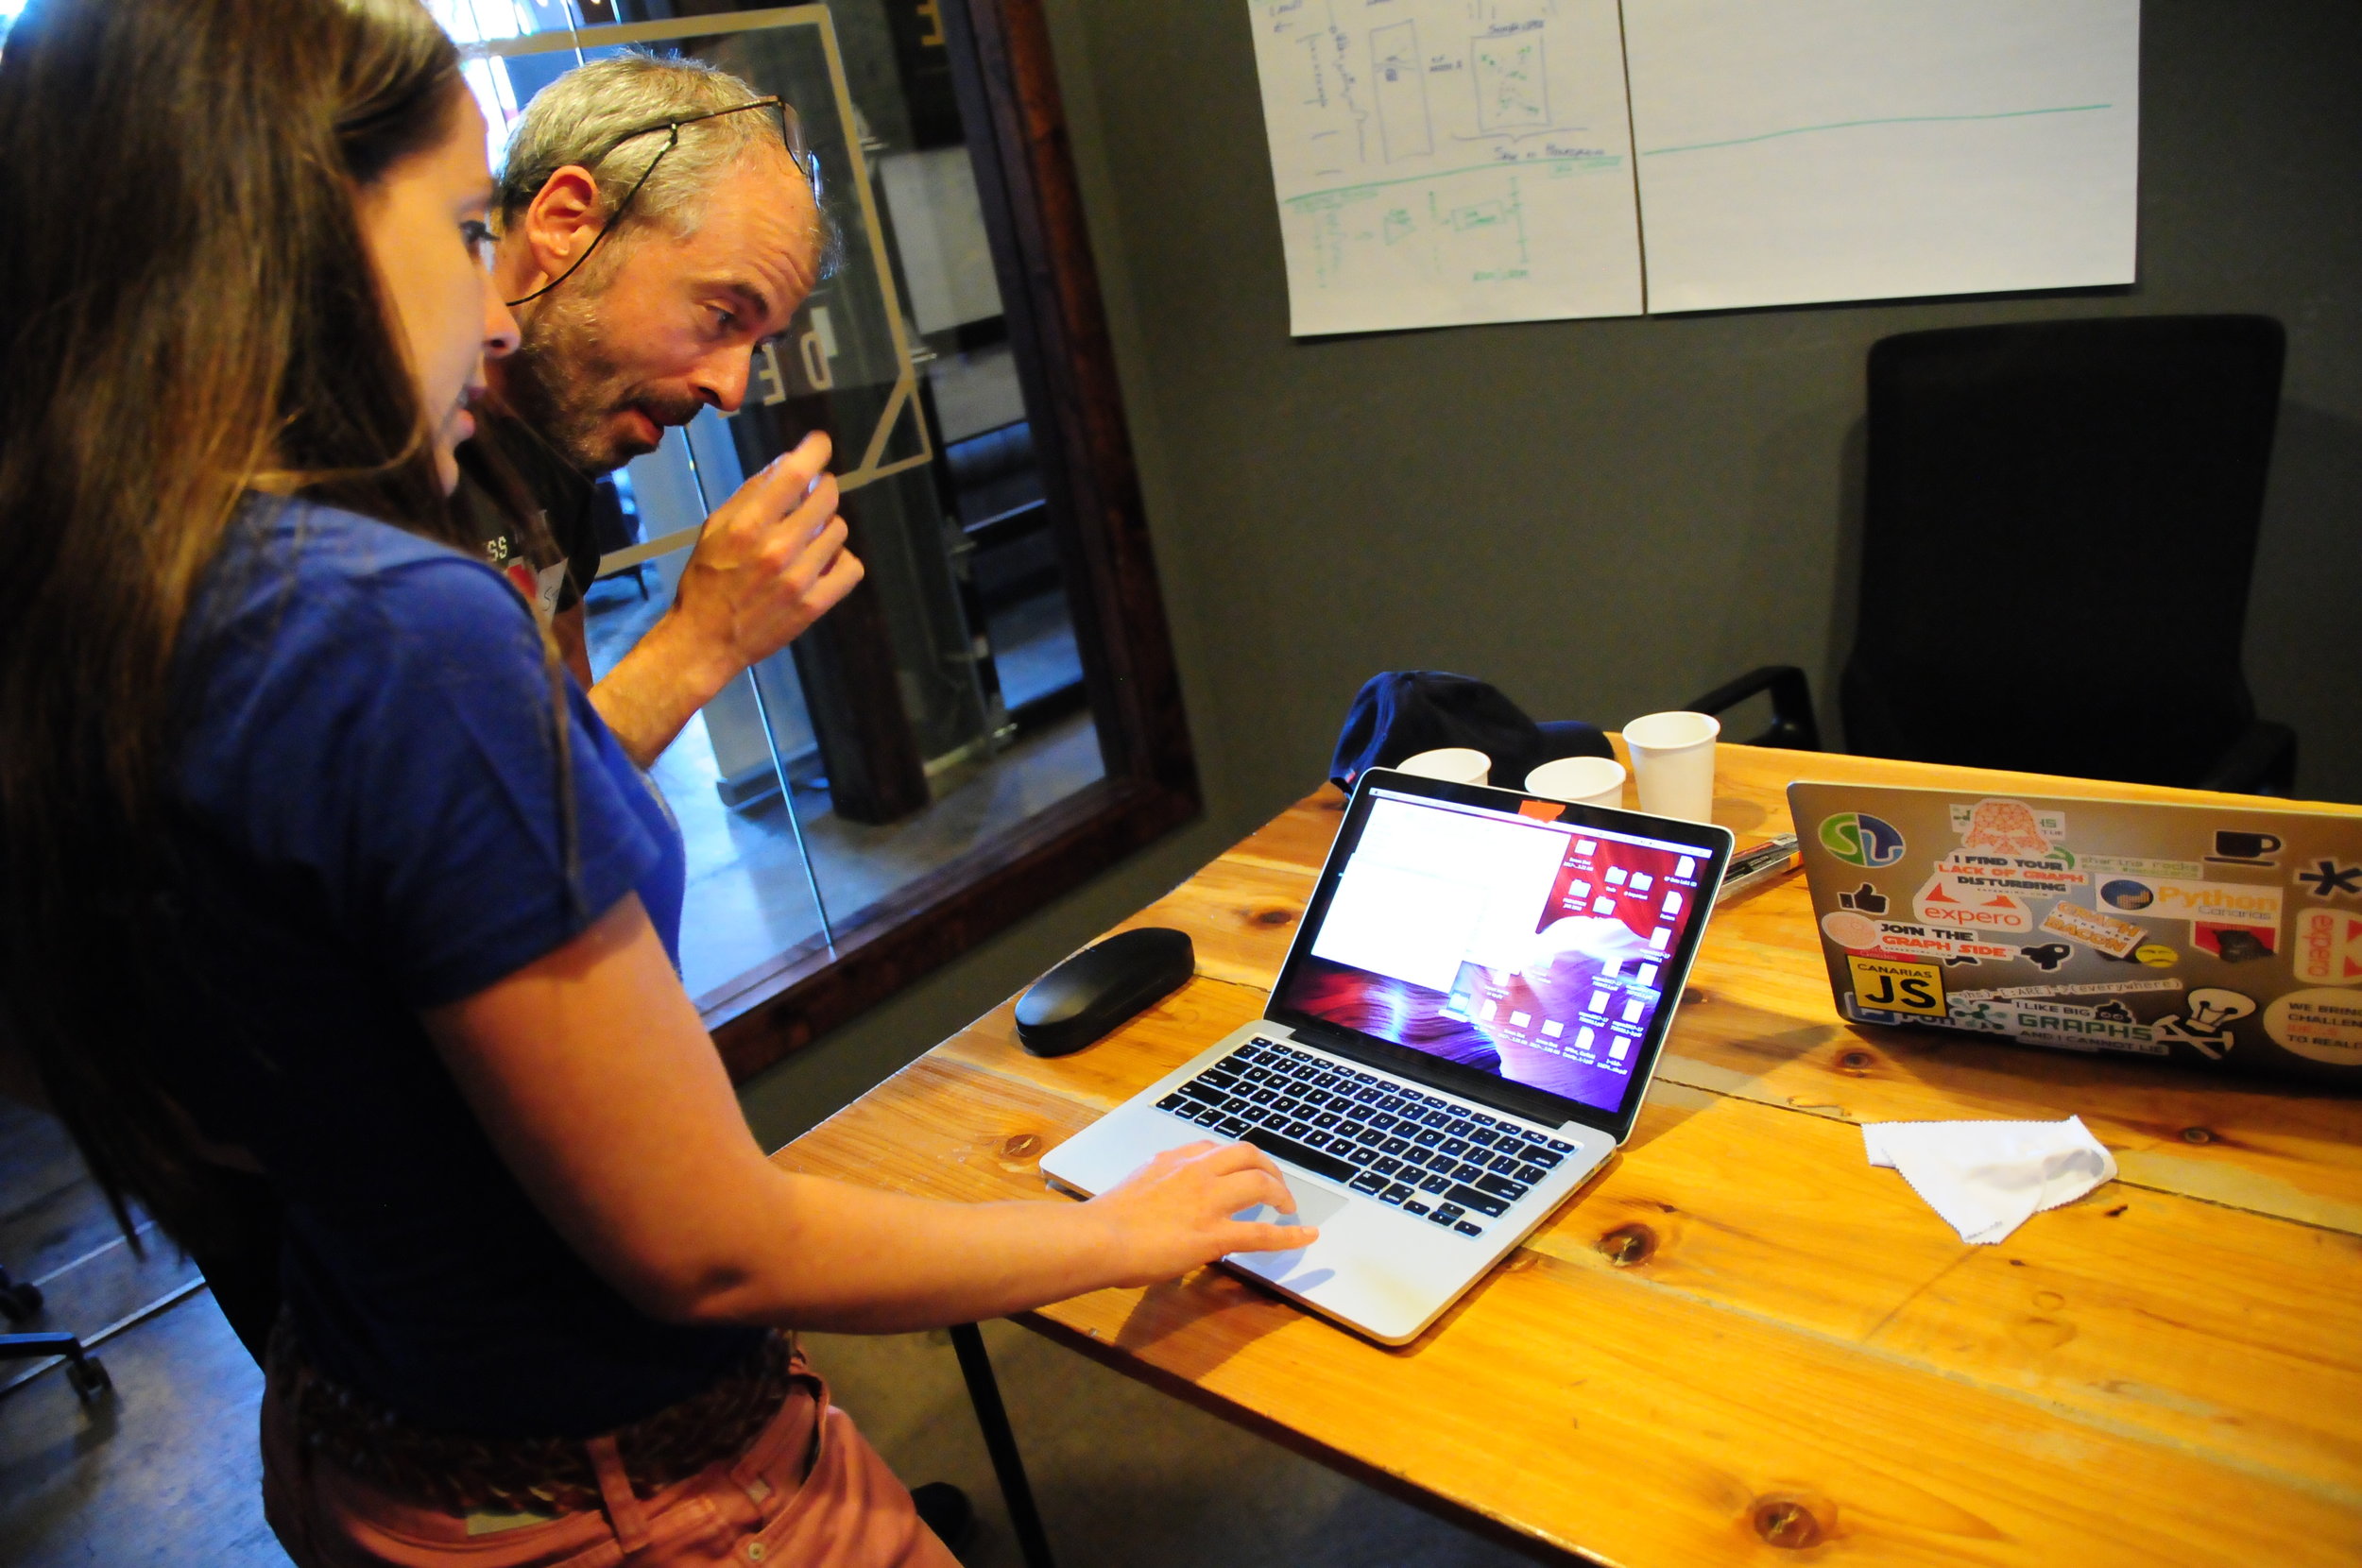
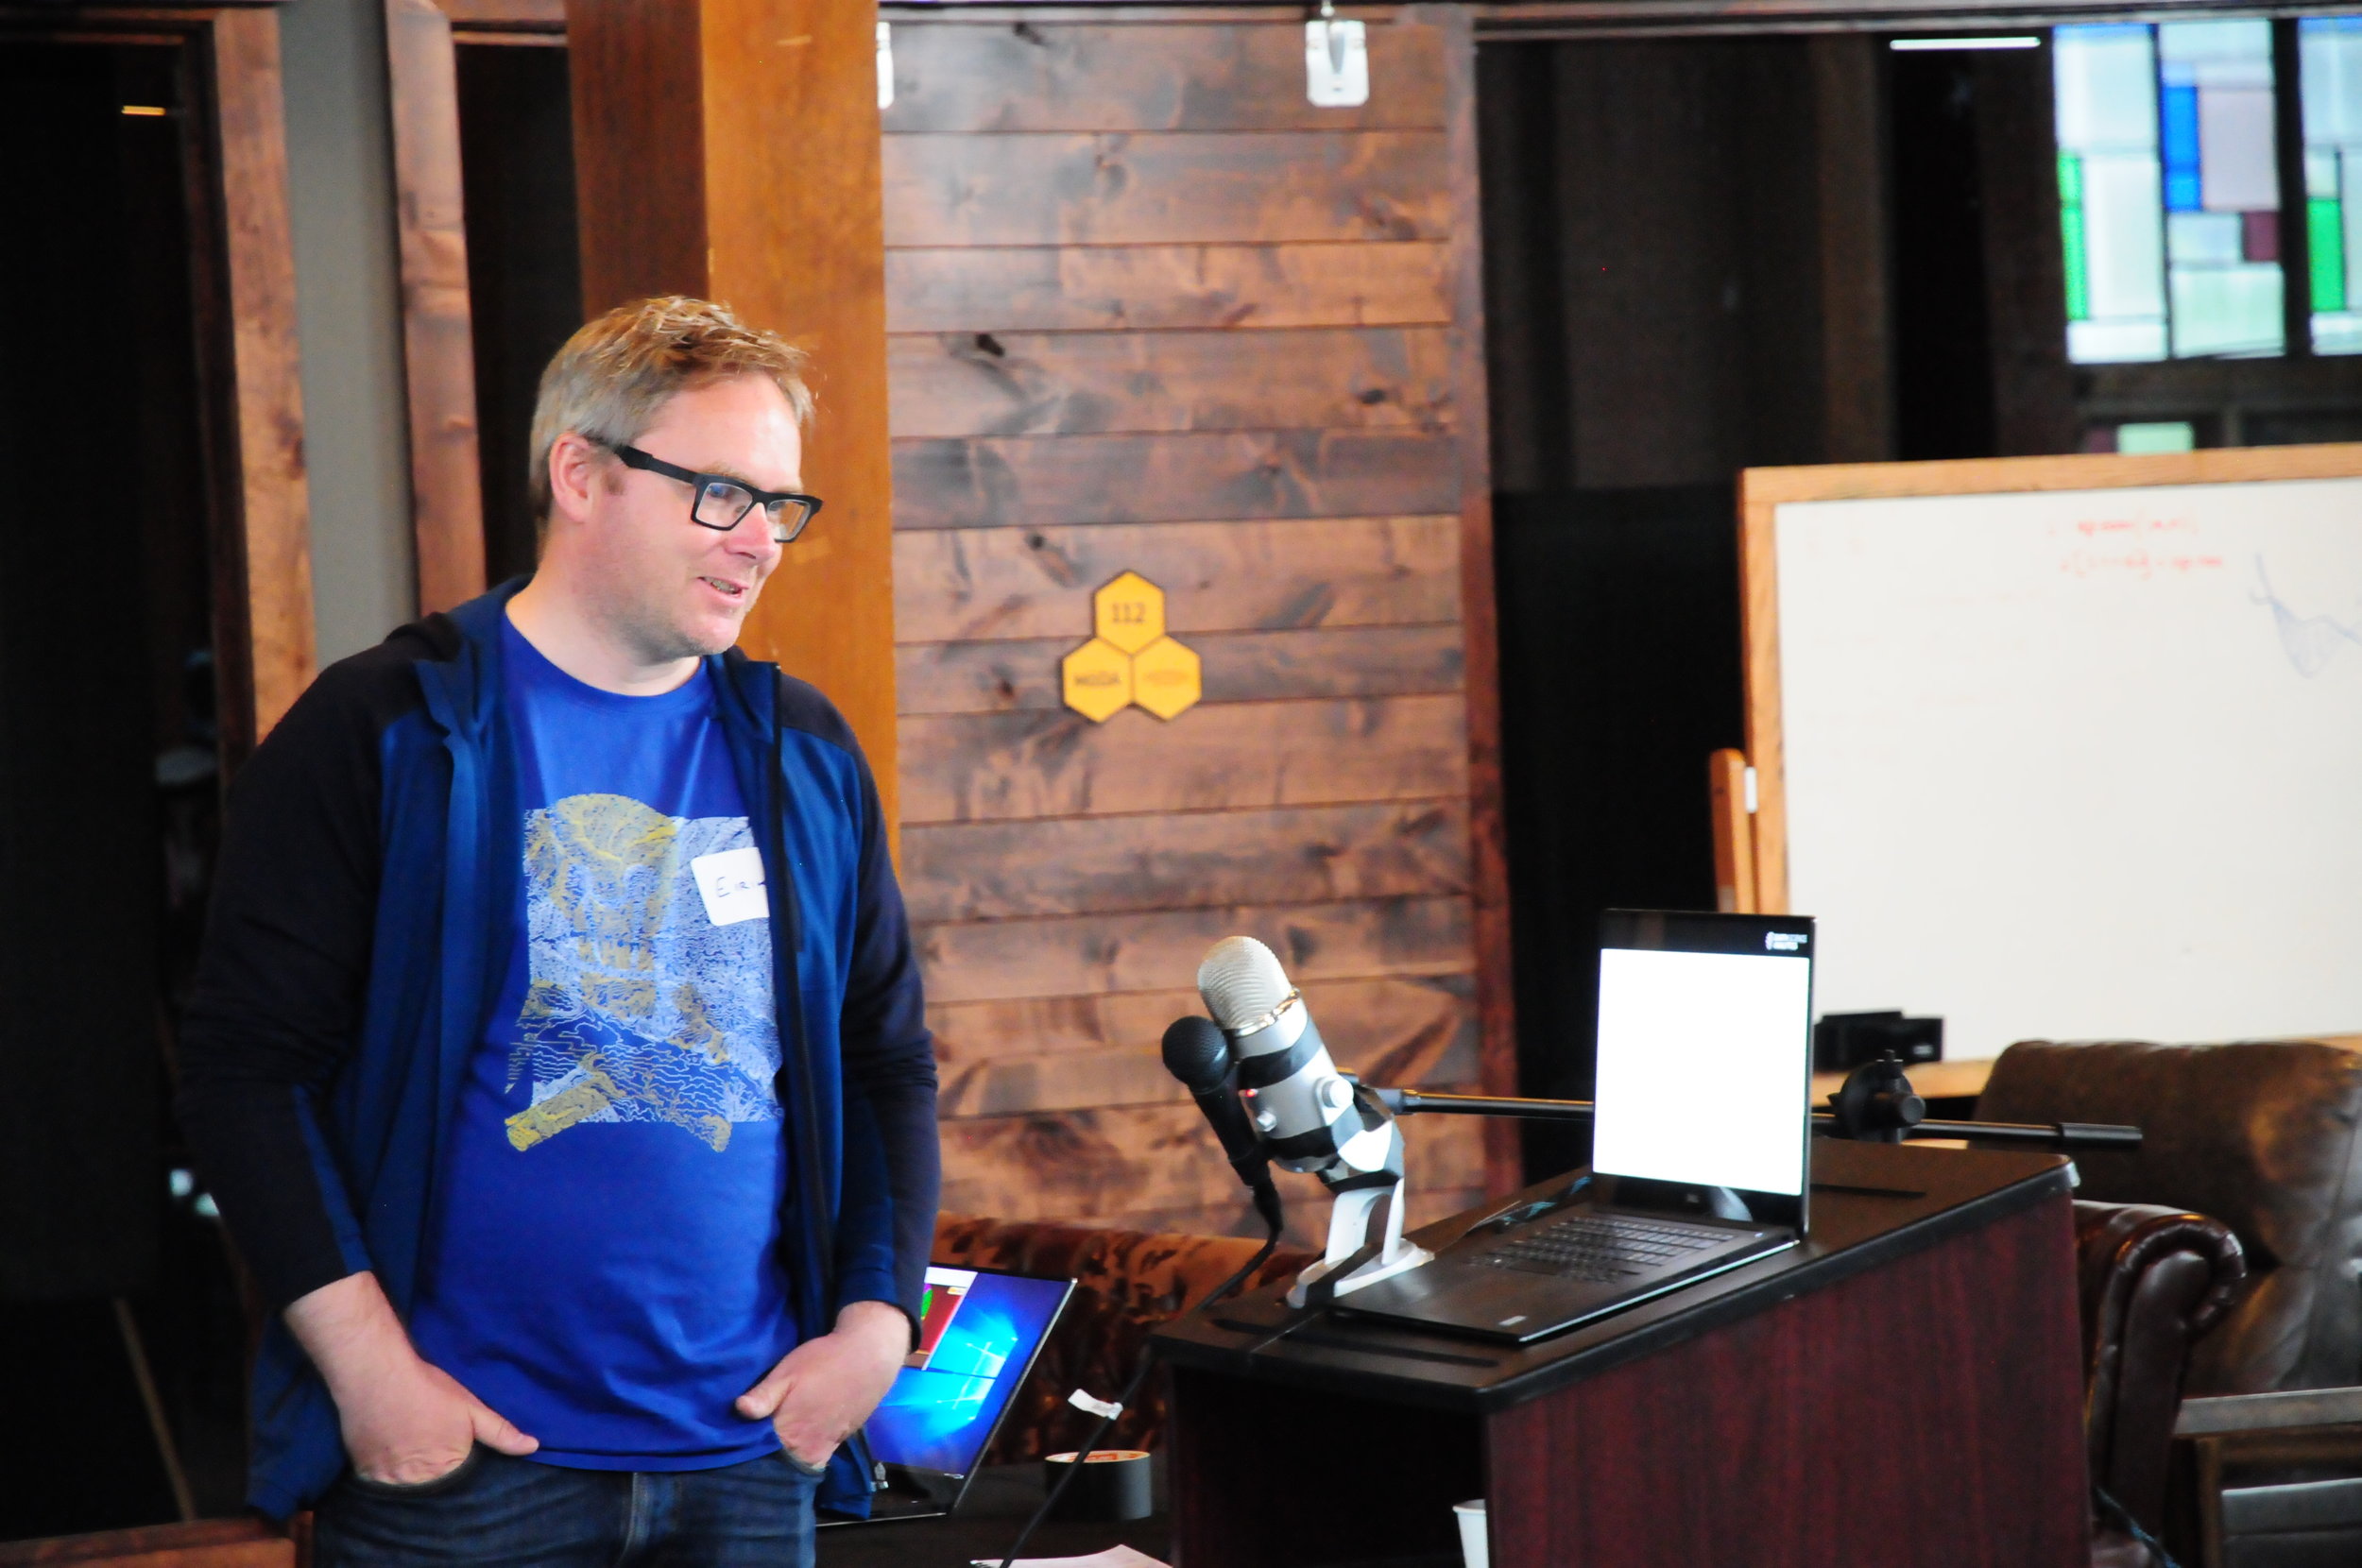
The code show in full swing.
v 2.0 next year... maybe?
The booth experience was new to us. Quite a few people came to find us, so it was nice to have a base, rather than cruising around as we usually do. I'd been hoping to get more people set up with Python on their own machines, but this may be too in-depth for most people in a trade show setting. Most were happy to see some new things and maybe tap out some Python on a keyboard.
Overall, I'd call it a successful experiment. If we do it next year in London, we have a very good idea of how to shape an even more engaging experience. I think most visitors enjoyed themselves this year though; If you were one of them, we'd love to hear from you!


 Except where noted, this content is licensed