Volve: not open after all
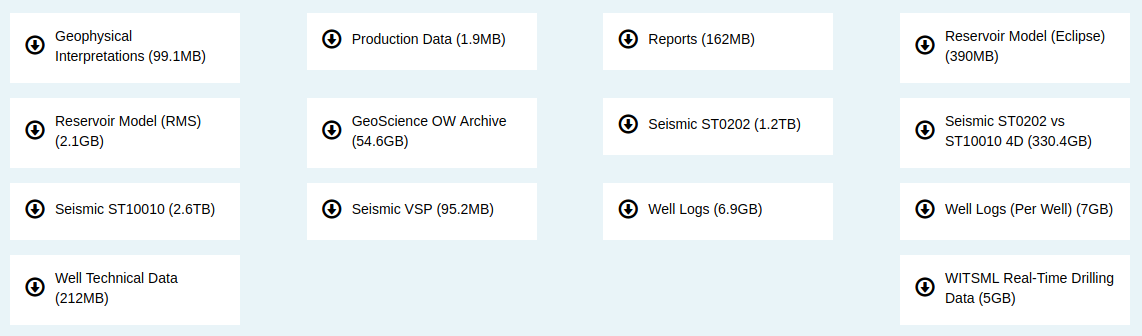
Back in June, Equinor made the bold and exciting decision to release all its data from the decommissioned Volve oil field in the North Sea. Although the intent of the release seemed clear, the dataset did not carry a license of any kind. Since you cannot use unlicensed content without permission, this was a problem. I wrote about this at the time.

To its credit, Equinor listened to the concerns from me and others, and considered its options. Sensibly, it chose an off-the-shelf license. It announced its decision a few days ago, and the dataset now carries a Creative Commons Attribution-NonCommercial-ShareAlike license.

Unfortunately, this license is not ‘open’ by any reasonable definition. The non-commercial stipulation means that a lot of people, perhaps most people, will not be able to legally use the data (which is why non-commercial licenses are not open licenses). And the ShareAlike part means that we’re in for some interesting discussion about what derived products are, because any work based on Volve will have to carry the CC BY-NC-SA license too.

Non-commercial licenses are not open

Here are some of the problems with the non-commercial clause:
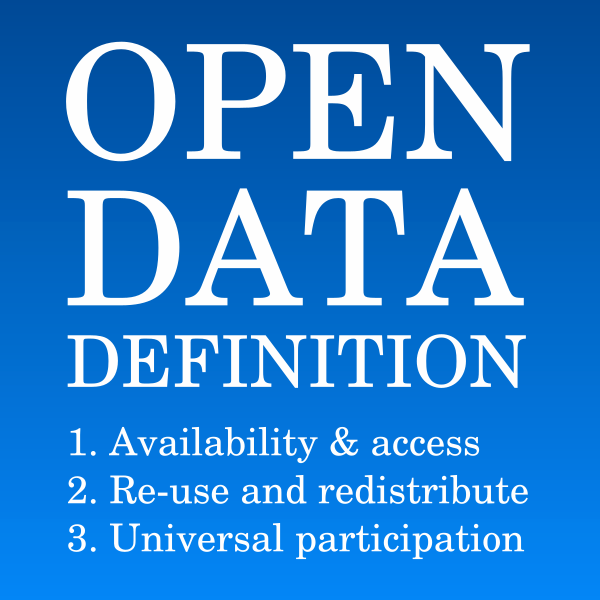
NC licenses come at a high societal cost: they provide a broad protection for the copyright owner, but strongly limit the potential for re-use, collaboration and sharing in ways unexpected by many users

  • NC licenses are incompatible with CC-BY-SA. This means that the data cannot be used on Wikipedia, SEG Wiki, or AAPG Wiki, or in any openly licensed work carrying that license.

  • NC-licensed data cannot be used commercially. This is obvious, but far-reaching. It means, for example, that nobody can use the data in a course or event for which they charge a fee. It means nobody can use the data as a demo or training data in commercial software. It means nobody can use the data in a book that they sell.

  • The boundaries of the license are unclear. It's arguable whether any business can use the data for any purpose at all, because many of the boundaries of the scope have not been tested legally. What about a course run by AAPG or SEG? What about a private university? What about a government, if it stands to realize monetary gain from, say, a land sale? All of these uses would be illiegal, because it’s the use that matters, not the commercial status of the user.

Now, it seems likely, given the language around the release, that Equinor will not sue people for most of these use cases. They may even say this. Goodness knows, we have enough nudge-nudge-wink-wink agreements like that already in the world of subsurface data. But these arrangements just shift the onus onto the end use and, as we’ve seen with GSI, things can change and one day you wake up with lawsuits.

ShareAlike means you must share too

Creative Commons licenses are, as the name suggests, intended for works of creativity. Indeed, the whole concept of copyright, depends on creativity: copyright protects works of creative expression. If there’s no creativity, there’s no basis for copyright. So for example, a gamma-ray log is unlikely to be copyrightable, but seismic data is (follow the GSI link above to find out why). Non-copyrightable works are not covered by Creative Commons licenses.

All of which is just to help explain some of the language in the CC BY-NC-SA license agreement, which you should read. But the key part is in paragraph 4(b):

You may distribute, publicly display, publicly perform, or publicly digitally perform a Derivative Work only under the terms of this License

What’s a ‘derivative work’? It’s anything ‘based upon’ the licensed material, which is pretty vague and therefore all-encompassing. In short, if you use or show Volve data in your work, no matter how non-commercial it is, then you must attach a CC BY-NC-SA license to your work. This is why SA licenses are sometimes called ‘viral’.

By the way, the much-loved F3 and Penobscot datasets also carry the ShareAlike clause, so any work (e.g. a scientific paper) that uses them is open-access and carries the CC BY-SA license, whether the author of that work likes it or not. I’m pretty sure no-one in academic publishing knows this.

By the way again, everything in Wikipedia is CC BY-SA too. Maybe go and check your papers and presentations now :)

problems-dont-have.png

What should Equinor do?

My impression is that Equinor is trying to satisfy some business partner or legal edge case, but they are forgetting that they have orders of magnitude more capacity to deal with edge cases than the potential users of the dataset do. The principle at work here should be “Don’t solve problems you don’t have”.

Encumbering this amazing dataset with such tight restrictions effectively kills it. It more or less guarantees it cannot have the impact I assume they were looking for. I hope they reconsider their options. The best choice for any open data is CC-BY.

Machine learning goes mainstream

At our first machine-learning-themed hackathon, in New Orleans in 2015, we had fifteen hackers. TImes were hard in the industry. Few were willing or able to compe out and play. Well, it’s now clear that times have changed! After two epic ML hacks last year (in Paris and Houston), at which we hosted about 115 scientists, it’s clear this year is continuing the trend. Indeed, by the end of 2018 we expect to have welcomed at least 240 more digital scientists to hackathons in the US and Europe.

Conclusion: something remarkable is happening in our field.

The FORCE hackathon

Last Tuesday and Wednesday, Agile co-organized the FORCE Machine Learning Hackathon in Stavanger, Norway. FORCE is a cross-industry geoscience organization, coordinating meetings and research in subsurface. The event preceeded a 1-day symposium on the same theme: machine learning in geoscience. And it was spectacular.

Get a flavour of the spectacularness in Alessandro Amato’s beautiful photographs:

Fifty geoscientists and engineers spent two days at the Norwegian Petroleum Directorate (NPD) in Stavanger. Our hosts were welcoming, accommodating, and generous with the waffles. As usual, we gently nudged the participants into teams, and encouraged them to define projects and find data to work on. It always amazes me how smoothly this potentially daunting task goes; I think this says something about the purposefulness and resourcefulness of our community.

Here’s a quick run-down of the projects:

  • Biostrat! Geological ages from species counts.

  • Lost in 4D Space. Pressure drawdown prediction.

  • Virtual Metering. Predicting wellhead pressure in real time.

  • 300 Wells. Extracting shows and uncertainty from well reports.

  • AVO ML. Unsupervised machine learning for more geological AVO.

  • Core Images. Grain size and lithology from core photos.

  • 4D Layers. Classification engine for 4D seismic data.

  • Gully Attack. Strat trap picking with deep reinforcement learning.

  • sketch2seis. Turning geological cartoons into seismic with pix2pix.

I will do a complete review of the projects in the coming few days, but notice the diversity here. Five of the projects straddle geological topics, and five are geophysical. Two or three involve petroleum engineering issues, while two or three move into sed/strat. We saw natural language processing. We saw random forests. We saw GANs, VAEs, and deep reinforcement learning. In terms of input data, we saw core photos, PDF reports, synthetic seismograms, real-time production data, and hastily assembled label sets. In short — we saw everything.

Takk skal du ha

Many thanks to everyone that helped the event come together:

  • Peter Bormann, the mastermind behind the symposium, was instrumental in making the hackathon happen.

  • Grete Block Vargle (AkerBP) and Pernille Hammernes (Equinor) kept everyone organized and inspired.

  • Tone Helene Mydland (NPD) and Soelvi Amundrud (NPD) made sure everything was logistically honed.

  • Eva Halland (NPD) supported the event throughout and helped with the judging.

  • Alessandro Amato del Monte (Eni) took some fantastic photos — as seen in this post.

  • Diego Castaneda and Rob Leckenby helped me on the Agile side of things, and helped several teams.

And a huge thank you to the sponsors of the event — too many to name, but here they all are:

all_small.png

There’s more to come!

If you’re reading this thinking, “I’d love to go to a geoscience hackathon”, and you happen to live in or near the UK, you’re in luck! There are two machine learning geoscience hackathons coming up this fall:

Don’t miss out! Get signed up and we’ll see you there.

Are there benefits to pseudoscience?

No, of course there aren't. 

Balance! The scourge of modern news. CC-BY by SkepticalScience.com

Balance! The scourge of modern news. CC-BY by SkepticalScience.com

Unless... unless you're a journalist, perhaps. Then a bit of pseudoscience can provide some much-needed balance — just to be fair! — to the monotonic barrage of boring old scientific consensus. Now you can write stories about flat-earthers, anti-vaxxers, homeopathy, or the benefits of climate change!*

So far, so good. It's fun to pillory the dimwits who think the moon landings were filmed in a studio in Utah, or that humans have had no impact on Earth's climate. The important thing is for the journalist to have a clear and unequivocal opinion about it. If an article doesn't make it clear that the deluded people at the flat-earth convention ("Hey, everyone thought Copernicus was mad!") have formed their opinions in spite of, not because of, the overwhelming evidence before them, then readers might think the journalist — and the publisher — agree with them.

In other words, if you report on hogwash, then you had better say that it's hogwash, or you end up looking like one of the washers of the hog.


Fake geoscience?

AAPG found this out recently, when the August issue of its Explorer magazine published an article by Ken Milam called Are there benefits to climate change? Ken was reporting on a talk by AAPG member Greg Wrightstone at URTeC in July. Greg wrote a book called Inconvenient Facts: The Science That Al Gore Doesn't Want You To Know. The gist: no need to be concerned about carbon dioxide because, "The U.S. Navy’s submarines often exceed 8,000 ppm (20 times current levels) and there is no danger to our sailors" — surely some of the least watertight reasoning I've ever encountered. Greg's basic idea is that, since the earth has been warmer before, with higher levels of CO2, there's nothing to worry about today (those Cretaceous conurbations and Silurian civilizations had no trouble adapting!) So he thinks, "the correct policy to address climate change is to have the courage to do nothing".

So far, so good. Except that Ken — in reporting 'just the facts' — didn't mention that Greg's talk was full of half-truths and inaccuracies and that few earth scientists agree with him. He forgot to remark upon the real news story: how worrying it is that URTeC 2018 put on a breakfast promoting Greg and his marginal views. He omitted to point out that this industry needs to grow up and face the future with reponsibility, supporting society with sound geoscience.

So it looked a bit like Explorer and AAPG were contributing to the washing of this particular hog.


Discussion

As you might expect, there was some discussion about the article — both on aapg.org and on Twitter (and probably elsewhere). For example, Mark Tingay (University of Adelaide) called AAPG and SPE out:

So did Brian Romans (Virginia Tech):

And there was further discussion (sort of) involving Greg Wrightstone himself. Trawl through Mark Tingay's timeline, especially his systematic dismantling of Greg's 'evidence', if your curiosity gets the better of you.


Response

Of course AAPG noticed the commotion. The September issue of Explorer contains two statements from AAPG staff. David Curtiss, AAPG Executive Director, said this in his column:

Milam was assigned to report on an invited presentation by Greg Wrightstone, a past president of AAPG’s Eastern Section, based on a recently self-published book on climate change, at the Unconventional Resources Technology Conference in July. Here was an AAPG Member and past section officer speaking about climate change – an issue of interest to many of our members, who had been invited by a group of his geoscience and engineering peers to present at a topical breakfast – not a technical session – at a major conference.

This sounds fine, on the face of it, but details matter. A glance at the book in question should have been enough to indicate that the content of the talk could only have been presented in a non-technical session, with a side of hash browns.

Anyway, David does go on to point out the tension between the petroleum industry's activities and society's environmental concerns. The tension is real, and AAPG and its members, are in the middle of it. We can contribute scientifically to the conversations that need to happen to resolve that tension. But pushing junk science and polemical bluster is definitely not going to help. I believe that most of the officers and members of AAPG agree. 

The editor of Explorer, Brian Ervin, had this to say:

For the record, none of our coverage of any issue or any given perspective on an issue should be taken as an endorsement — explicit or implicit — of that perspective. Also, the EXPLORER is — quite emphatically — not a scientific journal. Our content is not peer-reviewed. [...] No, the EXPLORER exists for an entirely different purpose. We provide news about Earth science, the industry and the Association, so our mission is different and unrelated to that of a scientific publication.

He goes on to say that he knew that Wrightstone's views are not popular and that it would provoke some reaction, but wanted to present it impartially and "give [readers] the opportunity to evaluate his position for themselves".

I just hope Explorer doesn't start doing this with too many other marginal opinions.


I'd have preferred to see AAPG back-pedal a bit more energetically. Publishing this article was a mistake. AAPG needs to think about the purpose, and influence, of its reporting, as well as its stance on climate change (which, according to David Curtiss, hasn't been discussed substantially in more than 10 years). This isn't about pushing agendas, any more than talking about the moon landings is about pushing agendas. It's about being a modern scientific association with high aspirations for itself, its members, and society.

Visualization in Copenhagen, part 2

In Part 1, I wrote about six of the projects teams contributed at the Subsurface Hackathon in Copenhagen in June. Today I want to tell you about the rest of them. 


A data exploration tool

Team GeoClusterFu...n: Dan Stanton (University of Leeds), Filippo Broggini (ETH Zürich), Francois Bonneau (Nancy), Danny Javier Tapiero Luna (Equinor), Sabyasachi Dash (Cairn India), Nnanna Ijioma (geophysicist). 

Tech: Plotly Dash. GitHub repo.

Project: The team set out to build an interactive web app — a totally new thing for all of them — to make interactive plots from data in a CSV. They ended up with the basis of a useful tool for exploring geoscience data. Project page.

Four sixths of the GeoClusterFu...n team cluster around a laptop.

Four sixths of the GeoClusterFu...n team cluster around a laptop.


AR outcrop on your phone

Team SmARt_OGs: Brian Burnham (University of Aberdeen), Tala Maria Aabø (Natural History Museum of Denmark), Björn Wieczoreck, Georg Semmler and Johannes Camin (GiGa Infosystems).

Tech: ARKit/ARCore, WebAR, Firebase. GitLab repo. 

Project: Bjørn and his colleagues from GiGa Infosystems have been at all the European hackathons. This time, he knew he wanted to get virtual outcrops on mobiles phones. He found a willing team, and they got it done! Project page.

Three views from the SmartOGs's video. See the full version.

Three views from the SmartOGs's video. See the full version.


Rock clusters in latent space

The Embedders: Lukas Mosser (Imperial College London), Jesper Dramsch (Technical University of Denmark), Ben Fischer (PricewaterhouseCoopers), Harry McHugh (DUG), Shubhodip Konar (Cairn India), Song Hou (CGG), Peter Bormann (ConocoPhillips).

Tech: Bokeh, scikit-learn, Multicore-TSNE. GitHub repo.

Project: There has been a lot of recent interest in the t-SNE algorithm as a way to reduce the dimensionality of complex data. The team explored its application to subsurface data, and found promising applications. Web page. Project page.

The Embeders built a web app to cluster the data in an LAS file. The clusters (top left) are generated by the t-SNE algorithm.

The Embeders built a web app to cluster the data in an LAS file. The clusters (top left) are generated by the t-SNE algorithm.


Fully mixed reality

Team Hands On GeoLabs: Will Sanger (Western Geco), Chance Sanger (Houston Museum of Fine Arts), Pierre Goutorbe (Total), Fernando Villanueva (Institut de Physique du Globe de Paris).

Project: Starting with the ambitious goal of combining the mixed reality of the Meta AR gear with the mixed reality of the Gempy sandbox, the team managed to display and interact with some seismic data in the AR headset, which  allows interaction with simple hand gestures. Project page.

The team demonstrate the Meta AR headset.

The team demonstrate the Meta AR headset.


Huge grids over the web

Team Grid Vizards: Fabian Kampe, Daniel Buse, Jonas Kopcsek, Paul Gabriel (all from GiGa Infosystems)

Tech: three.js. GitHub repo.

Project: Paul and his team wanted to visualize hundreds of millions or billions of grid cells — all in the browser. They ended up with about 20 million points working very smoothly, and impressed everyone. Project page.

grid_vizards.png

Interpreting RGB displays for spec decomp

Team: Florian Smit (Technical University of Denmark), Gijs Straathof (SGS), Thomas Gazzola (Total), Julien Capgras (Total), Steve Purves (Euclidity), Tom Sandison (Shell)

Tech: Python, react.js. GitHub repos: Client. Backend.

Project: Spectral decomposition is still a mostly quantitative tool, especially the interpretation of RGB-blended displays. This team set out to make intuitive, attractive forward models of the spectral response of wells. This should help interpret seismic data, and perhaps make more useful RGB displays too. Intriguing and promising work. Project page.

RGB_log.png

That's it for another year! Twelve new geoscience visualization projects — ten of them open source. And another fun, creative weekend for 63 geoscientists — all of whom left with new connections and new skills. All this compressed into one weekend. If you haven't experienced a hackathon yet, I urge you to seek one out.

I will leave you with two videos — and an apology. We are so focused on creating a memorable experience for everyone in the room, that we tend to neglect the importance of capturing what's happening. Early hackathons only had the resulting blog post as the document of record, but lately we've been trying to livestream the demos at the end. Our success has been, er, mixed... but they were especially wonky this time because we didn't have livestream maestro Gram Ganssle there. So, these videos exist, and are part of the documentation of the event, but they barely begin to convey the awesomeness of the individuals, the teams, or their projects. Enjoy them, but next time — you should be there!

Visualization in Copenhagen, part 1

CPH_blog_banner.png

It's finally here! The round-up of projects from the Subsurface Hacakthon in Copenhagen last month. This is the first of two posts presenting the teams and their efforts, in the same random order the teams presented them at the end of the event.


Subsurface data meets Pokemon Go

Team Geo Go: Karine Schmidt, Max Gribner, Hans Sturm (all from Wintershall), Stine Lærke Andersen (University of Copenhagen), Ole Johan Hornenes (University of Bergen), Per Fjellheim (Emerson), Arne Kjetil Andersen (Emerson), Keith Armstrong (Dell EMC). 

Project: With Pokemon Go as inspiration, the team set out to prototype a geoscience visualization app that placed interactive subsurface data elements into a realistic 3D environment.

180610_agile_scientific_78.jpg

Visualizing blind spots in data

Team Blind Spots: Jo Bagguley (UK Oil & Gas Authority), Duncan Irving (Teradata), Laura Froelich (Teradata), Christian Hirsch (Aalborg University), Sean Walker (Campbell & Walker Geophysics).

Tech: Flask, Bokeh, AWS for hosting app. GitHub repo.

Project: Data management always comes up as an issue in conversations about geocomputing, but few are bold enough to tackle it head on. This team built components for checking the integrity of large amounts of raw data, before passing it to data science projects. Project page.

Sean, Laura, and Christian. Jo and Duncan were out doing research. Note the kanban board in the background — agile all the way!

Sean, Laura, and Christian. Jo and Duncan were out doing research. Note the kanban board in the background — agile all the way!


Volume uncertainties visualization

Team Fortuna: Natalia Shchukina (Total), Behrooz Bashokooh (Shell), Tobias Staal (University of Tasmania), Robert Leckenby (now Agile!), Graham Brew (Dynamic Graphics), Marco van Veen (RWTH Aachen). 

Tech: Flask, Bokeh, Altair, Holoviews. GitHub repo.

Project: Natalia brought some data with her: lots of surface grids. The team built a web app to compute uncertainty sections and maps, then display them dynamically and interactively — eliciting audible gasps from the room. Project page.

The Fortuna app: Probability of being the the zone (left) and entropy (right). Cross-sections are shown at the top, maps on the bottom.


Differences and similarities with RGB blends

Team RGBlend: Melanie Plainchault and Jonathan Gallon (Total), Per Olav Svendsen, Jørgen Kvalsvik and Max Schuberth (Equinor).

Tech: Python, Bokeh. GitHub repo.

Project: One of the more intriguing ideas of the hackathon was not just so much a fancy visualization technique, as a novel way of producing a visualization — differencing 3 images and visualizing the differences in RGB space. It reminded me of an old blog post about the spot the difference game. Project page.

The differences (lower right) between three time-lapse seismic amplitude maps.

The differences (lower right) between three time-lapse seismic amplitude maps.


Augmented reality geological maps

Team AR Sandbox: Simon Virgo (RWTH Aachen), Miguel de la Varga (RWTH Aachen), Fabian Antonio Stamm (RWTH Aachen), Alexander Schaaf (University of Aberdeen).

Tech: Gempy. GitHub repo.

Project: I don't have favourite projects, but if I did, this would be it. The GemPy group had already built their sandbox when they arrived, but they extended it during the hackathon. Wonderful stuff. Project page.

magic box of sand: Sculpting a landscape (left), and the projected map (right). You can't even imagine how much fun it was to play with.


Augmented reality seismic wavefields

Team Sandbox Seismics: Yuriy Ivanov (NTNU Trondheim), Ana Lim (NTNU Trondheim), Anton Kühl (University of Copenhagen), Jean Philippe Montel (Total).

Tech: GemPy, Devito. GitHub repo.

Project: This team worked closely with Team AR Sandbox, but took it in a different direction. They instead read the velocity from the surface of the sand, then used devito to simulate a seismic wavefield propagating across the model, and projected that wavefield onto the sand. See it in action in my recent Code Show post. Project page.

Yuriy Ivanov demoing the seismic wavefield moving across the sandbox.


Pretty cool, right? As usual, all of these projects were built during the hackathon weekend, almost exclusively by teams that formed spontaneously at the event itself (I think one team was self-contained from the start). If you didn't notice the affiliations of the participants — go back and check them out; I think this might have been an unprecedented level of collaboration!

Next time we'll look at the other six projects. [UPDATE: Next post is here.]

Before you go, check out this awesome video Wintershall made about the event. A massive thank you to them for supporting the event and for recording this beautiful footage — and for agreeing to share it under a CC-BY license. Amazing stuff!

Lots of news!

I can't believe it's been a month since my last post! But I've now recovered from the craziness of the spring — with its two hackathons, two conferences, two new experiments, as well as the usual courses and client projects — and am ready to start getting back to normal. My goal with this post is to tell you all the exciting stuff that's happened in the last few weeks.

Meet our newest team member

There's a new Agilist! Robert Leckenby is a British–Swiss geologist with technology tendencies. Rob has a PhD in Dynamic characterisation and fluid flow modelling of fractured reservoirs, and has worked in various geoscience roles in large and small oil & gas companies. We're stoked to have him in the team!

Rob lives near Geneva, Switzerland, and speaks French and several other human languages, as well as Python and JavaScript. He'll be helping us develop and teach our famous Geocomputing course, among other things. Reach him at robert@agilescientific.com.

Rob.png

Geocomputing Summer School

We have trained over 120 geoscientists in Python so far this year, but most of our training is in private classes. We wanted to fix that, and offer the Geocomputing class back for anyone to take. Well, anyone in the Houston area :) It's called Summer School, it's happening the week of 13 August, and it's a 5-day crash course in scientific Python and the rudiments of machine learning. It's designed to get you a long way up the learning curve. Read more and enroll. 


A new kind of event

We have several more events happening this year, including hackathons in Norway and in the UK. But the event in Anaheim, right before the SEG Annual Meeting, is going to be a bit different. Instead of the usual Geophysics Hackathon, we're going to try a sprint around open source projects in geophysics. The event is called the Open Geophysics Sprint, and you can find out more here on events.agilescientific.com.

That site — events.agilescientific.com — is our new events portal, and our attempt to stay on top of the community events we are running. Soon, you'll be able to sign up for events on there too (right now, most of them are still handled through Eventbrite), but for now it's at least a place to see everything that's going on. Thanks to Diego for putting it together!

Code Show version 1.0

Last week we released Code Show version 1.0. In a new experiment, we teamed up with Total and the European Association of Geoscientists and Engineers at the EAGE Annual Conference and Exhibition in Copenhagen. Our goal was to bring a little of the hackathon to as many conference delegates as possible. We succeeded in reaching a few hundred people over the three days, making a lot of new friends in the process. See the action in this Twitter Moment.

What was on the menu?

The augmented reality sandbox that Simon Virgo and his colleagues brought from the University of Aachen. The sandbox displayed both a geological map generated by the GemPy 3D implicit geological modeling tool, as well as a seismic wavefield animation generated by the Devito modeling and inversion project. Thanks to Yuriy Ivanov (NTNU) and others in his hackathon team for contributing the seismic modeling component.  

Demos from the Subsurface Hackathon. We were fortunate to have lots of hackathon participants make time for the Code Show. Graham Brew presented the uncertainty visualizer his team built; Jesper Dramsch and Lukas Mosser showed off their t-SNE experiments; Florian Smit and Steve Purves demoed their RGB explorations; and Paul Gabriel shared the GiGa Infosystems projects in AR and 3D web visualization. Many thanks to those folks and their teams.

AR and VR demos by the Total team. Dell EMC provided HTC Vive and Meta 2 kits, with Dell Precision workstations, for people to try. They were a lot of fun, provoking several cries of disbelief and causing at least one person to collapse in a heap on the floor.

Python demos by the Agile team. Dell EMC also kindly provided lots more Dell Precision workstations for general use. We hooked up some BBC micro:bit microcontrollers, Microsoft Azure IoT DevKits, and other bits and bobs, and showed anyone who would listen what you can do with a few lines of Python. Thank you to Carlos da Costa (University of Edinburgh) for helping out!

Tech demos by engineers from Intel and INT. Both companies are very active in visualization research and generously spent time showing visitors their technology. 

The code show in full swing. 

The code show in full swing. 

v 2.0 next year... maybe?

The booth experience was new to us. Quite a few people came to find us, so it was nice to have a base, rather than cruising around as we usually do. I'd been hoping to get more people set up with Python on their own machines, but this may be too in-depth for most people in a trade show setting. Most were happy to see some new things and maybe tap out some Python on a keyboard.

Overall, I'd call it a successful experiment. If we do it next year in London, we have a very good idea of how to shape an even more engaging experience. I think most visitors enjoyed themselves this year though; If you were one of them, we'd love to hear from you!

Big open data... or is it?

Huge news for data scientists and educators. Equinor, the company formerly known as Statoil, has taken a bold step into the open data arena. On Thursday last week, it 'disclosed' all of its subsurface and production data for the Volve oil field, located in the North Sea. 

What's in the data package?

A lot! The 40,000-file package contains 5TB of data, that's 5,000GB!

volve_data.png

This collection is substantially larger, both deeper and broader, than any other open subsurface dataset I know of. Most excitingly, Equinor has released a broad range of data types, from reports to reservoir models: 3D and 4D seismic, well logs and real-time drilling records, and everything in between. The only slight problem is that the seismic data are bundled in very large files at the moment; we've asked for them to be split up.

Questions about usage rights

Regular readers of this blog will know that I like open data. One of the cornerstones of open data is access, and there's no doubt that Equinor have done something incredible here. It would be preferable not to have to register at all, but free access to this dataset — which I'm guessing cost more than USD500 million to acquire — is an absolutely amazing gift to the subsurface community.

Another cornerstone is the right to use the data for any purpose. This involves the owner granting certain privileges, such as the right to redistribute the data (say, for a class exercise) or to share derived products (say, in a paper). I'm almost certain that Equinor intends the data to be used this way, but I can't find anything actually granting those rights. Unfortunately, if they aren't explicitly granted, the only safe assumption is that you cannot share or adapt the data.

For reference, here's the language in the CC-BY 4.0 licence:


Subject to the terms and conditions of this Public License, the Licensor hereby grants You a worldwide, royalty-free, non-sublicensable, non-exclusive, irrevocable license to exercise the Licensed Rights in the Licensed Material to:

  1. reproduce and Share the Licensed Material, in whole or in part; and
  2. produce, reproduce, and Share Adapted Material.
 

You can dig further into the requirements for open data in the Open Data Handbook.

The last thing we need is yet another industry dataset with unclear terms, so I hope Equinor attaches a clear licence to this dataset soon. Or, better still, just uses a well-known licence such as CC-BY (this is what I'd recommend). This will clear up the matter and we can get on with making the most of this amazing resource.

More about Volve

The Volve field was discovered in 1993, but not developed until 15 years later. It produced oil and gas for 8.5 years, starting on 12 February 2008 and ending on 17 September 2016, though about half of that came in the first 2 years (see below). The facility was the Maersk Inspirer jack-up rig, standing in 80 m of water, with an oil storage vessel in attendance. Gas was piped to Sleipner A. In all, the field produced 10 million Sm³ (63 million barrels) of oil, so is small by most standards, with a peak rate of 56,000 barrels per day.

Volve production over time in standard m³ (i.e. at 20°C). Multiply by 6.29 for barrels.

Volve production over time in standard m³ (i.e. at 20°C). Multiply by 6.29 for barrels.

The production was from the Jurassic Hugin Formation, a shallow-marine sandstone with good reservoir properties, at a depth of about 3000 m. The top reservoir depth map from the discovery report in the data package is shown here. (I joined Statoil in 1997, not long after this report was written, and the sight of this page brings back a lot of memories.)


The top reservoir depth map from the discovery report. The Volve field (my label) is the small closure directly north of Sleipner East, with 15/9-19 well on it.


Get the data

To explore the dataset, you must register in the 'data village', which Equinor has committed to maintaining for 2 years. It only takes a moment. You can get to it through this link.

Let us know in the comments what you think of this move, and do share what you get up to with the data!

Visualize this!

The Copenhagen edition of the Subsurface Hackathon is over! For three days during the warmest June in Denmark for over 100 years, 63 geoscientists and programmers cooked up hot code in the Rainmaking Loft, one of the coolest, and warmest, coworking spaces you've ever seen. As always, every one of the participants brought their A game, and the weekend flew by in a blur of creativity, coffee, and collaboration. And croissants.

Pierre enjoying the Meta AR headset that DEll EMC provided.

Pierre enjoying the Meta AR headset that DEll EMC provided.

Our sponsors have always been unusually helpful and inspiring, pushing us to get more audacious, but this year they were exceptionally engaged and proactive. Dell EMC, in the form of David and Keith, provided some fantastic tech for the teams to explore; Total supported Agile throughout the organization phase, and Wintershall kindly arranged for the event to be captured on film — something I hope to be able to share soon. See below for the full credit roll!

sponsors.png

During th event, twelve teams dug into the theme of visualization and interaction. As in Houston last September, we started the event on Friday evening, after the Bootcamp (a full day of informal training). We have a bit of process to form the teams, and it usually takes a couple of hours. But with plenty of pizza and beer for fuel, the evening flew by. After that, it was two whole days of coding, followed by demos from all of the teams and a few prizes. Check out some of the pictures:

Thank you very much to everyone that helped make this event happen! Truly a cast of thousands:

  • David Holmes of Dell EMC for unparallelled awesomeness.
  • The whole Total team, but especially Frederic Broust, Sophie Segura, Yannick Pion, and Laurent Baduel...
  • ...and also Arnaud Rodde for helping with the judging.
  • The Wintershall team, especially Andreas Beha, who also acted as a judge.
  • Brendon Hall of Enthought for sponsoring the event.
  • Carlos Castro and Kim Saabye Pedersen of Amazon AWS.
  • Mathias Hummel and Mahendra Roopa of NVIDIA.
  • Eirik Larsen of Earth Science Analytics for sponsoring the event and helping with the judging.
  • Duncan Irving of Teradata for sponsoring, and sorting out the T-shirts.
  • Monica Beech of Ikon Science for participating in the judging.
  • Matthias Hartung of Target for acting as a judge again.
  • Oliver Ranneries, plus Nina and Eva of Rainmaking Loft.
  • Christopher Backholm for taking such great photographs.

Finally, some statistics from the event:

  • 63 participants, including 8 women (still way too few, but 100% better than 4 out of 63 in Paris)
  • 15 students plus a handful of post-docs.
  • 19 people from petroleum companies.
  • 20 people from service and technology companies, including 7 from GiGa-infosystems!
  • 1 no-show, which I think is a new record.

I will write a summary of all the projects in a couple of weeks when I've caught my breath. In the meantime, you can read a bit about them on our new events portal. We'll be steadily improving this new tool over the coming weeks and months.

That's it for another year... except we'll be back in Europe before the end of the year. There's the FORCE Hackathon in Stavanger in September, then in November we'll be in Aberdeen and London running some events with the Oil and Gas Authority. If you want some machine learning fun, or are looking for a new challenge, please come along!

Simon Virgo (centre) and his colleagues in Aachen built an augmented reality sandbox, powered by their research group's software, Gempy. He brought it along and three teams attempted projects based on the technology. Above, some of the participants …

Simon Virgo (centre) and his colleagues in Aachen built an augmented reality sandbox, powered by their research group's software, Gempy. He brought it along and three teams attempted projects based on the technology. Above, some of the participants are having a scrum meeting to keep their project on track.


Looking forward to Copenhagen

We're in Copenhagen for the Subsurface Bootcamp and Hackathon, which start today, and the EAGE Annual Conference and Exhibition, which starts next week. Walking around the city yesterday, basking in warm sunshine and surrounded by sun-giddy Scandinavians, it became clear that Copenhagen is a pretty special place, where northern Europe and southern Europe seem to have equal influence.

The event this weekend promises to be the biggest hackathon yet. It's our 10th, so I think we have the format figured out. But it's only the third in Europe, the theme — Visualization and interaction — is new for us, and most of the participants are new to hackathons so there's still the thrill of the unknown! 

Many thanks to our sponsors for helping to make this latest event happen! Support these organizations: they know how to accelerate innovation in our industry.

sponsors.png

New events for UK

By the way, we just announced two new hackathons, one in London and one in Aberdeen, for the autumn. They are happening just before PETEX, the PESGB petroleum conference; find out more here. You can skill up for these events at some new courses, also just announced. The UK Oil and Gas Authority is offering our Intro to Geocomputing and Machine Learning class for free — apply here for a place. The courses are oversubscribed, so be sure to tell the OGA why you should get a place!

Code Show

There is a lot of other stuff happening at the EAGE exhibition this year — the HPC area, a new start-up area, and a digital transformation area which I hope is as bold as it sounds. Here's the complete schedule and some highlights:

There's lots of other stuff of course — EAGE has the most varied programme of any subsurface conference — but these are the sessions I'd be at if I had time to go to any sessions this year. But I won't because The hackathon is not all that's happening! Next week, starting on Tuesday, we're conducting a new experiment with the Code Show. In partnership with EAGE and Total, this is our attempt to bring some of the hackathon experience to everyone at EAGE. We'll be showing people the projects from the hackathon, talking to them about programming, and helping them get started on their own coding adventure. So if you're at EAGE, swing by Booth #1830 and say Hi.