Great geophysicists #10: Joseph Fourier
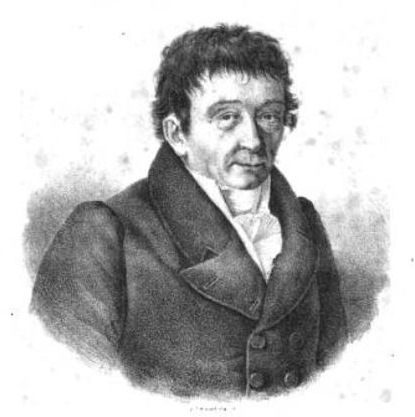
Joseph Fourier, the great mathematician, was born on 21 March 1768 in Auxerre, France, and died in Paris on 16 May 1830, aged 62. He's the reason I didn't get to study geophysics as an undergraduate: Fourier analysis was the first thing that I ever struggled with in mathematics.

Fourier was one of 12 children of a tailor, and had lost both parents by the age of 9. After studying under Lagrange at the École Normale Supérieure, Fourier taught at the École Polytechnique. At the age of 30, he was an invited scientist on Napoleon's Egyptian campaign, along with 55,000 other men, mostly soldiers:

Citizen, the executive directory having in the present circumstances a particular need of your talents and of your zeal has just disposed of you for the sake of public service. You should prepare yourself and be ready to depart at the first order.
Herivel, J (1975). Joseph Fourier: The Man and the Physicist, Oxford Univ. Press.

He stayed in Egypt for two years, helping found the modern era of Egyptology. He must have liked the weather because his next major work, and the one that made him famous, was Théorie analytique de la chaleur (1822), on the physics of heat. The topic was incidental though, because it was really his analytical methods that changed the world. His approach of decomposing arbitrary functions into trignometric series was novel and profoundly useful, and not just for solving the heat equation

Fourier as a geophysicist

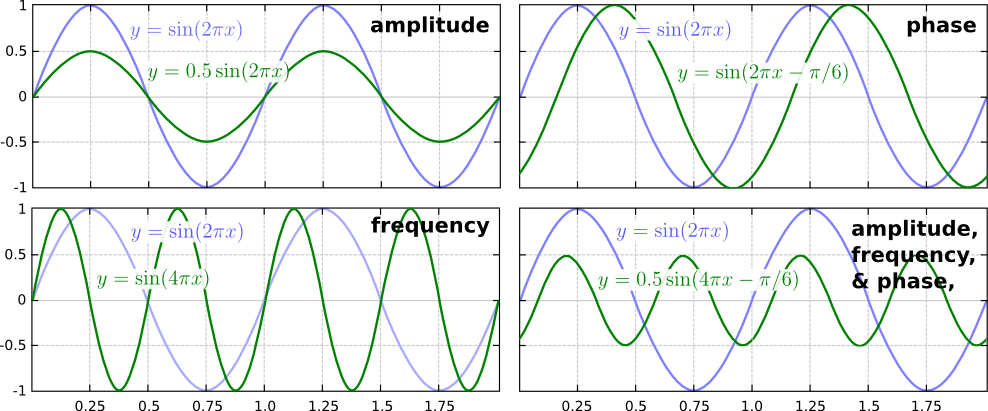
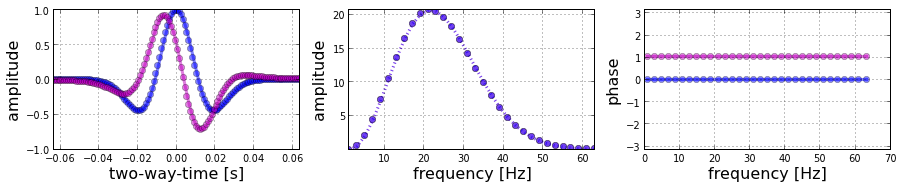
Late last year, Evan wrote about the reason Fourier's work is so important in geophysical signal processing in Hooray for Fourier! He showed how we can decompose time-based signals like seismic traces into their frequency components. And I touched the topic in K is for Wavenumber (decomposing space) and The spectrum of the spectrum (decomposing frequency itself, which is even weirder than it sounds). But this GIF (below) is almost all you need to see both the simplicity and the utility of the Fourier transform. 

In this example, we start with something approaching a square wave (red), and let's assume it's in the time domain. This wave can be approximated by summing the series of sine waves shown in blue. The amplitudes of the sine waves required are the Fourier 'coefficients'. Notice that we needed lots of time samples to represent this signal smoothly, but require only 6 Fourier coefficients to carry the same information. Mathematicians call this a 'sparse' representation. Sparsity is a handy property because we can do clever things with sparse signals. For example, we can compress them (the basis of the JPEG scheme), or interpolate them (as in CGG's REVIVE processing). Hooray for Fourier indeed.

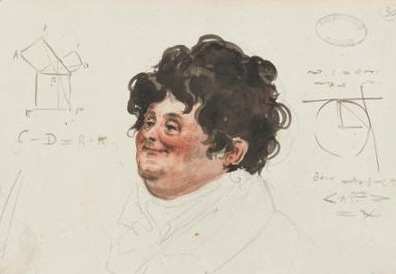
The watercolour caricature of Fourier is by Julien-Leopold Boilly from his work Album de 73 Portraits-Charge Aquarelle’s des Membres de I’Institute (1820); it is in the public domain.

Read more about Fourier on his Wikipedia page — and listen to this excellent mini-biography by Marcus de Sautoy. And check out Mostafa Naghizadeh's chapter in 52 Things You Should Know About Geophysics. Download the chapter for free!

What is brittleness?

Brittleness is an important rock characteristic, but impossible to define formally because there are so many different ways of looking at it. For this reason, Tiryaki (2006) suggests we call it a rock behaviour, not a rock property.

Indeed, we're not really interested in brittleness, per se, because it's not very practical information on its own. Mining engineers are concerned with a property called cuttability — and we can think of this as conceptually analogous to the property that interests lots of geologsts, geophysicists, and engineers in petroleum, geothermal, and hydrology: frackability. In materials science, the inverse property — the ability of a rock to resist fracture — is called fracture toughness. 

What is brittleness not?

  • It's not the same as frackability, or other things you might be interested in.
  • It's not a simple rock property like, say, density or velocity. Those properties are condition-dependent too, but we agree on how to measure them.
  • It's not proportional to any elastic moduli, or a linear combination of Young's modulus and Poisson's ratio, despite what you might have heard.

So what is it then?

It depends a bit what you care about. How the rock deforms under stress? How much energy it takes to break it? What happens when it breaks? Hucka and Das (1974) rounded up lots of ways of looking at it. Here are a few:

  • Brittle rocks undergo little to no permanent deformation before failure and, depending on the test conditions, may occur suddenly and catastrophically.
  • Brittle rocks undergo little or no ductile deformation past the yield point (or elastic limit) of the rock. Note that some materials, including many rocks, have no well-defined yield point because they have non-linear elasticity.
  • Brittle rocks absorb relatively little energy before fracturing. The energy absorbed is equal to the area under the stress-strain curve (see figure).
  • Brittle rocks have a strong tendency to fracture under stress.
  • Brittle rocks break with a high ratio of fine to coarse fragments.

All of this is only made more complicated by the fact that there are lots of kinds of stress: compression, tension, shear, torsion, bending, and impact... and all of these can operate in multiple dimensions, and on multiple time scales. Suddenly a uniaxial rig doesn't quite seem like enough kit.

It will take a few posts to really get at brittleness and frackability. In future posts we'll look at relevant rock properties and how to measure them, the difference between static and dynamic measurements, and the multitude of brittleness indices. Eventually, we'll get on to what all this means for seismic waves, and ask whether frackability is something we can reasonably estimate from seismic data.

Meanwhile, if you have observations or questions to share, hit us in the comments. 

References and further reading
Hucka V, B Das (1974). Brittleness determination of rocks by different methods. Int J Rock Mech Min Sci Geomech Abstr 10 (11), 389–92. DOI:10.1016/0148-9062(74)91109-7

Tiryaki (2006). Evaluation of the indirect measures of rock brittleness and fracture toughness in rock cutting. The Journal of The South African Institute of Mining and Metallurgy 106, June 2006. Available online.

P is for Phase

Seismic is about acoustic vibration. The archetypal oscillation, the sine wave, describes the displacement y of a point around a circle. You only need three pieces of information to describe it perfectly: the size of the circle, the speed at which it rotates around the circle, and where it starts from expressed as an angle. These quantities are better known as the amplitude, frequency, and phase respectively. These figures show how varying each of them affects the waveform:

So phase describes the starting point as an angle, but notice that this manifests itself as an apparent lateral shift in the waveform. For seismic data, this means a time shift. More on this later. 

What about seismic?

We know seismic signals are not so simple — they are not repetitive oscillations — so why do the words amplitudefrequency and phase show up so often? Aren't these words horribly inadequate?

Not exactly. Fourier's methods allow us to construct (and deconstruct) more complicated signals by adding up a series of sine waves, as long as we get the amplitude, frequency and phase values right for each one of them. The tricky part, and where much of where the confusion lies, is that even though you can place your finger on any point along a seismic trace and read off a value for amplitude, you can't do that for frequency or phase. The information for those are only unlocked through spectroscopy.

Phase shifts or time shifts?

The Ricker wavelet is popular because it can easily be written analytically, and it is comprised of a considerable number of sinusoids of varying amplitudes and frequencies. We might refer to a '20 Hz Ricker wavelet' but really it contains a range of frequencies. The blue curve shows the wavelet with phase = 0°, the purple curve shows the wavelet with a phase shift of π/3 = 60° (across all frequencies). Notice how the frequency content remains unchanged.

So for a seismic reflection event (below), phase takes on a new meaning. It expresses a time offset between the reflection and the maximum value on the waveform. When the amplitude maximum is centered at the reflecting point, it is equally shaped on either side — we call this zero phase. Notice how variations in the phase of the event alter the relative position of the peak and sidelobes. The maximum amplitude of the event at 90° is only about 80% of the amplitude at zero phase. This is why I like to plot traces along with their envelope (the grey lines). The envelope contains all possible phase rotations. Any event whose maximum value does not align with the maximum on the envelope is not zero phase.

Understanding the role of phase in time series analysis is crucial for both data processors aiming to create reliable data, and interpreters who operate under the assertion that subtle variations in waveform shape can be attributed to underlying geology. Waveform classification is a powerful attribute... but how reliable is it?

In a future post, I will cover the concept of instantaneous phase on maps and sections, and some other practical interpretation tips. If you have any of your own, share them in the comments.

Additional reading
Liner, C (2002). Phase, phase, phase. The Leading Edge 21, p 456–7. Abstract online.

Great geophysicists #9: Ernst Chladni

Ernst Chladni was born in Wittenberg, eastern Germany, on 30 November 1756, and died 3 April 1827, at the age of 70, in the Prussian city of Breslau (now Wrocław, Poland). Several of his ancestors were learned theologians, but his father was a lawyer and his mother and stepmother from lawyerly families. So young Ernst did well to break away into a sound profession, ho ho, making substantial advances in acoustic physics. 

Chladni, 'the father of acoustics', conducted a large number of experiments with sound, measuring the speed of sound in various solids, and — more adventurously — in several gases too, including oxygen, nitrogen, and carbon dioxode. Interestingly, though I can find only one reference to it, he found that the speed of sound in Pinus sylvestris was 25% faster along the grain, compared to across it — is this the first observation of acoustic anisotropy? 

The experiments Chladni is known for, however, are the plates. He effectively extended the 1D explorations of Euler and Bernoulli in rods, and d'Alembert in strings, to the 2D realm. You won't find a better introduction to Chladni patterns than this wonderful blog post by Greg Gbur. Do read it — he segués nicely into quantum mechanics and optics, firmly linking Chladni with the modern era. To see the patterns forming for yourself, here's a terrific demonstration (very loud!)...

The drawings from Chladni's book Die Akustik are almost as mesmerizing as the video. Indeed, Chladni toured most of mainland Europe, demonstrating the figures live to curious Enlightenment audiences. When I look at them, I can't help wondering if there is some application for exploration geophysics — perhaps we are missing something important in the wavefield when we sample with regular acquisition grids?

References

Chladni, E, Die Akustik, Breitkopf und Härtel, Leipzig, 1830. Amazingly, this publishing company still exists.

Read more about Chladni in Wikipedia and in monoskop.org — an amazing repository of information on the arts and sciences. 

This post is part of a not-very-regular series of posts on important contributors to geophysics. It's going rather slowly — we're still in the eighteenth century. See all of them, and do make suggestions if we're missing some!

Grand challenges, anisotropy, and diffractions

Some more highlights from the two final days of the SEG Annual Meeting in Houston.

Grand challenges

On Friday, I reported on Chevron's take on the unsolved problems in petroleum geoscience. It was largely about technology. Ken Tubman, VP of Geoscience and Reservoir Engineering at ConocoPhillips gave an equally compelling outlook on some different issue. He had five points:

  • Protect the base — Fighting the decline of current production is more challenging than growing production.
  • Deepwater — Recent advances in drilling are providing access to larger fields in deep water, and compressed sampling in seismic will make exploration more efficient.
  • Unconventionals — In regard to the shale gas frenzy, it is not yet obvious why these reservoirs produce the way that they do. Also, since resource plays are so massive, a big challenge will be shooting larger surveys on land.
  • Environment and safety — Containment assurance is more critical than pay-zone management, and geophysics will find an expanding role in preventing and diagnosing environmental and safety issues.
  • People — Corporations are concerned about maintaining world class people. Which will only become more difficult as the demographic bump of senior knowledge heads off into retirement.

The Calgary crowd that harvested the list of unsolved problems at our unsession in May touched on many of these points, and identified many others that went unmentioned in this session.

Driving anisotropic ideas

In the past, seismic imaging and wave propagation were almost exclusively driven by isotropic ideas. In the final talk of the technical program, Leon Thomsen asserted that the industry has been doing AVO wrong for 30 years, and doing geomechanics wrong for 5 years. Three take-aways:

  • Isotropy is no longer an acceptable approximation. It is conceptually flawed to relate Young's modulus (an elastic property), to brittleness (a mode of failure). 
  • Abolish the terms vertically transverse isotropy (VTI), and horizontally transverse isotropy (HTI) from our vocabulary; how confusing to have types of anisotropy with isotropy in the name! Use polar anisotropy (for VTI), and azimuthal anisotropy (for HTI) instead.
  • λ13 is a simple expression of P-wave modulus M, and Thomsen's polar anisotropy parameter δ, so it should be attainable with logs.

Bill Goodway, whose work with elasticity has been criticized by Thomsen, walked to the microphone and pointed out to both the speaker and audience, that the tractability of λ13 is what he has been saying all along. Colin Sayers then stood up to reiterate that geomechanics is the statistics of extremes. Anisotropic rock physics is uncontestable, but the challenge remains to find correlations with things we actually measure.

Thomas Young's sketch of 2-slit diffraction, which he showed to the Royal Society in 1803.

Imaging fractures using diffractions

Diffractions are fascinating physical phenomena that occur when the conditions of wave propagation change dramatically. They are a sort of grey zone between reflection and scattering, and can be used to resolve fractures in the subsufrace. The question is whether or not there is enough diffraction energy to detect the fractures; it can be 10× smaller than a specular reflection, so one needs very good data acquisition. Problem is, we must subtract reflections — which we deliberately optimized for — from the wavefield to get diffractions. Evgeny Landa, from Opera Geophysical, was terse, 'we must first study noise, in this case the noise is the reflections... We must study the enemy before we kill it.'

Prospecting with plate tectonics

The Santos, Campos, and Espirito Basins off the coast of Brazil contain prolific oil discoveries and, through the application of plate tectonics, explorers have been able to extend the play concepts to offshore western Africa. John Dribus, Geological Advisor at Schlumberger, described a number of discoveries as 'kissing cousins' on either side of the Atlantic, using fundamental concepts of continental margin systems and plate tectonics (read more here). He spoke passionately about big ideas, and acknowledged collaboration as a necessity: 'if we don't share our knowledge we re-invent the wheel, and we can't do that any longer'.

In the discussion session afterwards, I asked him to comment on offshore successes, which has historically hovered around 14–18%. He noted that a step change — up to about 35% — in success occured in 2009, and he gave 3 causes for it: 

  • Seismic imaging around 2005 started dealing with anisotropy appropriately, getting the images right.
  • Improved understanding of maturation and petroleum system elements that we didn’t have before.
  • Access to places we didn’t have access to before.

Although the workshop format isn't all that different from the relentless PowerPoint of the technical talks, it did have an entirely different feeling. Was it the ample discussion time, or the fact that the trade show, now packed neatly in plywood boxes, boosted the signal:noise? Did you see anything remarkable at a workshop last week? 

Key technology trends in earth science

Yesterday, I went to the workshop entitled, Grand challenges and research opportunities in geophysics, organized by Cengiz Esmersoy, Wafik Beydoun, Colin Sayers, and Yoram Shoham. I was curious if there'd be overlap with the Unsolved Problems Unsession we hosted in Calgary, and had reservations about it being an overly fluffy talkshop, but it was much better than I expected.

Ken Tubman, VP of Geosciences and Reservoir Engineering at ConocoPhillips, gave a splendid talk to open the session. But it was the third talk of the session, from Mark Koelmel, General Manager of Earth Sciences at Chevron, that resonated most with me. He highlighted 5 trends in applied earth science.

Data and information management

Data volumes are expanding with Moore's law. Chevron has more than 15 petabytes of data, by 2020 they will have more than 100PB. Koelmel postulated that spatial metadata and tagging will become pervasive and our data formats will have to evolve accordingly. Instead of managing ridiculously large amounts of data, a better solution may be to 'tag it and chuck it in the closet' — Google's approach to the web (and we know the company has been exploring the use of Hadoop). Beyond hardware, he stressed that new industry standards are needed now. The status quo is holding us back.

Full azimuth seismic data

Only recently have we been able to wield the computing power to deal with the kind of processes needed for full-waveform inversion. It's not only because of data volumes that new processing facilities will not be cheap — or small. He predicted processing centres that resemble small cities in terms of their power consumption. An interesting notion of energy for energy, and the reason for recent massive growth in Google's power production capability. (Renewables for power, oil for cooling... how funny would that be?)

Interpretive seismic processing and imaging

Interpretation, and processing are actually the same thing. The segmentation of seismic technology will have to be stitched back together. Imagine the interpreter working on field data, with a mixing board to produce just the right image for today's work. How will service companies (who acquire data and make images), and operators (who interpret data and make prospects) merge their efforts? We may have to consider different business relationships.

Full-cycle interpretation systems

The current state of integration is sequential at best, each node in a workflow produces static inputs for the next step, with minimal iteration in between. Each component of the sequence typically ends with 'throwing things over the wall' to the next node. With this process, the uncertainties are cumulative throughout, which is unnerving because we don't often know what the uncertainties are. Koelmel's desired future state is one of seamless geophysical processing, static model-building, and dynamic reservoir simulation. It won't reduce uncertainties altogether, but by design it will make them easier to identify and addressed.

Intellectual property

The number of patents filed in this industry has more than tripled in the last decade. I assumed Koelmel was going to give a Big Oil lecture on secrecy and patents, touting them as a competitive advantage. He said just the opposite. He asserted that industries with excessive patenting (think technology, and Big Pharma) make innovation difficult. Chevron is no stranger to the patent processes, filing 125 patents both in 2012 and in 2011, but this is peanuts compared to Schlumberger (462 in 2012) and IBM (6457 in 2012). 

The challenges geophysicists are facing are not our own. They stem from the biggest problems in the industry, which are of incredible importance to mankind. Perhaps expanding the value proposition to such heights is more essential than ever. Geophysics matters.

The future is uncertain

Image: Repsol, SEG. Click for the abstract.

SEG Day 2. In the session entitled Exploration and Uncertainty Analysis, I was underwhelmed with the few talks that I attended, except for the last one of the session entitled, Measuring time-map uncertainty

Static uncertainty

It is commonly uttered that different data processing companies will produce different results; seismic processing is non-unique, and so on. But rarely do I get to see real examples of the kind of variances that can occur. Bruce Blake from Repsol showed seismic imaging results that came back from a number of contractors. The results were truly shocking. The example he showed was an extreme case of uncertainty caused by inadequate static solutions caused by the large sand dunes in Libya. The key point for me is exemplified by the figure shown on the right: the image from one vendor suggests a syncline, the image from the other suggest an anticline. Beware!

A hole in the theory

In the borehole sonic session, Xinding Fang, a student from MIT, reinforced a subtle but profound idea: it is tricky to measure the speed of sound in a rock when you drill a hole into it. The hole changes the stress field, and induces an anisotropic stiffness around the circumference of the borehole where sonic tools make their measurements. And since waves take the shortest travel path from source to receiver, speeds that are measured in the presence of an artificial stress are wrong.

Image: Xindang Fang, SEG. Click for the abstract.

The bigger issue here that Xinding has elucidated is that we routinely use sonic logs to make time-depth relationships and tie wells, especially in the absence of a check-shot survey. If it works, it works, but if ever discrepancies exists between seismic and well, the interpreter applies a stretch or a squeeze without much thought. Some may blame the discrepancy on dispersion alone, but that's evidently too narrow. Indeed, we rarely bother to investigate the reasons.

There's a profound point here. We have to drop the assumption that logs are the 'geological' truth upon which to hang an interpretation. We have to realize that the act of making the measurement changes the very thing we want to measure. 

Past, present, future SEG

Today was the first day of the SEG Annual Meeting in Houston. 

Last night we wandered around the icebreaker, still buzzing from the hackathon. The contrast was crushing. The exhibition is gigantic — it's an almost overwhelming amount of marketing. My thoughts on what the exhibition hall is, and what it represents, are not fully formed and might be a bit... ranty, so I will save them for a more considered post. 

As usual, SEG kicked off with a general session — much better attended this year, but also much less ambitious. At least 300 members came to hear outgoing president David Monk's perspective on SEG's future. His address mostly looked backwards, however, at the trends over the last few years. I guess the idea is to extrapolate from there... But maybe we can do even better than recent years? We mustn't forget to do completely new and unexpected things too. 

At the end of his slot, Monk showed some animated renderings of SEG's new building in Tulsa. The movie was accompanied by an almost comically strident anthem — evidently it is a big deal. As well as having a smart new office, the real estate will turn in some smart new revenue from other tenants. Ground was broken on Friday, and the opening is expected to be in December 2014. As you see, the architects understood industrial geophysics quite well, opting for a large black box

At the end of the day, Canada strode home to yet another SEG Challenge Bowl victory as the University of Manitoba fought off the Autonomous University of Mexico and Colorado School of Mines to prove that, while Texas might be the home of the industry, Canada is the home of exploration geophysics. 

Where's all the geophysics? Evan is compiling some technical highlights from the day as I type. Stay tuned for that. 

If you're at the conference, tell us what you've enjoyed most about the first 24 hours.

Looking forward to SEG 2013

The SEG Annual Meeting is coming! The program starts tomorrow with the DISC, and continues over the weekend with various other courses. It's not part of the conference, but we're looking forward to the Geophysics Hackathon, obviously. Curious? You're welcome to drop in.

The meeting boasts 124 technical sessions totalling over 1000 PowerPoint presentations. If you haven't looked at the list of expanded abstracts yet, I can't blame you, it's a massive amount of content and the website experience is, er, not optimal — and there's no helpful mobile app this year. [Update: The app came out today! Go get it, it's essential. Thank you Whitney at SEG for letting us know.] I've tried to pick out a few sessions that seem really exciting below.

Worst. App. Ever.Each day at 10:30 am, I will be doing a guest presentation at the Enthought booth, showing some novel geophysics tools that I've been making. They are powered by Python and Enthought's Canopy environment. Come by and I will show you that you can too! However, I need somebody to please go to this exhibition booth 'browser' and show me where the Enthought booth is. Worst. App. Ever.

And each day at 11 am, there's a 2-hour mini-wikithon. Stop by the Press Room for a quick tour of SEG Wiki, and find out how you can help make it better.

Monday

With no technical presentations on Monday morning, it is safe to assume that most delegates will be wandering around the exhibition hall. A few may trickle over to the unenticing Opening Session which Matt and I found was horribly attended last year and the year before. Matt at least will be there, mostly out of morbid curiosity.

Continuing the Hackathon's theme on error and uncertainty, I will be diving into the session on Monday afternoon called

From 3-6 pm be sure to check out the always popular SEG Student Challenge Bowl. The global finals, are hosted by the crowd-pleasing past SEG president (and fellow Canadian) Peter Duncan. Top pairings from Universities across the world duking it out in a button-pushing quiz show. Come out, cheer on the students and test your own geophysics trivia from the audience.

Tuesday

The sessions that look appealing to me on Tuesday are

Wednesday

Agile's good friend Maitri Erwin is the instigator behind the Women's Networking Breakfast. All are welcome; consider yourself lucky to connect with Maitri. As for talks, I will try make an appearance at

The first one I know quite a bit about, but can always use a refresher, and the second one I know very little about, but it's been a hot topic for 3 or 4 years now. If we aren't worn out at the end of the day, we might find some tickets to the Bayou Bash.

Thursday & Friday

There are over a dozen workshops on both Thursday and Friday. As far as I can tell, they are basically more talks, each around a central theme. Don't ask me how this is in any way distinguishable from the technical program, and there is still a full suite of technical sessions conflicting on Thursday morning. It's a shame because I'm curious to attend the session Fractures, shale and well-log characterization but I don't want to miss Workshop 2, Grand challenges, which takes place all day on Thursday. Then on Friday there's Characterizing fractures (Workshop 15).

There are many other events going on, so if you see something good, make sure you tweet the rest of us about it: @EvanBianco, @kwinkunks, @maitri, @toastar, and lots of others — follow hashtag #SEG13. (Not #SEG2013, that's all marketing wonks).

If you'll be at the Annual Meeting, do look out for us, we'd love to meet you. If you won't be there, tell us what you'd like to hear about. News from the exhibition? Our favourite talks? Detailed minutes from the committee meetings? Let us know in the comments.

Wiki world of geoscience

This weekend, I noticed that there was no Wikipedia article about Harry Wheeler, one of the founders of theoretical stratigraphy. So I started one. This brings the number of biographies I've started to 3:

  • Karl Zoeppritz — described waves almost perfectly, but died at the age of 26
  • Johannes Walther — started as a biologist, but later preferred rocks
  • Harry Wheeler — if anyone has a Wheeler diagram to share, please add it!

Many biographies of notable geoscientists are still missing (there are hundreds, but here are three): 

  • Larry Sloss — another pioneer of modern stratigraphy
  • Oz Yilmaz — prolific seismic theoretician and practioner
  • Brian Russell — entrepreneur and champion of seismic analysis

It's funny, Wikipedia always seems so good — it has deep and wide content on everything imaginable. I think I must visit it 20 or 30 times a day. But when you look closely, especially at a subject you know a bit about, there are lots of gaps (I wonder if this is one of the reasons people sometimes deride it?). There is a notability requirement for biographies, but for some reason this doesn't seem to apply to athletes or celebrities. 

I was surprised the Wheeler page didn't exist, but once you start reading, there are lots of surprises:

I run a geoscience wiki, but this is intended for highly esoteric topics that probably don't really belong in Wikipedia, e.g. setting parameters for seismic autopickers, or critical reviews of subsurface software (both on my wish list). I am currently working on a wiki for AAPG — is that the place for 'deep' petroleum geoscience? I also spend time on SEG Wiki... With all these wikis, I worry that we risk spreading ourselves too thinly? What do you think?

In the meantime, can you give 10 minutes to improve a geoscience article in Wikipedia? Or perhaps you have a classful of students to unleash on an assignment?

Tomorrow, I'll tell you about an easy way to help improve some geophysics content.