To free, or not to free?

Yesterday, Evan and I published our fourth mobile app for geoscientists. It's called AVO*, it does reflectivity modeling, and it costs $2. 

Two bucks?? What's the point? Why isn't it free? Well, it went something like this...

- So, this new app: is it free?
- Well, all our apps are free. I guess it's free.
- Yeah, we don't want to stop it from spreading. If it wants to spread, that is...
- But does free look... worthless? I mean, 'you get what you pay for', right? Look at all the awesome stuff we pay for: Amazon web services, Squarespace web hosting, Hover domain hosting, awesome computers,...
- So what would we charge?
- What do other people charge? 
- There are no 'other people'... But there are technical apps for oil and gas out there. Most of them cost $1.99, some are $4.99, one or two are $9.99. Who knows how many downloads they get? 
- I bet the total revenue is constant: if you charge $1 and get 1000 downloads, then you'll get 100 at $10. But that's an experiment you can never do—once you've charged some amount, you can't really go up. Or down.
- How do other people decide what to charge?
- I guess traditionally you might use a cost-plus model: the cost of production, plus a profit margin.
- What's our cost of production?
- Well, a few days of time... let's call it $5000. If we wanted to make $10 000, and only expect 500 people to even be in the market... It doesn't work. No-one will pay $20 for a cell phone widget.
- Won't they just expense it?
- Maybe... I don't think the industry is quite there yet.
- Hmm... I downloaded an app for $20 once [a seismograph]. And another for $10 [a banjo tuner]. I don't even think about paying $1 or $2. That amount is basically free. $1 is free.
- But a buck... isn't it just a pain to even get your credit card out?
- Well, once you're set up in Google Checkout, or iTunes or whatever, it's essentially one click. And then we get a sense of the real user base. The hard core!
- Yeah... right now about 50% of people who install an app nuke it a few days later.
- At least if it's under $5 we probably won't have to deal with refunds and other nonsense.
- Arrgghhhh... why is this so hard? 
- Let's make it $2. 
- Let's make it free.
- But this app is awesome. Awesome shouldn't be free. Awesome is never free. Awesome costs. 
- But isn't this really just a thing that says "Agile is awesome, check us out, hire us"? It's marketing.
- Maybe... but it's useful too. It works. It does something. It has Science Inside™. People will get $1-worth out of it every time they use it. If this was a <insert energy software empire> app it would cost $10 000.
- Can we ask people to pay what they want? Like what Radiohead did with In Rainbows?
- No because they're already huge. They invoke mass hysteria in grown men. We don't invoke mass hysteria. Among anyboy.
- Damn. OK. Let's make it nearly free. As-good-as-free. Free-ish. Pseudo-free. Free*.
- $2?
- $2.

So the app costs a toonie, and we promise you won't regret it for a second. If you can't afford it, email us and we'll send you a free one. If you really hate it, email us and we'll send you $3.

More geophysics apps

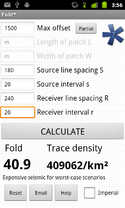
Please welcome our latest app, Fold*, into the world. It is now available for free in the Android Market. This one is aimed at geophysicists planning land 3D seismic surveys. You provide some basic data about the geometry, and the tool computes fold in natural bins, and trace density per unit area. It also provides a qualitative description of what such a geometry might be good for (simple structure only, say, or high S:N or reflectivity areas). Read all about it in the wiki.

We have also put together a new page on this website, gathering news & info all our geoscience apps in one place. You will find it in the title bar above. Please share it with anyone you see using an Android™ phone or tablet!

 If you have a wish for an app, leave a comment or drop us a line!

Geophysics apps FTW

Google Nexus SI have used an Apple iPhone for several years. It's probably the loveliest technology I've ever owned. But now it's gone, it's over between us, and it will never come back. Because now I've found Android

Last Wednesday I got a Google Nexus S, chosen for its relative purity: built by Samsung, it's a Google-branded phone, so it has less of the carrier's fingerprints on it, and it gets OS updates faster. But it's not the phone I love—it doesn't have the industrial beauty of the iPhone®. It's not even Google's Android™ operating system that I'm besotted with—though it is pretty fantastic. The thing I love is App Inventor. 

If you've never tried programming a computer, you really should give it a try. For me, learning to program transforms a computer from a mere tool into a workshop. Or if you prefer, from an instrument into an orchestra—sounds a bit less utilitarian that way. And I tentatively assert that you will never look at a problem, at least a technical one, in the same way again.

Google App Inventor™ is a programming environment for your phone. You do the programming in a web browser, but the thing you build runs on your phone, or anyone else's phone (as long as it's running Android, natch). Everything is free. And it's easy. Not 'quite easy'. Really easy. If this doesn't sound pretty amazing, you should probably stop reading now. 

Agile Volume app screenshotSince last Friday, I have built four applications, three of which are geoscientiferous:

  • Fold* computes fold and trace density, given a seismic acquisition geometry
  • Elastic* finds all of the elastic parameters, given VP, VS, and density
  • Volume* calculates oil in place, given some reservoir properties (shown)

I had each app working, in a basic way, inside an hour. The only slightly tricky thing is setting up the logic to handle blank fields, weird oilfield units, and that sort of thing. Aesthetics can also be fiddly, especially if you are making custom graphics. But if you skip looks and error handling, perhaps because you don't intend to give the app to anyone else, then you can be done in under an hour. 

Evan and I have barely started to explore the tools available. The language inside App Inventor is based on MIT Scratch, the building-block visual interface with a long history at MIT. The vocabulary is very rich: there are math processes, logical constructs, text handlers. You can access the phone, email, the GPS, and even the accelerometer (for instance, in our apps you can shake the phone to clear the parameters and start over). You can draw interactive graphics, scan barcodes, or build a persistent database.

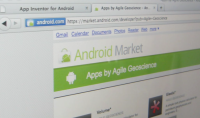
The only problem we've run into so far is the final hurdle: you cannot (yet—App Inventor is still in beta) easily publish your finished app to the Android Market, so that others can download it. There are non-easy ways, and we hope to have our apps up soon. They will be free, though we may experiment with freemium

Next week I'll write a bit about Volume* and show you how the inside of it looks. In the meantime, give it a try... or if you prefer, let us know if there's a killer geoscience app you'd love to have on your phone. I'm on a roll!

Find out more

The Wikipedia articles on Android and App Inventor are very nice summaries. 

iPhone is a registered trademark of Apple, Inc. Android and App Inventor are trademarks of Google Inc. Agile is not connected in any way with any of these marks or companies.

News of the week

The AAPG Annual Convention and Exhibition was this week in Houston. Several companies took the opportunity to announce news. Here's a quick round-up.

Real time well-site mineralogy

Fugro Robertson, a UK-based subsidiary of Dutch company Fugro, introduced RoqSCAN™, a new well-site tool for real-time mineralogical analysis of cuttings. It seems to be a field-portable version of the same technology as their well-received QEMSCAN® lab-based product. Both systems are based on scanning electron microscope analysis. Exciting to see more quantitative tools for geologists. 

More gear for 3D imaging

Ingrain, the exciting 'digital rock physics lab', have bought another Carl Zeiss microscope. But not just any microscope, the AURIGA Crossbeam FIB/SEM, or focused ion beam and scanning electron microscope. Ion beams are useful because, since ions are relatively massive, they can be used to shave extremely thin layers from a rock. The SEM can build up a 3D image of the rock, as it is progressively ablated in this way. If you have never seen Ingrain's 3D images, check out their website for papers like this one (1MB PDF). Amazing.

New plug-ins for viz tool

TerraSpark Geosciences, Geoff Dorn's spin-off from the University of Colorado at Boulder, make a nice-looking piece of software called Insight Earth®. Based on ARCO/BP-funded technology, it's an integrated seismic interpretation tool that seems to have some interesting functionality (we've never seen it in action though). The news is that the company has signed an agreement with visualization gurus INT to develop plug-ins for Insight Earth. Very cool, but we can't help thinking (dreaming?) as we look around these sites: Why isn't any of this open source? 

LMKR go announcement crazy!

The Dubai-based consulting and software firm pwned AAPG, at least if your yardstick is press releases or social media presence (follow @LMKRNews). They are clearly growing aggressively, having taken on marketing and support of Landmark's very nice GeoGraphix software last fall. Watch out for them! Here's what they had to offer:

  • They are hooking up with Object Reservoir, physicist and Landmark co-founder John Mouton's new company, to deliver new shale gas services 
  • They have acquired Cambridge Petroleum Software's Velocity Manager software, for depth conversion functionality.
  • They are adding Scrybe's weirdly-named Convofy to GeoGraphix. What does that mean? We think this may be the most momentous announcement of the year: they have added social media functionality to an integrated interpretation suite. The platform is fully mobile and supports, among other things, microblogging, document sharing, and commenting. 

Even if you are skeptical about social media, please staunch your inner cynic just for a moment and please watch this video. Think about where this last innovation could lead our notions of teamwork, especially in distributed teams. We are excited!

This regular news feature is for information only. We aren't connected with any of these organizations, and don't necessarily endorse their products or services. 

What is your competitive advantage?

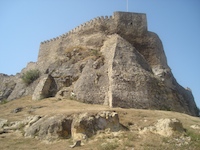
Fortresses no longer provide a competitive advantage.What gave you an advantage once may no longer be helping you. Fortresses just aren't relevant today. Surami Fortress, Georgia.I've been thinking a lot about openness recently. Open-source software, open publishing, and open data are important themes in science today, but not really in business. I think this is going to change in the coming decade, as open-minded young professionals with openness in their blood infiltrate management. I hope Agile* is part of this shift. 

Years ago, oil companies were closed systems. They had secrets. They had large research divisions, rivalling universities in size and scope. They developed their own technology, wrote their own software. The people who worked in these companies were trained in-house, and had long careers. These companies competed with each other on an every-man-for-himself basis, with little regulatory intervention, and little more than admiration and awe from the general public, just glad for its precious petroleum.

Today's industry, however, does not look like this. The typical medium to large oil company...

  • has a small research division, if it has one at all;
  • lets service companies and universities do its innovation, usually as part of a consortium;
  • does little in-house training, relying instead on universities and external trainers;
  • buys dated, off-the-shelf software;
  • has staff attrition and loyalty problems, with most people staying only a few years;
  • is under substantial regulatory and public scrutiny;
  • has customers who don't want or like their product, but are simply addicted to it.

In this environment the research is shared with competitors, the technology is the same as everyone else's, the employees switch companies regularly, and everything is done under the public's disapproving gaze. It is clear that competitive advantage ain't what it used to be. Yet oil companies are stuck in yesterday's mindset, hiding all their data, software, technology, and ideas, even (especially?) the ones that are generic, or useless, or just wrong. What a waste of energy.

So what is your competitive advantage? In the next post, I'll take a look at what I think sets companies apart, and what I think we can safely share. In the mean time, let us know what you think. 

News of the week

AAPG conference starts on Sunday 

The community of petroleum geoscientists will convene in Houston in a few days for the AAPG 2011 Annual Convention & Exhibition. If any geo-tweeps will be there, spare a thought for those that aren't and update us on the events and happenings with the hashtag #ACE2011. Follow @AAPG_Events or @AAPG on Twitter. Wish we were there!

DownUnder Geosolutions coming up over

Australian based DownUnder GeoSolutions (aka DUG, at DuGeo.com) have recently announced that they will be opening offices in Calgary in May. One of the young entrepreneurs helping build this emerging technology company's was recently featured in Petroleum Exploration Society of Australia's magazine. One to keep an eye on!

CGGV have a new processing centre in Oman

The new CGG Veritas office will focus on onshore seismic acquisition and imaging services for the petroleum industry. The centre will also be hosting a university training facility in partnership with the national energy ministry and other industrial partners. In this regard, CCGV is hoping to help develop highly qualified Omani professionals.

Geoscientists without borders

The April issue of SEG's The Leading Edge features stories of the geoscience community solving global humanitarian problems. The International Symposium on the Application of Geophysics to Engineering and Environmental Problems (SAGEEP) has been formed to tackle everything from natural hazards and environmental awarness issues, to finding scarce freshwater resources in impoverished regions. Read more about how geoscientists are making a positive impact and empowering people through education and technology. Great to see this kind of out-reach.

This regular news feature is for information only. We aren't connected with any of these organizations, and don't necessarily endorse their products or services. 

What's hot in geophysics?

Two weeks ago I visited Long Beach, California, attending a conference called Mathematical and Computational Issues in the Geosciences, organized by the Society of Industrial and Applied Mathematicians. I wanted to exercise my cross-thinking skills. 

As expected, the week was very educational for me. Well, some of it was. Some of it was like being beaten about the head with a big bag of math. Anyone for quasi-monotone advection? What about semi-implicit, semi-Lagrangian, P-adaptive discontinuous Galerkin methods then?

Notwithstanding my apparent learning disability, I heard about some fascinating new things. Here are three highlights.

Read More

News of the week

Paradigm showcases new geophysical software

Paradigm will preview its latest exploration and development software technologies and workflows at the AAPG convention 9–13 April 2011. Their agenda covers workflows for multi-disciplinary subsurface teams, next generation geologic software, and a Windows 7 interpretation platform. Paradigm is one of the sponsors of the 2011 AAPG Imperial Barrel Award student propsect competition. Follow them on Twitter: @ParadigmLtd.

Ikon Science releases RockDoc 5.5

Ikon Science has teamed up with the experts at Statoil and immersed rock physics modeling templates into the software interface, allowing users do rock physics all in one place. And with a new extension, External Interface, users can add their own C and MATLAB code to RockDoc. As a MATLAB users, we find this is a very appealing step. Click here to read more.

Third beta release for OpendTect 4.2.0

dGB Earth Sciences, creators of OpendTect, the purveyors of the Open Seismic Repository, have announced their third Beta release of OpendTect 4.2.0. The roll-out of the official version 4.2.0 is due in mid-April. If you aren't using OpendTect, why not download it, and start using this software today. And while you're at it, grab some data from the Open Seismic Repository

PetroChina drills first horizontal shale gas well

China sprang into the embryonic stages of shale gas exploration and development this week when PetroChina completed the drilling of its first horizontal shale gas well in Sichuan Province. It will be exciting to watch the results China strives to access its massive shale gas resources, which up until now have been beyond its technological reach. Click here to read more.

University of Aberdeen opens seisLAB

Thanks to industry sponsors BP, Chevron, BG Group, Halliburton, and Schlumberger, the University of Aberdeen will soon be decked-out with state-of-the-art geoscience software and infrastructure. seisLAB will accelerate training, research, and teaching in one of Europe's energy capitals, pushing innovation and collaboration in the field. Click here to read more.

Geo-FLOSS

Newton didn't need open source, so why do you?Free and open source software is catalyzing a revolution in subsurface science. As a key part of the growing movement to open access to data, information, and the very process of doing science, open software is not just for the geeks. It's a party we're all invited to. 

I have been in California this week, attending a conference in Long Beach called Mathematical and Computational Issues in the Geosciences, organized by the Society of Industrial and Applied Mathematicians. In 2009 I started being more active in my search for lectures and courses that lie outside my usual comfort zone. I have done courses in reservoir engineering and Java programming. I have heard talks on radiology and financial forecasting. It's like being back at university; I like it.

How did I end up at this conference? Last spring, I wrote a little review article about open source software (available here at dGB Earth Science's site). It was really just a copy-edited version of notes I had made whilst looking for free geoscience software and reading up on the subject for my own interest. After some brushes with open source, I was curious about the history behind the idea, how projects are built, and how they are licensed. At the same time, I also started a couple of Wikipedia articles about free software in geology and geophysics, as a place to list the projects I had come across. Kristin Flornes, of IRIS in Stavanger, Norway, saw the article and her colleagues got in touch about the conference.

The talk, which you can access via the thumbnail (left) or look at in Google Docs, is part FLOSS primer, part geo-FLOSS advert, part manifesto for a revolution of innovation. I hope the speaker notes are sufficient. 

What do you think? Is software availability or architecture or capable of driving change, or is it just a tool, passive and inert?

← Click the image for the PDF (6.9M)

How to make a strat column

A few weeks ago I posted about the brilliant TSCreator, a Java application for creating custom geological timescales. One of the nicest features of this tool is that you can create your own lithostratigraphic columns, stick charts, transgression-regression plots, isotope curves, etc. It's a slightly fiddly process, so I wanted to try to give some pointers; this post is about how to make a simple lithostrat column. The other column types are built in a similar way; the full details are described in the Manual (starting on page 20). 

The example I'm showing is the Western Cape Breton column, as given by the Nova Scotia Geological Highway Map. I can't vouch for its accuracy as I've never worked this section; I built it purely to show the method. You can see the result here >

You build the data file, which TSCreator calls a Datapack, in a spreadsheet. I use Google Docs, but you can use any tool you like (OpenOffice.org, Microsoft Excel etc), as long as it will save a tab-delimited text file. The spreadsheet has a header and a data section; here's what the header looks like in my example:

format version: 1.4
date: 10/02/2011
Chart Title: Western Cape Breton
age units: Ma

You can see my example file here (opens in Google Docs). To use it, first save it as a text file: Google Docs > File > Download as > Text. Give it a .txt extension when you get the chance. Then launch TSCreator and select File > Add Datapack. If you get an error it's probably because you have violated one of the formatting rules. It may take some back and forth to get it how you want it.

Finally, I just made the unhappy discovery that you cannot save your chart after you load a custom datapack. Apparently to export an image or SVG file (my preference), you need TS-Creator Pro. Or you get very clever with screen grabs!

If you have your own tips, please leave them in the comments!

Note, TimeScale Creator is a trademark of the Geologic TimeScale Foundation. I am not connected with the software or its creators in any way. Microsoft Excel is a trademark of Microsoft Corporation. Java is a trademark of Oracle Corporation.