Innovations of the decade to come

On Monday I posted about what I think were the major advances in exploration and reservoir geoscience in the last decade. I wanted to follow up with a look at what might happen next.

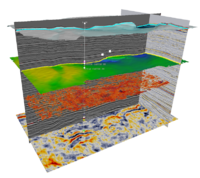
As oil and gas become harder to find and develop safely, responsibly, and economically, our tools and data will of course only continue to improve. In particular, acceptable oil sands and shale gas recovery efficiency demand new ideas and new methods. I hope the next decade will see us making progress in some of these areas, some of them long-lived problems. Here's one, more after the break:

Read More

Innovations of the decade

Exploration geophysics and subsurface geoscience have come a long way since 2001. I thought I could just sneak under the wire before the end of January with a look back at the ideas and technologies that have changed how we find oil and gas today. The list isn't definitive, or even objective: I have my natural bias towards the realm of integrated subsurface interpretation. Anyone with another perspective would, I’m certain, pick different highlights of the previous decade. But these are mine.

It’s fun to think back to the year 2000. It’s the year I emigrated to Canada from Norway, so I remember it clearly. I was at university for most of the 1990’s, but my recollection is that exploration geoscience was all about the emergence of computer-based interpretation, the commoditization of 3D seismic data, huge integrated databases, and the acceptance of amplitude-versus-offset methods (or AVO) as a valid approach.

Here’s what I think were the greatest advances of the noughties, the decade 2001 to 2010...

Read More

Basic cheatsheet

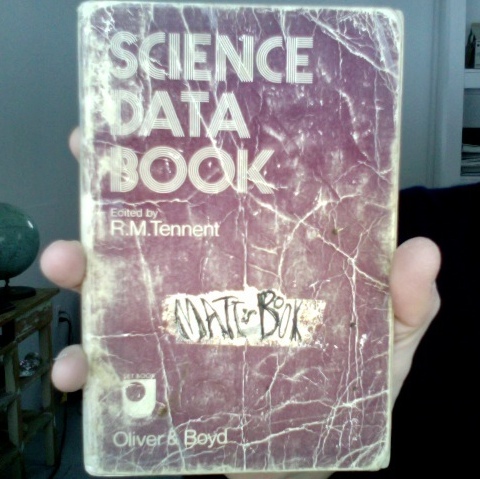
When I was a spotty schoolboy my favourite book was the Science Data Book. This amazing little book, which fit in my jacket pocket (we wore suits to school), went everywhere with me. Everywhere at school, I mean, I'm not that much of a nerd.

It contains some really handy stuff: the Greek alphabet, SI unit definitions, the periodic table, the fundamental constants, handy formulae like the Maclaurin series, (remember that?), and even a very nice table of isotopes (did you know that the half-life of vanadium-50 is 400 trillion years?).

Amazingly, there are some used copies of that little book on Amazon

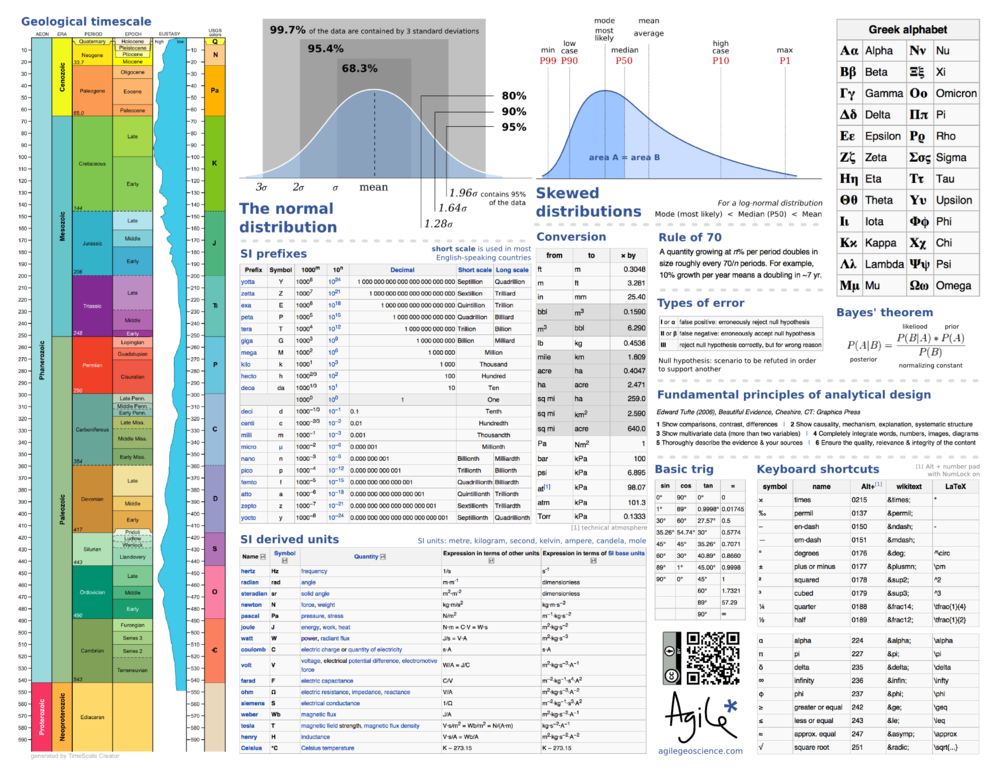
You might think that in these days of smartphones and WiFi everywhere there's no need for such things. But have you never sat in a meeting or lecture and just couldn't remember how many acres in a hectare (2.47), or when the Silurian was (417 Ma BP)? Usually it's too much hassle to pull out my phone, then find Wikipedia and the one piece of data I need. Especially when tapping away on a cell phone looks like you're texting someone 'So bored, please get me out of this meeting, call me in 5 mins?'.

So, I give you the first in a series of cheatsheets. This one has mostly basic stuff on it; future editions will have more geoscience-related content. Print it out and stick in your notebook, or maybe on your wall, right next to Signs & Symbols.

If you use it, please let me know what you like or dislike, so I can improve it. Have I missed anything you're always looking up?

← Click on the image for the PDF

Create better time scales

If you ever find yourself drawing geological time scales in Microsoft PowerPoint (embarrassingly enough, this has happened to me), or trying to build a hackish database of geological events in Microsoft Excel, then you need TimeScale Creator. This free, Java-based application runs on any platform (because it's Java), and is fully extensible with your own stratigraphic data. You can also buy a Pro version ($500 for non-commerical use, or $1500 for commercial purposes). The upgrade gets you various stratigraphic data packs and other perks like better export functionality. 

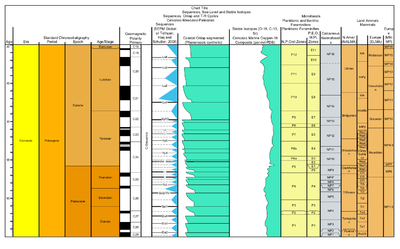
To give you a flavour of what this little app can do, I made a quick column for part of the Palaeogene. I picked the interval more or less at random, and haven't changed any of the defaults except the columns to display, but this took me about 60 seconds to make. The data I'm showing here are all included in the free version, and all ratified by the International Commission on Stratigraphy. And I can export it as an SVG file (scalable vector graphics), which I can edit freely in Inkscape or any of several other vector graphics editors. applications. Here it is:

You can download the software by following this link. If you have any tips for using the software, or other ways to make timescales, please leave them in the comments!

Note, TimeScale Creator is a trademark of the Geologic TimeScale Foundation. I am not connected with the software or its creators in any way. Microsoft PowerPoint and Excel are trademarks of Microsoft Corporation. Java is a trademark of Oracle Corporation.

The integration gap

Agile teams have lots of ways to be integrated. They need to be socially integrated: they need to talk to each other, know what team-mates are working on, and have lots of connections to other agile teams and individuals. They need to be actively integrated: their workflows must complement one another's. If the geologist is working on new bulk density curves, the geophysicist uses those curves for the synthetic seismograms; if the geophysicist tweaks the seismic inversion result, the geomodeller uses that volume for the porosity distribution.

But the agile team also needs to be empirically integrated: the various datasets need to overlap somehow so they can be mutually calibrated and correlated. But if we think about the resolution of subsurface data, both spatially, in the (x,y) plane, and vertically, on the z axis, we reveal a problem—the integration gap.

Scales_of_measurement.png

This picks up again on scale (see previous post). Geophysical data is relatively low-resolution: we can learn all about large, thick features. But we know nothing about small things, about a metre in size, say. Conversely, well-based data can tell us lots about small things, even very small things indeed. A vertical well can tell us about thick things, but not spatially extensive things. A horizontal well can tell us a bit more about spatially large things, but not about thick things. And in between this small-scale well data and the large-scale seismic data? A gap. 

This little gap is responsible for much of the uncertainty we encounter in the subsurface. It is where the all-important well-tie lives. It leads to silos, un-integrated behaviour, and dysfunctional teams. And it's where all the fun is!

† I've never thought about it before, but there doesn't seem to be an adjectival form of the word 'data'. 


UPDATE This figure was updated later:

Scales_of_measurement_complete.png

3 ways to be Agile*

Building on last week's post, I think that not only the principles of agile development could apply to subsurface science, I think some of the tactics employed might also benefit us geoscientists. For example:

Ship and iterate: get maps, sections, velocity models, even geomodels, made early. Don’t wait until everything is perfect (it never will be). Making these things will help reveal the weaknesses in the data and the uncertainties interpretation, and you can be more strategic about what you spend time on. Do everything you can to make the iteration faster (use macros, write scripts, outsource).

Daily scrums: subsurface teams get together on a daily basis, for no more than 10 or 15 minutes. Everyone gives their two or three headlines, quick things are dealt with, other things are flagged for follow-up. And everyone can get on with their day... no more 1 hour meetings!

Pair interpretation: seismic interpreters sit together to interpret, with one picking the lines and looking at waveform character, the other taking a wide-angle view, looking for consistency, nearby well ties, or thinking about the geological setting. Slower, probably, but maybe better (in programming, this technique produces fewer bugs).