What is your competitive advantage?

Fortresses no longer provide a competitive advantage.
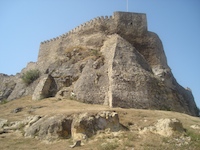
What gave you an advantage once may no longer be helping you. Fortresses just aren't relevant today. Surami Fortress, Georgia.I've been thinking a lot about openness recently. Open-source software, open publishing, and open data are important themes in science today, but not really in business. I think this is going to change in the coming decade, as open-minded young professionals with openness in their blood infiltrate management. I hope Agile* is part of this shift. 

Years ago, oil companies were closed systems. They had secrets. They had large research divisions, rivalling universities in size and scope. They developed their own technology, wrote their own software. The people who worked in these companies were trained in-house, and had long careers. These companies competed with each other on an every-man-for-himself basis, with little regulatory intervention, and little more than admiration and awe from the general public, just glad for its precious petroleum.

Today's industry, however, does not look like this. The typical medium to large oil company...

  • has a small research division, if it has one at all;
  • lets service companies and universities do its innovation, usually as part of a consortium;
  • does little in-house training, relying instead on universities and external trainers;
  • buys dated, off-the-shelf software;
  • has staff attrition and loyalty problems, with most people staying only a few years;
  • is under substantial regulatory and public scrutiny;
  • has customers who don't want or like their product, but are simply addicted to it.

In this environment the research is shared with competitors, the technology is the same as everyone else's, the employees switch companies regularly, and everything is done under the public's disapproving gaze. It is clear that competitive advantage ain't what it used to be. Yet oil companies are stuck in yesterday's mindset, hiding all their data, software, technology, and ideas, even (especially?) the ones that are generic, or useless, or just wrong. What a waste of energy.

So what is your competitive advantage? In the next post, I'll take a look at what I think sets companies apart, and what I think we can safely share. In the mean time, let us know what you think. 

Scales of sea-level change

Relative sea-level curve for the PhanerozoicClick to read about sea level on Wikipedia. Image prepared by Robert Rohde and licensed for public use under CC-BY-SA.Sea level changes. It changes all the time, and always has (right). It's well known, and obvious, that levels of glaciation, especially at the polar ice-caps, are important controls on the rate and magnitude of changes in global sea level. Less intuitively, lots of other effects can play a part: changes in mid-ocean ridge spreading rates, the changing shape of the geoid, and local tectonics.

A recent paper in Science by Petersen et al (2010) showed evidence for mantle plumes driving the cyclicity of sedimentary sequences. This would be a fairly local effect, on the order of tens to hundreds of kilometres. This is important because some geologists believe in the global correlatability of these sequences. A fanciful belief in my view—but that's another story.

The paper reminded me of an attempt I once made to catalog the controls on sea level, from long-term global effects like greenhouse–icehouse periods, to short-term local effects like fault movement. I made the table below. I think most of the data, perhaps all of it, were from Emery and Aubrey (1991). It's hard to admit, because I don't feel that old, but this is a rather dated publication now; I think it's solid enough for the sort of high-level overview I am interested in. 

After last week's doodling, the table inspired me to try another scale-space cartoon. I put amplitude on the y-axis, rate on the x-axis. Effects with global reach are in bold, those that are dominantly local are not. The rather lurid colours represent different domains: magmatic, climatic, isostatic, and (in green) 'other'. The categories and the data correspond to the table.
Infographic: scales of sea level changeIt is interesting how many processes are competing for that top right-hand corner: rapid, high-amplitude sea level change. Clearly, those are the processes we care about most as sequence stratigraphers, but also as a society struggling with the consequences of our energy addiction.

References
Emery, K & D Aubrey (1991). Sea-levels, land levels and tide gauges. Springer-Verlag, New York, 237p.
Petersen, K, S Nielsen, O Clausen, R Stephenson & T Gerya (2010). Small-scale mantle convection produces stratigraphic sequences in sedimentary basins. Science 329 (5993) p 827–830, August 2010. DOI: 10.1126/science.1190115

News of the week

AAPG conference starts on Sunday 

The community of petroleum geoscientists will convene in Houston in a few days for the AAPG 2011 Annual Convention & Exhibition. If any geo-tweeps will be there, spare a thought for those that aren't and update us on the events and happenings with the hashtag #ACE2011. Follow @AAPG_Events or @AAPG on Twitter. Wish we were there!

DownUnder Geosolutions coming up over

Australian based DownUnder GeoSolutions (aka DUG, at DuGeo.com) have recently announced that they will be opening offices in Calgary in May. One of the young entrepreneurs helping build this emerging technology company's was recently featured in Petroleum Exploration Society of Australia's magazine. One to keep an eye on!

CGGV have a new processing centre in Oman

The new CGG Veritas office will focus on onshore seismic acquisition and imaging services for the petroleum industry. The centre will also be hosting a university training facility in partnership with the national energy ministry and other industrial partners. In this regard, CCGV is hoping to help develop highly qualified Omani professionals.

Geoscientists without borders

The April issue of SEG's The Leading Edge features stories of the geoscience community solving global humanitarian problems. The International Symposium on the Application of Geophysics to Engineering and Environmental Problems (SAGEEP) has been formed to tackle everything from natural hazards and environmental awarness issues, to finding scarce freshwater resources in impoverished regions. Read more about how geoscientists are making a positive impact and empowering people through education and technology. Great to see this kind of out-reach.

This regular news feature is for information only. We aren't connected with any of these organizations, and don't necessarily endorse their products or services. 

The scales of geoscience

Helicopter at Mount St Helens in 2007. Image: USGS.Geoscientists' brains are necessarily helicoptery. They can quickly climb and descend, hover or fly. This ability to zoom in and out, changing scale and range, develops with experience. Thinking and talking about scales, especially those outside your usual realm of thought, are good ways to develop your aptitude and intuition. Intuition especially is bound to the realms of your experience: millimetres to kilometres, seconds to decades. 

Being helicoptery is important because processes can manifest themselves in different ways at different scales. Currents, for example, can result in sorting and rounding of grains, but you can often only see this with a hand-lens (unless the grains are automobiles). The same environment might produce ripples at the centimetre scale, dunes at the decametre scale, channels at the kilometre scale, and an entire fluvial basin at another couple of orders of magnitude beyond that. In moments of true clarity, a geologist might think across 10 or 15 orders of magnitude in one thought, perhaps even more.

A couple of years ago, the brilliant web comic artist xkcd drew a couple of beautiful infographics depicting scale. Entitled height and depth (left), they showed the entire universe in a logarithmic scale space. More recently, a couple of amazing visualizations have offered different visions of the same theme: the wonderful Scale of the Universe, which looks at spatial scale, and the utterly magic ChronoZoom, which does a similar thing with geologic time. Wonderful.

These creations inspired me to try to map geological disciplines onto scale space. You can see how I did below. I do like the idea but I am not very keen on my execution. I think I will add a time dimension and have another go, but I thought I'd share it at this stage. I might even try drawing the next one freehand, but I ain't no Randall Munroe.

I'd be very happy to receive any feedback about improving this, or please post your own attempts!

What's hot in geophysics?

Two weeks ago I visited Long Beach, California, attending a conference called Mathematical and Computational Issues in the Geosciences, organized by the Society of Industrial and Applied Mathematicians. I wanted to exercise my cross-thinking skills. 

As expected, the week was very educational for me. Well, some of it was. Some of it was like being beaten about the head with a big bag of math. Anyone for quasi-monotone advection? What about semi-implicit, semi-Lagrangian, P-adaptive discontinuous Galerkin methods then?

Notwithstanding my apparent learning disability, I heard about some fascinating new things. Here are three highlights.

Read More

News of the week

Paradigm showcases new geophysical software

Paradigm will preview its latest exploration and development software technologies and workflows at the AAPG convention 9–13 April 2011. Their agenda covers workflows for multi-disciplinary subsurface teams, next generation geologic software, and a Windows 7 interpretation platform. Paradigm is one of the sponsors of the 2011 AAPG Imperial Barrel Award student propsect competition. Follow them on Twitter: @ParadigmLtd.

Ikon Science releases RockDoc 5.5

Ikon Science has teamed up with the experts at Statoil and immersed rock physics modeling templates into the software interface, allowing users do rock physics all in one place. And with a new extension, External Interface, users can add their own C and MATLAB code to RockDoc. As a MATLAB users, we find this is a very appealing step. Click here to read more.

Third beta release for OpendTect 4.2.0

dGB Earth Sciences, creators of OpendTect, the purveyors of the Open Seismic Repository, have announced their third Beta release of OpendTect 4.2.0. The roll-out of the official version 4.2.0 is due in mid-April. If you aren't using OpendTect, why not download it, and start using this software today. And while you're at it, grab some data from the Open Seismic Repository

PetroChina drills first horizontal shale gas well

China sprang into the embryonic stages of shale gas exploration and development this week when PetroChina completed the drilling of its first horizontal shale gas well in Sichuan Province. It will be exciting to watch the results China strives to access its massive shale gas resources, which up until now have been beyond its technological reach. Click here to read more.

University of Aberdeen opens seisLAB

Thanks to industry sponsors BP, Chevron, BG Group, Halliburton, and Schlumberger, the University of Aberdeen will soon be decked-out with state-of-the-art geoscience software and infrastructure. seisLAB will accelerate training, research, and teaching in one of Europe's energy capitals, pushing innovation and collaboration in the field. Click here to read more.

Great geophysicists #3

Today is a historic day for greatness: Rene Descartes was born exactly 415 years ago, and Isaac Newton died 284 years ago. They both contributed to our understanding of physical phenomena and the natural world and, while not exactly geophysicists, they changed how scientists think about waves in general, and light in particular.

Unweaving the rainbow

Scientists of the day recognized two types of colour. Apparent colours were those seen in prisms and rainbows, where light itself was refracted into colours. Real colours, on the other hand, were a property of bodies, disclosed by light but not produced by that light. Descartes studied refraction in raindrops and helped propagate Snell’s law in his 1637 paper, Dioptrica. His work severed this apparent–real dichotomy: all colours are apparent, and the colour of an object depends on the light you shine on it.

Newton began to work seriously with crystalline prisms around 1666. He was the first to demonstrate that white light is a scrambled superposition of wavelengths; a visual cacophony of information. Not only does a ray bend in relation to the wave speed of the material it is entering (read the post on Snellius), but Newton made one more connection. The intrinsic wave speed of the material, in turn depends on the frequency of the wave. This phenomenon is known as dispersion; different frequency components are slowed by different amounts, angling onto different paths.

What does all this mean for seismic data?

Seismic pulses, which strut and fret through the earth, reflecting and transmitting through its myriad contrasts, make for a more complicated type of prism-dispersion experiment. Compared to visible light, the effects of dispersion are subtle, negligible even, in the seismic band 2–200 Hz. However, we may measure a rock to have a wave speed of 3000 m/s at 50 Hz, and 3500 m/s at 20 kHz (logging frequencies), and 4000 m/s at 10 MHz (core laboratory frequencies). On one hand, this should be incredibly disconcerting for subsurface scientists: it keeps us from bridging the integration gap empirically. It is also a reason why geophysicists get away with haphazardly stretching and squeezing travel time measurements taken at different scales to tie wells to seismic. Is dispersion the interpreters’ fudge-factor when our multi-scale data don’t corroborate?

Chris Liner, blogging at Seismos, points out

...so much of classical seismology and wave theory is nondispersive: basic theory of P and S waves, Rayleigh waves in a half-space, geometric spreading, reflection and transmission coefficients, head waves, etc. Yet when we look at real data, strong dispersion abounds. The development of spectral decomposition has served to highlight this fact.

We should think about studying dispersion more, not just as a nuisance for what is lost (as it has been traditionally viewed), but as a colourful, scale-dependant property of the earth whose stories we seek to hear.

More on brevity

Yesterday, I wrote about one of Orwell's essays, and about Watson and Crick's famous letter to Nature. The theme: short expositions win. Today, I continue the theme, with two more brief but brilliant must-reads for the aspiring writer. 

Albert Einstein

The first time Einstein's equation appeared in printLike the Watson and Crick letter, Einstein's 1905 paper Does the inertia of a body depend on its energy content? was profound and eternal. In it, he derived the expression m = c2. Though the paper was arguably little more than an extension of others he published that year, it was very short: exactly three (small) pages long. His concluding remark couldn't be clearer or more succinct:

If the theory corresponds to the facts, radiation conveys inertia between the emitting and absorbing bodies.

Einstein's writing style was influenced by Ernst Mach's book, The Science of Mechanics (Minor, 1984). Mach adopted a pedagogic, step-by-step style that guided the reader through the scientist's reasoning. Asking the reader to imagine an analogous scenario or simplified example was, in my experience, common in physics books of the period. Richard Feynman used a similar straightforward style. I try to use it myself, but sometimes the desire to impress gets the better of me.

Kenneth Landes

Years of reviewing journal papers has convinced me: the abstract is one of the most abused and misunderstood animals of science. I regularly hand Landes' brilliant little plea to new writers, and it bears re-reading once every couple of years. Landes points out that the abstract should "concentrate in itself the essential information of a paper or article". Here is his superbly cheeky, information-free counterexample:

A partial biography of the writer is given. The inadequate abstract is discussed. What should be covered by an abstract is considered. The importance of the abstract is described. Dictionary definitions of 'abstract' are quoted. At the conclusion a revised abstract is presented. 

Read his short note for the improved version of this soggy squib of an abstract. 

What do we draw from these authors? I'll be brief: so should you.

References
Einstein, A (1905). Ist die Trägheit eines Körpers von seinem Energiegehalt abhängig?, in Annalen der Physik. 18:639, 1905. Published in English by Methuen, 1923.
Landes, K (1966). A scrutiny of the abstract II. American Association of Petroleum Geologists Bulletin 50 (9), p 1992.
Mach, E (1883). The science of mechanics. Later English translation here. 
Minor, D (1984). Albert Einstein on writing. J. Technical Writing and Communication 14 (1), p 13–18. [Requires subscription or purchase]. 

On brevity

As another of my new endeavours for the year, I plan to teach a short course on writing. I have been researching the subject, looking for advice, examples and counter-examples. Some of my favourites come from the archives, where I expected to find only dusty obfuscation, written in the tortuous prose many people associate with science. Instead, I came across some tiny but glittering gems. Today: Orwell, and Watson & Crick. 

George Orwell

George Orwell had advice for writersOrwell's short essay, Politics and the English Language, is partly about politics, but mostly about language. A little on the dusty side perhaps, at least to my taste, but it has two highlights. First, Orwell quotes some perverse paragraphs from the more pompous writers of the day, like this unreadable piffle from one scholar:

Above all, we cannot play ducks and drakes with a native battery of idioms which prescribes egregious collocations of vocables as the Basic put up with for tolerate, or put at a loss for bewilder.

Second, Orwell offers six rules to improve our writing:

  1. Never use a metaphor, simile, or other figure of speech which you are used to seeing in print.
  2. Never use a long word where a short one will do.
  3. If it is possible to cut a word out, always cut it out.
  4. Never use the passive where you can use the active.
  5. Never use a foreign phrase, a scientific word, or a jargon word if you can think of an everyday English equivalent.
  6. Break any of these rules sooner than say anything outright barbarous.

Watson and Crick

One of the most famous scientific papers of all timeOne of the most important and widely recognized scientific publications of the last century turns out to be nothing more than a one-page letter. As well as being brief, it even reads like a letter, with plain language and plenty of opinion and informed speculation. Although the results were published in full elsewhere, doubtless in more technical language, and although letters are still used in some journals, I love the unselfconscious ease with which this seismic discovery was announced. If anyone is up for the challenge, it would be fun to parody a modern press-release for this discovery.

Click the thumbnail for the full paper →

Tomorrow, I offer two more short pieces to rev up your writing. Meanwhile... do you have any favourites from the archives of science writing? Please share them! Unless they're in Latin.

Geo-FLOSS

Newton didn't need open source, so why do you?Free and open source software is catalyzing a revolution in subsurface science. As a key part of the growing movement to open access to data, information, and the very process of doing science, open software is not just for the geeks. It's a party we're all invited to. 

I have been in California this week, attending a conference in Long Beach called Mathematical and Computational Issues in the Geosciences, organized by the Society of Industrial and Applied Mathematicians. In 2009 I started being more active in my search for lectures and courses that lie outside my usual comfort zone. I have done courses in reservoir engineering and Java programming. I have heard talks on radiology and financial forecasting. It's like being back at university; I like it.

How did I end up at this conference? Last spring, I wrote a little review article about open source software (available here at dGB Earth Science's site). It was really just a copy-edited version of notes I had made whilst looking for free geoscience software and reading up on the subject for my own interest. After some brushes with open source, I was curious about the history behind the idea, how projects are built, and how they are licensed. At the same time, I also started a couple of Wikipedia articles about free software in geology and geophysics, as a place to list the projects I had come across. Kristin Flornes, of IRIS in Stavanger, Norway, saw the article and her colleagues got in touch about the conference.

The talk, which you can access via the thumbnail (left) or look at in Google Docs, is part FLOSS primer, part geo-FLOSS advert, part manifesto for a revolution of innovation. I hope the speaker notes are sufficient. 

What do you think? Is software availability or architecture or capable of driving change, or is it just a tool, passive and inert?

← Click the image for the PDF (6.9M)