Yesterday was the second day of the open geophysics software workshop I attended in Houston. After the first day (which I also wrote about), I already felt like there were a lot of great geophysical powertools to follow up on and ideas to chase up, but day two just kept adding to the pile. In fact, there might be two piles now.
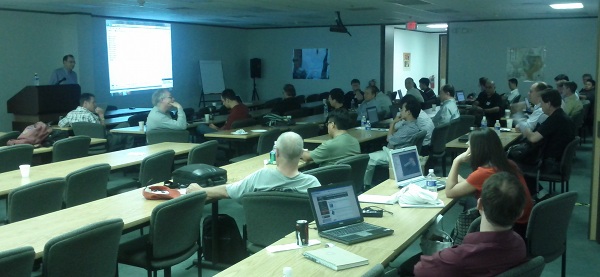 First up, Nick Vlad from FusionGeo gave us another look at open source systems from a commercial processing shop's perspective. Along with Alex (on day 1) and Renée (later on), he gave plenty of evidence that open source is not only compatible with business, but it's good for business. FusionGeo firmly believe that no one package can support them exclusively, and showed us GeoPro, their proprietary framework for integrating SEPlib, SU, Madagascar, and CP Seis.
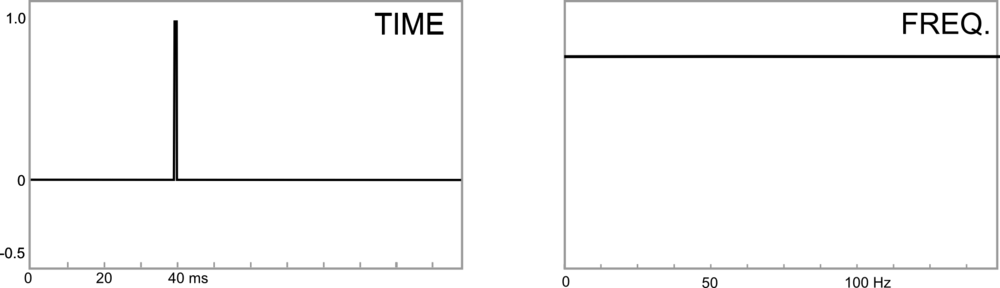
 Yang Zhang from Stanford then showed us how reproducibility is central to SEPlib (as it is to Madagascar). When possible, researchers in the Stanford Exploration Project build figures with makefiles, which can be run by anyone to easily reproduce the figure. When this is not possible, a figure is labelled as non-reproducible; if there are some dependencies, on data for example, then it is called conditionally reproducible. (For the geeks out there, the full system for implementing this involves SEPlib, GNU make, Vplot, LaTeX, and SCons).
 Next up was a reproducibility system with ancestry in SEPlib: Madagascar, presented by the inimitable Sergey Fomel. While casually downloading and compiling Madagascar, he described how it allows for quick regeneration of figures, even from other sources like Mathematica. There are some nice usability features of Madagascar: you can easily interface with processes using Python (as well as Java, among other languages), and tools like OpendTect and BotoSeis can even provide a semi-graphical interface. Sergey also mentioned the importance of a phenomenon called dissertation procrastination, and why grad students sometimes spend weeks writing amazing code:
"Building code gives you good feelings: you can build something powerful, and you make connections with the people who use it"
After the lunch break, Joe Dellinger from BP explained how he thought some basic interactivity could be added to Vplot, SEP's plotting utility. The goal would not be to build an all-singing, all-dancing graphics tool, but to incrementally improve Vplot to support editing labels, changing scales, and removing elements. A good goal for a 1-day hack-fest?
 The show-stopper of the day was Bjorn Olofsson of SeaBird Exploration. I think it's fair to say that everyone was gobsmacked by his description of SeaSeis, a seismic processing system that he has built with his own bare hands. This was the first time he has presented the system, but he started the project in 2005 and open-sourced it about 18 months ago. Bjorn's creation stemmed from an understandable (to me) frustration with other packages' apparent complexity and unease-of-use. He has built enough geophysical algorithms for SeaBird to use the software at sea, but the real power is in his interactive viewing tools. Built with Java, Bjorn has successfully exploited all the modern GUI libraries at his disposal. Due to constraints on his time, the future is uncertain. Message of the day: Help this man!
Renée Bourque of dGB also opened a lot of eyes with her overview of OpendTect and the Open Seismic Repository. dGB's tools are modern, user-friendly, and flexible. I think many people present realized that these tools—if combined with the depth and breadth of more fundamental pieces like SU, SEPlib and Madagascar—could offer the possibility of a robust, well-supported, well-documented, and rich environment that processors can use every day, without needing a lot of systems support or hacking skills. The paradigm already exists: Madagascar has an interface in OpendTect today.
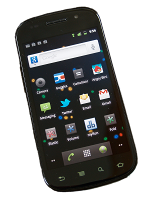
As the group began to start thinking about the weekend, it was left to me, Matt Hall, to see if there was any more appetite for hearing about geophysics and computers. There was! Just enough for me to tell everyone a bit about mobile devices, the Android operating system, and the App Inventor programming canvas. More on this next week!
It was an inspiring and thought-provoking workshop. Thank you to Karl Schleicher and Robert Newsham for organizing, and Cheers! to the new friends and acquaintances. My own impression was that the greatest challenge ahead for this group is not so much computational, but more about integration and consolidation. I'm looking forward to the next one!
Update on 2011-06-24 17:26 by Matt Hall
You can read about, and even listen to, my own talk in this post.

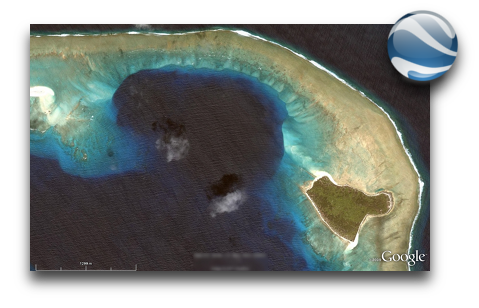
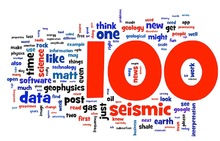 Yesterday Evan posted the 100th article on the blog. Not all of them have been technical, though most are. A few were special cases, hosting the popular Where on (Google) Earth game for example. But most have been filled with geoscience goodness... at least we think so. We hope you do too.
 It's a little harder to tell which article is the most read. There's a bias through time, since older pages have been up longer. And the front page gets most of the traffic, and each article gets a spell as the top story, but we don't track which articles are up when that page is visited.


 Except where noted, this content is licensed