SEG 2014: sampling from the smorgasbord
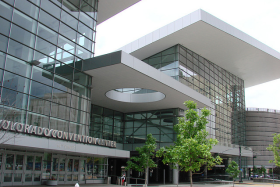
Next week, Matt and I will be attending the 2014 SEG Annual General Meeting at the Colorado Convention Centre in Denver. Join the geo-tweeting using the hashtag #SEG2014 and stay tuned on the blog for our daily highlights.

Fitness training

I spent a couple of hours yesterday reviewing the conference schedule in an attempt to form an opinion on what deserved my attention. The meeting boasts content from over 1600 abstract submissions which it has dispersed over three formats: oral presentations, poster presentations, and oral discussions/e-posters (looking forward to finding out how these work). Any given moment there will be 12 oral, 3 poster, and 6 e-poster presentations going on, not to mention all the happenings on the exhibition floor. A worthy test for my navigation skills, discipline, and endurance, as well as the new and improved SEG events mobile app.

The technical program

There are 101 sessions in the technical program, each with around 8 presentations. Six of these sessions are dubbed special sessions, hosting either invited speakers from other domains such as hydrogeophysics and completions engineering, or a heavyweight lineup of seismic celebs. Special session numero uno, entitled Recent Advances And The Road Ahead is  the session that I'm most looking forward to. It kicks off the technical program on Monday afternoon with talks from:

  • Christof Stork (ION Geophysical), The decline of conventional seismic acquisition and the rise of specialized acquisition: this is compressive sensing.
  • Sergy Fomel (UT Austin), Recent advances in time-domain seismic imaging. 
  • John Etgen (BP), Seismic adaptive optics. 
  • Kurt Marfurt (Univ. of Oklahoma), Seismic attributes and the road ahead. 
  • Reinarldo Michelena (iReservoir), Flow simulation models for unconventional reservoirs: The role of seismic data.

Other presentations throughout the week that have made it onto my must-see list:

  • Andreas Rüger (Halliburton), A practitioner's approach to full waveform inversion.
  • Lewis Li (Stanford), Uncertainty maps for seismic images through geostatistical model randomization.
  • Kevin Liner (Univ. of Arkansas), Study of basement rocks in Northeastern Oklahoma with 3D seismic and well logs.
  • Xinyuan Luan (China Univ. of Petroleum), Laboratory measurements of brittleness anisotropy in synthetic shale with different cementation.
  • Anya Reitz (Colorado School of Mines), Feasibility of surface and borehole time-lapse gravity for SAGD monitoring.
  • Cai Lu (Univ. of Electronic Science and Technology of China), Application of multi-attributes fused volume rendering techniques in 3D seismic interpretation.

To top it all off on Thursday afternoon, Matt and I will be at workshop number 9, Latest Developments in Time-Frequency Analysis. It is one of many post convention workshops worth sticking around for after the booths get torn down and the the exhibition doors close.

SEG Wikithon

If you read The Leading Edge frequently or if you visit the SEG website regularly, you may have noticed an increased presence of SEG Wiki. Matt and his allies Isaac Farley and Andrew Geary will be parked in Room 708 between 12–2pm and 5–6pm October 26–29. For more information about SEG Wiki and the Wikithon, check out Isaac's article from the September issue, and find out all the details on wiki page (naturally).

Whatever you want to call it

Lastly, I couldn't help but snag a selection of the coolest names from the technical session. I can only imagine what the organizing committee was thinking:

Well, they got my attention. And with so much content to choose from, maybe that's all that matters.

Image by user bonjourpeewee on flickr, licensed CC-BY-SA.

Why don't people use viz rooms?

Matteo Niccoli asked me why I thought the use of immersive viz rooms had declined. Certainly, most big companies were building them in about 1998 to 2002, but it's rare to see them today. My stock answer was always "Linux workstations", but of course there's more to it than that.

What exactly is a viz room?

I am not talking about 'collaboration rooms', which are really just meeting rooms with a workstation and a video conference phone, a lot of wires, and wireless mice with low batteries. These were one of the collaboration technologies that replaced viz rooms, and they seem to be ubiquitous (and also under-used).

The Viz Lab at Wisconsin–Madison. Thanks to Harold Tobin for permission.A 'viz room', for our purposes here, is a dark room with a large screen, at least 3 m wide, probably projected from behind. There's a Crestron controller with greasy fingerprints on it. There's a week-old coffee cup because not even the cleaners go in there anymore. There's probably a weird-looking 3D mouse and some clunky stereo glasses. There might be some dusty haptic equipment that would work if you still had an SGI.

Why did people stop using them?

OK, let's be honest... why didn't most people use them in the first place?

  1. The rise of the inexpensive Linux workstation. The Sun UltraSPARC workstations of the late 1990s couldn't render 3D graphics quickly enough for spinning views or volume-rendered displays, so viz rooms were needed for volume interpretation and well-planning. But fast machines with up to 16GB of RAM and high-end nVidia or AMD graphics cards came along in about 2002. A full dual-headed set-up cost 'only' about $20k, compared to about 50 times that for an SGI with similar capabilities (for practical purposes). By about 2005, everyone had power and pixels on the desktop, so why bother with a viz room?
  2. People never liked the active stereo glasses. They were certainly clunky and ugly, and some people complained of headaches. It took some skill to drive the software, and to avoid nauseating spinning around, so the experience was generally poor. But the real problem was that nobody cared much for the immersive experience, preferring the illusion of 3D that comes from motion. You can interactively spin a view on a fast Linux PC, and this provides just enough immersion for most purposes. (As soon as the motion stops, the illusion is lost, and this is why 3D views are so poor for print reproduction.)
  3. They were expensive. Early adoption was throttled by expense  (as with most new technology). The room renovation might cost $250k, the SGI Onyx double that, and the projectors were $100k each. But  even if the capex was affordable, everyone forgot to include operating costs — all this gear was hard to maintain. The pre-DLP cathode-ray-tube projectors needed daily calibration, and even DLP bulbs cost thousands. All this came at a time when companies were letting techs go and curtailing IT functions, so lots of people had a bad experience with machines crashing, or equipment failing.
  4. Intimidation and inconvenience. The rooms, and the volume interpretation workflow generally, had an aura of 'advanced'. People tended to think their project wasn't 'worth' the viz room. It didn't help that lots of companies made the rooms almost completely inaccessible, with a locked door and onerous booking system, perhaps with a gatekeeper admin deciding who got to use it.
  5. Our culture of PowerPoint. Most of the 'collaboration' action these rooms saw was PowerPoint, because presenting with live data in interpretation tools is a scary prospect and takes practice.
  6. Volume interpretation is hard and mostly a solitary activity. When it comes down to it, most interpreters want to interpret on their own, so you might as well be at your desk. But you can interpret on your own in a viz room too. I remember Richard Beare, then at Landmark, sitting in the viz room at Statoil, music blaring, EarthCube buzzing. I carried on this tradition when I was at Landmark as I prepared demos for people, and spent many happy hours at ConocoPhillips interpreting 3D seismic on the largest display in Canada.  

What are viz rooms good for?

Don't get me wrong. Viz rooms are awesome. I think they are indispensable for some workflows: 

  • Well planning. If you haven't experienced planning wells with geoscientists, drillers, and reservoir engineers, all looking at an integrated subsurface dataset, you've been missing out. It's always worth the effort, and I'm convinced these sessions will always plan a better well than passing plans around by email. 
  • Team brainstorming. Cracking open a new 3D with your colleagues, reviewing a well program, or planning the next year's research projects, are great ways to spend a day in a viz room. The broader the audience, as long as it's no more than about a dozen people, the better. 
  • Presentations. Despite my dislike of PowerPoint, I admit that viz rooms are awesome for presentations. You will blow people away with a bit of live data. My top tip: make PowerPoint slides with an aspect ratio to fit the entire screen: even PowerPoint haters will enjoy 10-metre-wide slides.

What do you think? Are there still viz rooms where you work? Are there 'collaboration rooms'? Do people use them? Do you?

October linkfest

The linkfest has come early this month, to accommodate the blogging blitz that always accompanies the SEG Annual Meeting. If you're looking forward to hearing all about it, you can make sure you don't miss a thing by getting our posts in your email inbox. Guaranteed no spam, only bacn. If you're reading this on the website, just use the box on the right →


Open geoscience goodness

I've been alerted to a few new things in the open geoscience category in the last few days:

  • Dave Hale released his cool-looking fault detection code
  • Wayne Mogg released some OpendTect plugins for AVO, filtering, and time-frequency decomposition
  • Joel Gehman and others at U of A and McGill have built WellWiki, a wiki... for wells!
  • Jon Claerbout, Stanford legend, has released his latest book with Sergey Formel, Austin legend: Geophysical Image Estimation by Example. As you'd expect, it's brilliant, and better still: the code is available. Amazing resource.

And there's one more resource I will mention, but it's not free as in speech, only free as in beerPetroacoustics: A Tool for Applied Seismics, by Patrick Rasolofosaon and Bernard Zinszner. So it's nice because you can read it, but not that useful because the terms of use are quite stringent. Hat tip to Chris Liner.

So what's the diff if things are truly open or not? Well, here's an example of the good things that happen with open science: near-real-time post-publication peer review and rapid research: How massive was Dreadnoughtus?

Technology and geoscience

Napa earthquakeOpen data sharing has great potential in earthquake sensing, as there are many more people with smartphones than there are seismometers. The USGS shake map (right) is of course completely perceptual, but builds in real time. And Jawbone, makers of the UP activity tracker, were able to sense sleep interruption (in their proprietary data): the first passive human-digital sensors?

We love all things at the intersection of the web and computation... so Wolfram Alpha's new "Tweet a program" bot is pretty cool. I asked it:

GeoListPlot[GeoEntities[=[Atlantic Ocean], "Volcano"]]

And I got back a map!

This might be the coolest piece of image processing I've ever seen. Recovering sound from silent video images:

Actually, these time-frequency decompositions [PDF] of frack jobs are just as cool (Tary et al., 2014, Journal of Geophysical Research: Solid Earth 119 (2), 1295-1315). These deserve a post of their own some time.

It turns out we can recover signals from all sorts of unexpected places. There were hardly any seismic sensors around when Krakatoa exploded in 1883. But there were plenty of barometers, and those recorded the pressure wave as it circled the earth — four times! Here's an animation from the event.

It's hard to keep up with all the footage from volcanic eruptions lately. But this one has an acoustic angle: watch for the shockwave and the resulting spontaneous condensation in the air. Nonlinear waves are fascinating because the wave equation and other things we take for granted, like the superposition principle and the speed of sound, no longer apply.

Discussion and collaboration

Our community has a way to go before we ask questions and help each other as readily as, say, programmers do, but there's enough activity out there to give hope. My recent posts (one and two) about data (mis)management sparked a great discussion both here on the blog and on LinkedIn. There was also some epic discussion — well, an argument — about the Lusi post, as it transpired that the story was more complicated that I originally suggested (it always is!). Anyway, it's the first debate I've seen on the web about a sonic log. And there continues to be promising engagement on the Earth Science Stack Exchange. It needs more applied science questions, and really just more people. Maybe you have a question to ask...?

Géophysiciens avec des ordinateurs

Don't forget there's the hackathon next weekend! If you're in Denver, free come along and soak up the geeky rays. If you're around on the afternoon of Sunday 26 October, then drop by for the demos and prizes, and a local brew, at about 4 pm. It's all happening at Thrive, 1835 Blake Street, a few blocks north of the convention centre. We'll all be heading to the SEG Icebreaker right afterwards. It's free, and the doors will be open.

A fossil book

We're proud to announce the latest book from Agile Libre. Woot!

I can't take a lot of credit for this book... The idea came from 52 Things stalwart Alex Cullum, a biostratigrapher I met at Statoil in Stavanger in my first proper job. A fellow Brit, he has a profound enthusiasm for all things outside, and for writing and publishing. With able help from Allard Martinius, also a Statoil scientist and a 52 Things author from the Geology book, Alex generously undertook the task of inviting dozens of awesome palaeontologists, biostratigraphers, palynologists, and palaeobotanists from all over the world, and keeping in touch as the essays came in. Kara and I took care of the fiddly bits, and now it's all nearly done. It is super-exciting. Just check out some of the titles:

  • A trace fossil primer by Dirk Knaust
  • Bioastronomy by Simon Conway Morris
  • Ichnology and the minor phyla by S George Pemberton
  • A walk through time by Felix Gradstein
  • Can you catch criminals with pollen? by Julia Webb
  • Quantitative palaeontology by Ben Sloan

It's a pretty mouthwatering selection, even for someone like me who mostly thinks about seismic these days. There are another 46 like this. I can't wait to read them, and I've read them twice already.

Help a micropalaeontologist

The words in these books are a gift from the authors — 48 of them in this book! — to the community. We cherish the privilege of reading them before anyone else, and of putting them out into the world. We hope they reach far and have impact, inspiring people and starting conversations. But we want these books to give back to the community in other ways too, so from each sale we are again donating to a charity. This time it's the Educational Trust of The Micropalaeontological Society. I read about this initiative in a great piece for Geoscientist by Haydon Bailey, one of our authors: Micropalaeontology under threat!. They need our community's support and I'm excited about donating to them.

The book is in the late stages of preparation, and will appear in the flesh in about the middle of November. To make sure you get yours as soon as it's ready, you can pre-order it now.

Pre-order now from Amazon.com 
Save almost 25% off the cover price!

It's $14.58 today, but Amazon sets the final price...

Great geophysicists #12: Gauss

Carl Friedrich Gauss was born on 30 April 1777 in Braunschweig (Brunswick), and died at the age of 77 on 23 February 1855 in Göttingen. He was a mathematician, you've probably heard of him; he even has his own Linnean handle: Princeps mathematicorum, or Prince of mathematicians (I assume it's the royal kind, not the Purple Rain kind — ba dum tss).

Gauss's parents were poor, working class folk. I wonder what they made of their child prodigy, who allegedly once stunned his teachers by summing the integers up to 100 in seconds? At about 16, he was quite a clever-clogs, rediscovering Bode's law, the binomial theorem, and the prime number theorem. Ridiculous.

His only imperfection was that he was too much of a perfectionist. His motto was pauca sed matura, meaning "few, but ripe". It's understandable how someone so bright might not feel much need to share his work, but historian Eric Temple Bell reckoned that if Gauss had published his work regularly, he would have advanced mathematics by fifty years.

He was only 6 when Euler died, but surely knew his work. Euler is the only other person who made comparably broad contributions to what we now call the exploration geophysics toolbox, and applied physics in general. Here are a few: 

  • He proved the fundamental theorems of algebra and arithmetic. No big deal.
  • He formulated the Gaussian function — which of course crops up everywhere, especially in geostatistics. The Ricker wavelet is a pulse with frequencies distributed in a Gaussian.
  • The gauss is the cgs unit of magnetic flux density, thanks to his work on the flux theorem, one of Maxwell's equations.
  • He discovered the Cauchy integral theorem for contour integrals but did not publish it.
  • The 'second' or 'total' curvature — a coordinate-system-independent measure of spatial curvedness — is named after him.
  • He made discoveries in non-Euclidean geometry, but did not publish them.

Excitingly, Gauss is the first great geophysicist we've covered in this series to have been photographed (right). Unfortunately, he was already dead. But what an amazing thing, to peer back through time almost 160 years.

Next time: Augustin-Jean Fresnel, a pioneer of wave theory.

10 ways to improve your data store

When I look at the industry's struggle with the data mess, I see a parallel with science's struggle with open data. I've written lots about that before, but the basic idea is simple: scientists need discoverable, accessible, documented, usable data. Does that sound familiar?

I wrote yesterday that I think we have to get away from the idea that we can manage data like we might manage a production line. Instead, we need to think about more organic, flexible strategies that cope with and even thrive on chaos. I like, or liked until yesterday, the word 'curation', because it implies ongoing care and a focus on the future. But my friend Eric Marchand was right in his comment yesterday — the dusty connotation is too strong, and dust is bad for data. I like his supermarket analogy: packaged, categorized items, each with a cost of production and a price. A more lively, slightly chaotic market might match my vision better — multiple vendors maintaining their own realms. One can get carried away with analogies, but I like this better than a library or museum.

The good news is that lots of energetic and cunning people have been working on this idea of open data markets. So there are plenty of strategies we can try, alongside the current strategy of giving giant service companies millions of dollars for their TechCloud® Integrated ProSIGHT™ Data Management Solutions.

Serve your customer:

  • Above all else, build what people need. It's amazing that this needs to be said, but ask almost anyone what they think of IT at their company and you will know that it is not how it works today. Everything you build should be in response to the business pulling. 
  • This means you have to get out of the building and talk to your customers. In person, one-one-one. Watch them use your systems. Listen to them. Respond to them. 

Knock down the data walls:

  • Learn and implement open data practices inside the organization. Focus on discoverability, accessiblity, documentation of good-enough data, not on building The One True Database. 
  • Encourage and fund open data practices among providers of public data. There is a big role here for our technical societies, I believe, but I don't think they have seen it yet.

I've said it before: hire loads of geeks:

  • The web (well, intranet) is your pipeline. Build and maintain proper machine interfaces (APIs and web APIs) for data. What, you don't know how to do this? I know; it means hiring web-savvy data-obsessed programmers.
  • Bring back the hacker technologists that I think I remember from the nineties. Maybe it's a myth memory, but sprinkled around big companies there used to be super-geeks with degrees in astrophysics, mad UNIX skills, and the Oracle admin password. Now it's all data managers with Petroleum Technology certificates who couldn't write an awk script if your data depended on it (it does). 
  • Institute proper data wrangling and analysis training for scientists. I think this is pretty urgent. Anecdotal evidence: the top data integration tools in our business is PowerPoint... or an Excel chart with two y-axes if we're talking about engineers. (What does E&P mean?)

Three more things:

  • Let data live where it wants to live (databases, spreadsheets, wikis, SharePoint if you must). Focus on connecting data with APIs and data translators. It's pointless trying to move data to where you want it to be — you're just making it worse. ("Oh, you moved my spreadsheet? Fine, I will copy my spreadsheet.")
  • Get out of the company and find out what other people are doing. Not the other industry people struggling with data — they are just as clueless as we are. Find out what the people who are doing amazing things with data are doing: Google, Twitter, Facebook, data.gov, Wikipedia, Digital Science, The New York Times, The Guardian,... there are so many to choose from. We should invite these people to our conferences; they can help us.
  • If you only do one thing, fix search in your company. Stop tinkering with semantic ontologies and smart catalogs, just buy Google Search Appliance and fix it. You can get this one done by Christmas.

Last thing. If there's one mindset that will really get in the way, it's the project mindset. If we want to go beyond coping with the data mess, far beyond it to thriving on it, then we have to get comfortable with the idea that this is not a project. The word is banned, along with 'initiative', 'governance', and Gantt charts. The requirements you write on the back of a napkin with three colleagues will be just as useful as the ones you get back from three months of focus groups.

No, this is the rest of your career. This is never done, next year there are better ideas, more flexible libraries, faster hardware, and new needs. It's like getting fit: this ain't an 8-week get-fit program, it's an eternity of crunches.

The photograph of Covent Market in London, Ontario is from Boris Kasimov on Flickr.

Data management fairy tales

On Tuesday I read this refreshing post in LinkedIn by Jeffrey Maskell of Westheimer Energy Consultants. It's a pretty damning assessment of the current state of data management in the petroleum industry:

The fact is that no major technology advances have been seen in the DM sector for some 20 years. The [data management] gap between acquisition and processing/interpretation is now a void and is impacting the industry across the board...

I agree with him. But I don't think he goes far enough on the subject of what we should do about it. Maskell is, I believe, advocating more effort (and more budget) developing what the data management crowd have been pushing for years. In a nutshell:

I agree that standards, process, procedures, workflows, data models are all important; I also agree that DM certification is a long term desirable outcome. 

These words make me sad. I'd go so far as to say that it's the pursuit of these mythical ideas that's brought about today's pitiful scene. If you need proof, just look around you. Go look at your shared drive. Go ask someone for a well file. Go and (a) find then (b) read your IT policies and workflow documents — they're all fairy tales.

Maskell acknowledges at least that these are not enough; he goes on:

However I believe the KEY to achieving a breakthrough is to prove positively that data management can make a difference and that the cost of good quality data management is but a very small price to pay...

No, the key to achieving a breakthrough is a change of plan. Another value of information study just adds to the misery.

Here's what I think: 'data management' is an impossible fiction. A fairy tale.

You can't manage data

I'm talking to you, big-company-data-management-person.

Data is a mess, and it's distributed across your organization (and your partners, and your government, and your data vendors), and it's full of inconsistencies, and people store local copies of everything because of your broken SharePoint permissions, and... data is a mess.

The terrible truth you're fighting is that subsurface data wants to be a mess. Subsurface geoscience is not accounting. It's multi-dimensional. It's interdependent. Some of it is analog. There are dozens, maybe hundreds of formats, many of which are proprietary. Every single thing is unquantifiably uncertain. There are dozens of units. Interpretation generates more data, often iteratively. Your organization won't fund anything to do with IT properly — "We're an oil company, not a technology company!" — but it's OK because VPs only last 2 years. Well, subsurface facts last for decades.

You can't manage data. Try something else.

The principle here is: cope don't fix.

People earnestly trying to manage data reminds me of Yahoo trying to catalog the Internet in 1995. Bizarrely, they're still doing it... for 3 more months anyway. But we all know there's only one way to find things on the web today: search. Search transcends the catalog. 

So what transcends data management? I've got my own ideas, but first I really, really want to know what you think. What's one thing we could do — or stop doing — to make things a bit better?

Not picking parameters

I like socks. Bright ones. I've liked bright socks since Grade 6. They were the only visible garment not governed by school uniform, or at least not enforced, and I think that was probably the start of it. The tough boys wore white socks, and I wore odd red and green socks. These days, my favourites are Cole & Parker, and the only problem is: how to choose?

Last Tuesday I wrote about choosing parameters for geophysical algorithms — window lengths, velocities, noise levels, and so on. Like choosing socks, it's subjective, and it's hard to find a pair for every occasion. The comments from Matteo, Toastar, and GuyM raised an interesting question: maybe the best way to pick parameters is to not pick them? I'm not talking about automatically optimizing parameters, because that's still choosing. I'm talking about not choosing at all.

How many ways can we think of to implement this non-choice? I can think of four approaches, but I'm not 100% sure they're all different, or if I can even describe them...

Is the result really optimal, or just a hard-to-interpret patchwork?

Adaptivity

Well, okay, we still choose, but we choose a different value everywhere depending on local conditions. A black pair for a formal function, white for tennis, green for work, and polka dots for special occasions. We can adapt to any property (rather like automatic optimization), along any dimension of our data: spatially, azimuthally,  temporally, or frequentially (there's a word you don't see every day).

Imagine computing seismic continuity. At each sample, we might evaluate some local function — such as contrast — for a range of window sizes. Or, when smoothing, we might specifiy some minimum signal loss compared to the original. We end up using a different value everywhere, and expect an optimal result.

One problem is that we still have to choose a cost function. And to be at all useful, we would need to produce two new data products, besides the actual result: a map of the parameter's value, and a map of the residual cost, so to speak. In other words, we need a way to know what was chosen, and how satisfactory the choice was.

Stochastic shotgun

We could fall back on that geostatistical favourite and pick the parameter values stochastically, grabbing socks at random out of the drawer. This works, but I need a lot of socks to have a chance of getting even a local maximum. And we run into the old problem of really not knowing what to do with all the realizations. Common approaches are to take the P50, P10, and P90, or to average them. Both of these approaches make me want to ask: Why did I generate all those realizations?

Experimental design methods

The design of experiments is a big deal in the life sciences,  but for some reason rarely (never?) talked about in geoscience. Applying a cost function, or even just visual judgment, to a single parameter is perhaps trivial, but what if you have two variables? Three? What if they are non-linear and covariant? Then the optimization process amounts to a sticky inverse problem.

Fortunately, lots of clever people have thought about these problems. I've even seen them implemented in subsurface software. Cool-sounding combinatorial reduction techniques like Greco-Latin squares, or Latin hypercubes offer ways to intelligently sample the parameter space and organize the results. We could do the same with socks, evaluating pattern and toe colour separately...

The mixing board

There is another option: the mixing board. Like a music producer, a film editor, or the Lytro camera, I can leave the raw data in place, and always work from the masters. Given the right tools, I can make myself just the right pair of socks whenever I like.

This way we can navigate the parameter space, applying views, processes, or other tools on the fly. Clearly this would mean changing everything about the way we work. We'd need a totally different approach not just to interpretation, but to the entire subsurface characterization workflow.

Are there other ways to avoid choosing? What are people using in other industries, or other sciences? I think we need to invite some experimental design and machine learning people to SEG...

Cole & Parker socks are awesomeThe quilt image is by missvancamp on Flickr and licensed CC-BY. The spools are by surfzone on Flickr, licensed CC-BY. Many thanks to Cole & Parker for permission to use the sock images, despite not knowing what on earth I was going to do with them. Buy their socks! They're Canadian and everything.

The hackathon is coming

The Geophysics Hackathon is one month away! Signing up is not mandatory — you can show up on the day if you like — but it does help with the planning. It's 100% free, and I guarantee you'll enjoy yourself. You'll also learn tons about geophysics and about building software. Deets: Thrive, Denver, 8 am, 25–26 October. Bring a laptop.

Need more? Here's all the info you could ask for. Even more? Ask by email or in the comments

Send your project ideas

The theme this year is RESOLUTION. Participants are encouraged to post projects to hackathon.io ahead of time — especially if you want to recruit others to help. And even if you're not coming to the event, we'd love to hear your project ideas. Here are some of the proto-ideas we have so far: 

  • Compute likely spatial and temporal resolution from some basic acquisition info: source, design, etc.
  • Do the same but from information from the stack: trace spacing, apparent bandwidth, etc.
  • Find and connect literature about seismic and log resolution using online bibliographic data.
  • What does the seismic spectrum look like, given STFT limitations, or Gabor uncertainty?

If you have a bright idea, get in touch by email or in the comments. We'd love to hear from you.

Thank you to our sponsors

Three forward-thinking companies have joined us in making the hackathon as much a geophysics party as well as a scientific workshop (a real workshop). I think this industry may have trained us to take event sponsorship for granted, but it's easy to throw $5000 at the Marriott for Yet Another Coffee Break. Handing over money to a random little company in Nova Scotia to buy coffee, tacos, and cool swag for hungry geophysicists and programmers takes real guts! 

Please take a minute to check out our sponsors and reward them for supporting innovation in our community. 

dGB GeoTeric OGS

Students: we are offering $250 bursaries to anyone looking for help with travel or accommodation. Just drop me a line with a project idea. If you know a student that might enjoy the event, please forwadrd this to them.

Picking parameters

One of the reasons I got interested in programming was to get smarter about broken workflows like this one from a generic seismic interpretation tool (I'm thinking of Poststack-PAL, but does that even exist any more?)...

  1. I want to make a coherence volume, which requires me to choose a window length.
  2. I use the default on a single line and see how it looks, then try some other values at random.
  3. I can't remember what I did so I get systematic: I try 8 ms, 16 ms, 32 ms, and 64 ms, saving each one as a result with _XXms appended so I can remember what I did
  4. I display them side by side but the windows are annoying to line up and resize, so instead I do it once, display them one at a time, grab screenshots, and import the images into PowerPoint because let's face it I'll need that slide eventually anyway
  5. I can't decide between 16 ms and 32 ms so I try 20 ms, 24 ms, and 28 ms as well, and do it all again, and gaaah I HATE THIS STUPID SOFTWARE

There has to be a better way.

Stumbling towards optimization

Regular readers will know that this is the time to break out the IPython Notebook. Fear not: I will focus on the outcomes here — for the real meat, go to the Notebook. Or click on these images to see larger versions, and code.

Let's run through using the Canny edge detector in scikit-image, a brilliant image processing Python library. The algo uses the derivative of a Gaussian to compute gradient, and I have to choose 3 parameters. First, we'll try to optimize 'sigma', the width of the Gaussian. Let's try the default value of 1:

Clearly, there is too much noise in the result. Let's try the interval method that drove me crazy in desktop software:

Well, I think something between 8 and 16 might work. I could compute the average intensity of each image, choose a value in between them, and then use the sigma that gives that result. OK, it's a horrible hack, but turns out to be 10:

But the whole point of scientific computing is the efficient application of informed human judgment. So let's try adding some interactivity — then we can explore the 3D parameter space in a near-parallel instead of purely serial way:

I finally feel like we're getting somewhere... But it still feels a bit arbitrary. I still don't know I'm getting the optimal result.

What can I try next? I could try to extend the 'goal seek' option, and come up with a more sophisticated cost function. If I could define something well enough — for edge detection, like coherence, I might be interested in contrast — then I could potentially just find the best answers, in much the same way that a digital camera autofocuses (indeed, many of them look for the highest contrast image). But goal seeking, if the cost function is too literal, in a way begs the question. I mean, you sort of have to know the answer — or something about the answer — before you find it.

Social machines

Social machines are the hot new thing in computing (Big Data is so 2013). Perhaps instead I can turn to other humans, in my social and professional networks. I could...

  • Ask my colleagues — perhaps my company has a knowledge sharing network I can go to.
  • Ask t'Internet — I could ask Twitter, or my friends on Facebook, or a seismic interpretation group in LinkedIn. Better yet, Earth Science Stack Exchange!
  • What if the software I was using just told me what other people had used for these parameters? Maybe this is only one step up from the programmer's default... especially if most people just use the programmer's default.
  • But what if people could rate the outcome of the algorithm? What if their colleagues or managers could rate the outcome? Then I could weight the results with these ratings.
  • What if there was a game that involved optimizing images (OK, maybe a bit of a stretch... maybe more like a Mechanical Turk). Then we might have a vast crowd of people all interested in really pushing the edge of what is intuitively reasonable, and maybe exploring the part of the parameter space I'm most interested in.

What if I could combine the best of all these approaches? Interactive exploration, with guided optimization, constrained by some cost function or other expectation. That could be interesting, but unfortunately I have absolutely no idea how that would work. I do think the optimization workflow of the future will contain all of these elements.

What do you think? Do you have an awesome way to optimize the parameters of seismic attributes? Do you have a vision for how it could be better? It occurs to me this could be a great topic for a future hackathon...

ipynb_icon.png
Click here for an IPython Notebook version of this blog post. If you don't have it, IPython is easy to install. The easiest way is to install all of scientific Python, or use Canopy or Anaconda.