
Hooke's oolite
/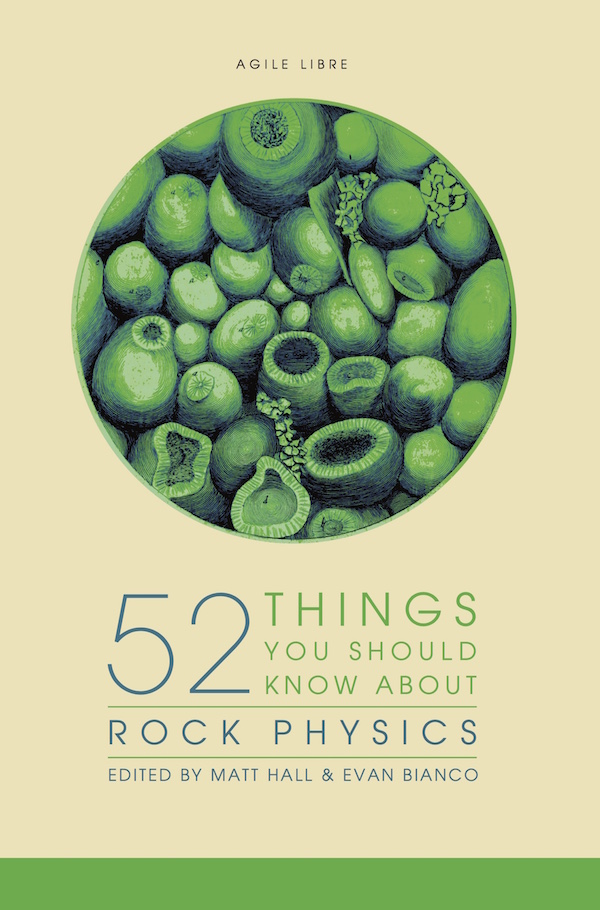
52 Things You Should Know About Rock Physics came out last week. For the first, and possibly the last, time a Fellow of the Royal Society — the most exclusive science club in the UK — drew the picture on the cover. The 353-year-old drawing was made by none other than Robert Hooke.

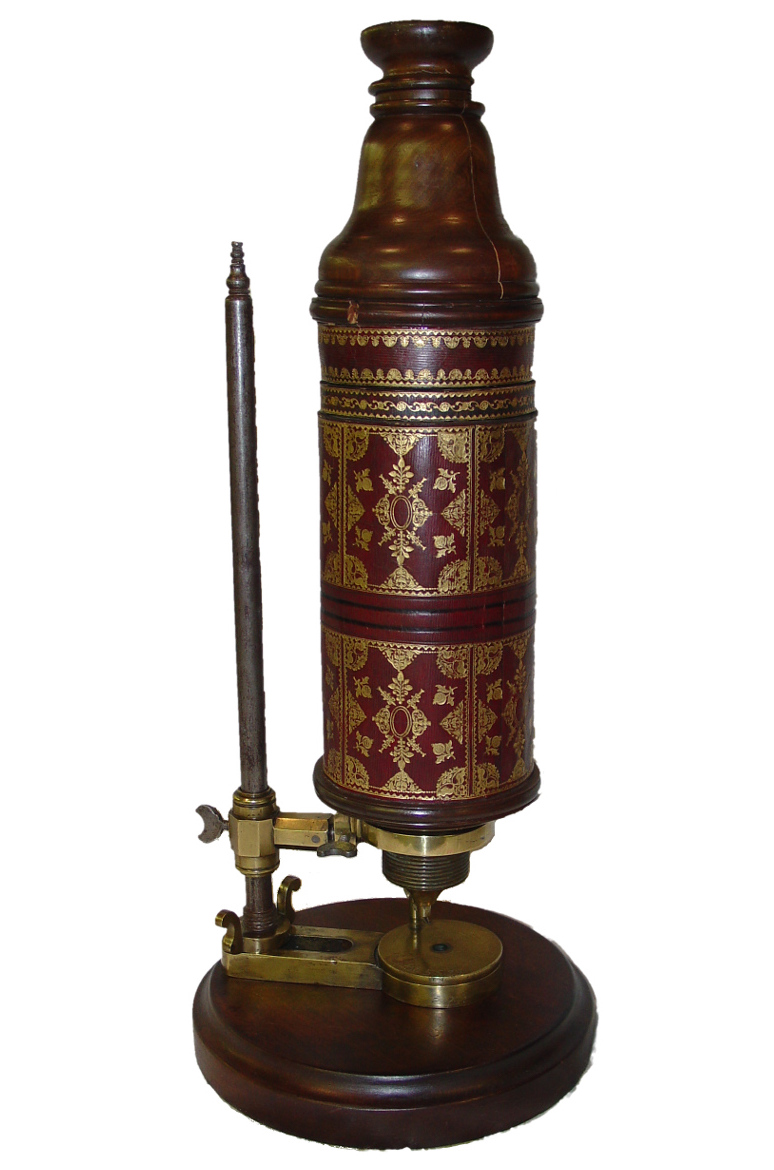
The title page from Micrographia, and part of the dedication to Charles II. You can browse the entire book at archive.org.
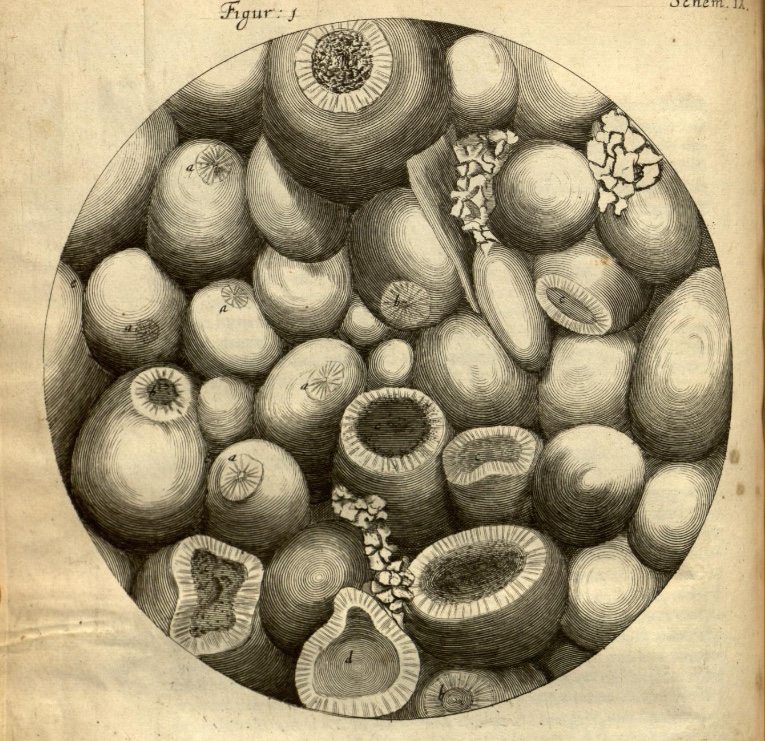
The drawing, or rather the engraving that was made from it, appears on page 92 of Micrographia, Hooke's groundbreaking 1665 work on microscopy. In between discovering and publishing his eponymous law of elasticity (which Evan wrote about in connection with Lamé's \(\lambda\)), he drew and wrote about his observations of a huge range of natural specimens under the microscope. It was the first time anyone had recorded such things, and it was years before its accuracy and detail were surpassed. The book established the science of microscopy, and also coined the word cell, in its biological context.
Sadly, the original drawing, along with every other drawing but one from the volume, was lost in the Great Fire of London, 350 years ago almost to the day.
Ketton stone
The drawing on the cover of the new book is of the fractured surface of Ketton stone, a Middle Jurassic oolite from central England. Hooke's own description of the rock, which he mistakenly called Kettering Stone, is rather wonderful:

I wonder if anyone else has ever described oolite as looking like the ovary of a herring?

These thoughtful descriptions, revealing a profundly learned scientist, hint at why Hooke has been called 'England's Leonardo'. It seems likely that he came by the stone via his interest in architecture, and especially through his friendsip with Christopher Wren. By 1663, when it's likely Hooke made his observations, Wren had used the stone in the façades of several Cambridge colleges, including the chapels of Pembroke and Emmanuel, and the Wren Library at Trinity (shown here). Masons call porous, isotropic rock like Ketton stone 'freestone', because they can carve it freely to make ornate designs. Rock physics in action!
You can read more about Hooke's oolite, and the geological significance of his observations, in an excellent short paper by material scientist Derek Hull (1997). It includes these images of Ketton stone, for comparison with Hooke's drawing:

Reflected light photomicrograph (left) and backscatter scanning electron microscope image (right) of Ketton Stone. Adapted from figures 2 and 3 of Hull (1997). Images are © Royal Society and used in accordance with their terms.
I love that this book, which is mostly about the elastic behaviour of rocks, bears an illustration by the man that first described elasticity. Better still, the illustration is of a fractured rock — making it the perfect preface.
Now at Amazon.com — Amazon.co.uk — Amazon.fr — Amazon.de — Amazon.it — Amazon.es
Soon at Amazon.ca — Amazon.com.mx — Amazon.com.br — Amazon.co.jp — Amazon.com.au — Amazon.in
References
Hall, M & E Bianco (eds.) (2016). 52 Things You Should Know About Rock Physics. Nova Scotia: Agile Libre, 134 pp.
Hooke, R (1665). Micrographia: or some Physiological Descriptions of Minute Bodies made by Magnifying Glasses, pp. 93–100. The Royal Society, London, 1665.
Hull, D (1997). Robert Hooke: A fractographic study of Kettering-stone. Notes and Records of the Royal Society of London 51, p 45-55. DOI: 10.1098/rsnr.1997.0005.


 Except where noted, this content is licensed